Six Frustrations with Precision ag

“Growers tell me they are frustrated with precision ag, they’ve invested in the technology. I tell them, ‘You just want to put the pieces of the puzzle together to see exactly what the picture is.’ And they are relieved when Premier Crop can help.”

– Katie McWhirter, Director of Training and Development


RENEE HANSEN: Today, we’re talking with Katie McWhirter, our Manager of Training and Development. Katie is chatting with us about the frustrations of precision ag.  Katie, tell us a little bit about your background and a little more about you and your role at Premier Crop?

KATIE MCWHIRTER: I was born on your typical farm in southeast Iowa, livestock and row crop. My father’s just now retiring, but funny as he is, he is in his late sixties, and in 2013, he invested in electric drives to be able to variable-rate seed. He variable-rates his fertilizer. He does all that, which is so not what people think of that generation, embracing technology like that, but he knew that, working with me, he’d be able to make use of that equipment that he was investing in. Then, on the flip side, I have a brother who was, I guess for lack of better words, gifted or brought into the row crop world. He’s actually in the livestock industry and doesn’t have that technology, but we started talking one day, and he said: ‘I think I can use my data to do better. It’s not that good.’ So, talking with him, does he have the latest and greatest? No. But, again, his data is everywhere, and it’s just meeting him where he’s at to say, okay, I realize you don’t have this technology or this technology, but we can still use what you have to make a better decision. Even as recent as about an hour ago, I’m entering in some of his costs and his inputs to really make him see that there is variability within his operation even at a field level, which means profitability is variable at that field level. So, I’m excited to watch his journey as he gets more into this space.
20210405_170325

FRUSTRATION #1: CONNECTIVITY

RENEE HANSEN: So, Katie, what would you say? We were talking before we hit record on this podcast, how do you come up with a list of five to 10 things that growers don’t like or are frustrated about with ag technology?

KATIE MCWHIRTER: Well, those frustrations definitely vary in the different hats that I wear. Probably the biggest frustration is that these technologies, if you’re talking about in or on the equipment, would be that they don’t communicate together, especially if they’re not a solid color, meaning they’re not all the same brand of equipment. That is a frustration for growers. I would say, also, a very big frustration, and funny as I’ve been out here in the last couple weeks, growers don’t think that they could, I wouldn’t say, benefit from our services, but they’re very worried because they don’t think their data is good. So, it’s two combines, it’s three combines, it’s not calibrated. How can you change some of these frustrations? What we can do, is take that data, and as long as it’s capturing that variability and we have an end measurement, whether that’s going to be bushels or yield, we can post-calibrate or make that data usable within our system. I think even the simplest technologies really can benefit from what we do.

I think one of the things I’ve learned is that we really have to ask questions to these growers to find out, when they talk about ag technology, no different than what I did with you, to find out what exactly they’re frustrated with. If they’re frustrated with data, what do they mean by that? I mean, is it they’re frustrated because they’ve got two or three combines or two or three planters and it’s not all brought together? Is it because they don’t feel like they’re getting a complete picture? I met with a grower yesterday who said: ‘The soil sampling is here. We’ve got these spreadsheets on our computer. Their data’s all over the place.’ I smiled, and I said: ‘You just want to put the pieces of the puzzle together to see exactly what the picture is.’ They’re like: ‘Yes, that’s what we want because we’ve invested in it. We know that each of those separately has been bringing us value, but it’s also bringing us frustration as we know we should be bringing them all together to make an even better decision.’

FRUSTRATION #2: DATA ISN’T GOOD ENOUGH

RENEE HANSEN: What was some of his biggest hesitation? I know you mentioned that he felt his data wasn’t good enough but elaborate on that a little bit more. Tell me more about that.

KATIE MCWHIRTER: Well, the yield monitor doesn’t have a card in it, so we haven’t been collecting yield data. So, I mean, the basics of what we’ve always said is a must. It’s really what we’re rooted in, but with our new planning tools, I immediately was like: ‘Okay, but there’s so much more we can do even by putting together, at the field level, his yield goals and his expected revenue and his variable-rated nutrients because he’s been grid sampling.’ Even though he doesn’t have what we, even a month ago, thought was an essential piece of what we had to have to be able to work with a grower, he’s going to test me on this one because he’ll get a yield monitor. That’s the agreement by fall, but I believe we can still provide him value being early enough and being able to identify his yield efficiency scores, his planned yield efficiency scores in each field, to be able to potentially identify profit robbers and how we could try to lessen that on his operation as a whole. Yeah, he definitely was hesitant until I showed him. I’m like: ‘Here’s what I need.’ And he immediately says to me, he’s pointing at the paper, and he’s like: ‘I’ve got this. I’ve got this. I’ve got this.’ I’m like: ‘Yeah, you’ve got the pieces. Let’s get them put together.’

RENEE HANSEN: Yeah, putting it together all in one system, and you also mentioned connection and connectivity. I mean, that seems to be everything’s everywhere. So, you also tell me, what are you doing to help him solve that and get all the information into one spot? I mean, you are doing some of the work for him.

KATIE MCWHIRTER: Right. So, I get the pleasure of contacting the people on his agronomy team. I think, before, some people might’ve seen us as the competition or a threat, and what I’ve said to both his seed supplier and his crop protection and fertilizer salesperson is I’m not here to step on your toes. I don’t sell those things. What I’m doing is I’m trying to help him be more profitable. That’s been fun to talk with his team, and, in fact, as soon as I start putting these pieces together, I want to meet with his team and show them what we’re trying to do for him in order to make him a more profitable farmer.
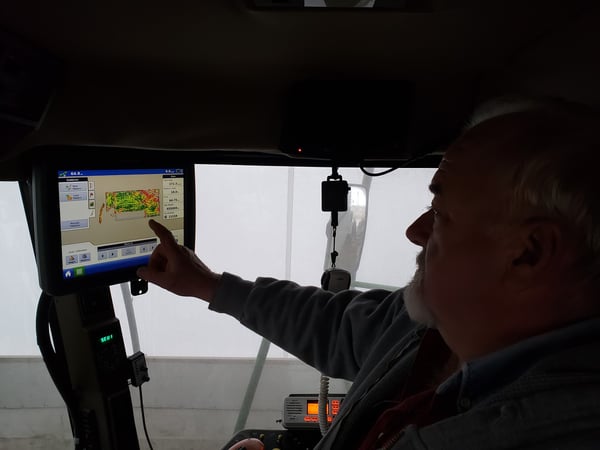
inthecabyieldmonitor

FRUSTRATION #3: DIFFERENT COLORS OF EQUIPMENT

RENEE HANSEN: Yeah, and what about the color of equipment with numerous different colors of equipment? Or the farmer, the grower, isn’t applying some of their inputs. Somebody else is doing it for them. How do we go about getting some of that information?

KATIE MCWHIRTER: Oh, definitely. Again, I met with another grower yesterday, and as we’re talking, sometimes they think all this information has to be captured somewhere or captured on a monitor. It has to be captured somewhere, but there are so many different pieces of information that we keep track of. I think that is a really big misconception, what data is. Some people, I’ve laughed, they think it’s a singular thing. For us, it’s a plural. I mean, so much data can be collected not necessarily on a monitor. So, putting that all together in one system, be able to look at it, to get a clear picture as far as what’s correlating yield or, more importantly, what’s driving profitability or, better yet, holding the entire operation back from being more profitable.

FRUSTRATION #4: IS A PRECISION AG SERVICE PROFITABLE 

RENEE HANSEN: Yeah, you’re talking about some of the things that they can start inputting and putting the pieces of the puzzle together. So, what’s the output? What do they get? What are we giving a grower? How is it going to benefit him?

KATIE MCWHIRTER: What it gives the grower is a clear picture of their operation as far as profitability, that return to land and management. The numbers don’t lie. I mean, I’ve always said the numbers do not lie. Take the emotion out of it, but that’s not where it stops. Essentially, it’s a continuous cycle. Don’t give me a pretty map, and that’s great, right? Don’t give me that. I need you to be able to, and our growers need us to be able to, without any bias, to say: ‘Here’s what we could do with it.’ Ultimately, it’s going to be the grower’s decision, and that’s what I was telling the grower yesterday. We’re never going to do anything that you don’t want to do, but we will challenge you as far as this is what we’re seeing in the data, and if you’re wanting to improve, it really looks like this is an area that we could focus on.

FRUSTRATION #5: FEAR OF CHANGING EVERYTHING AT ONCE

RENEE HANSEN: Yeah, something that you mentioned, Katie, was it’s a continuous cycle and how it’s never ending. You’re constantly learning. So, even at year one, there is so much that we can learn about. So, tell me, what does a grower learn at year one?

KATIE MCWHIRTER: Which is funny because, when I got back into working directly with growers, that was one of the questions that they asked me when we were first sitting down: ‘What do you think we’re going to learn this year?’ As I was getting all this data from him, and I’m like: ‘I don’t even want to take a guess.’ I have a suspicion, but I don’t want to say it out loud, but I think it was just their biggest ‘aha’ was I’ve never looked at my data like this before. I’ve seen it on the typical red, yellow, orange, three-shades-of-green map. Maybe I’ve done a little bit of comparison in some of these other platforms before, but never have I looked at it this way before. Whether that was in charts or in our data visualization tools and then, ultimately, to tie those costs back to it. Some of the things they thought, they were right, and some things they were kind of surprised, which has led to decisions. When I started with them in August, I mean, I told them I was not going to push them to anything that they didn’t want to do technology-wise. All of a sudden, we’re sitting down for our planning meeting in December. I’m like: ‘Oh my goodness. Four months ago, this is not where we were.’ I didn’t think this is where we were going, and now we’re jumping in the deep end of the pool. I don’t want you to do this and be uncomfortable. I want you very comfortable with the changes that you’re suggesting we make. That’s been fun, though, to lead people through because we all know that change is hard, and it’s very hard to get outside of our comfort zone. So, I actually start my sales training, my leadership training course, with: ‘Here’s your comfort zone, and outside of it, that’s where the magic happens.’ That’s so, so true with farmers.
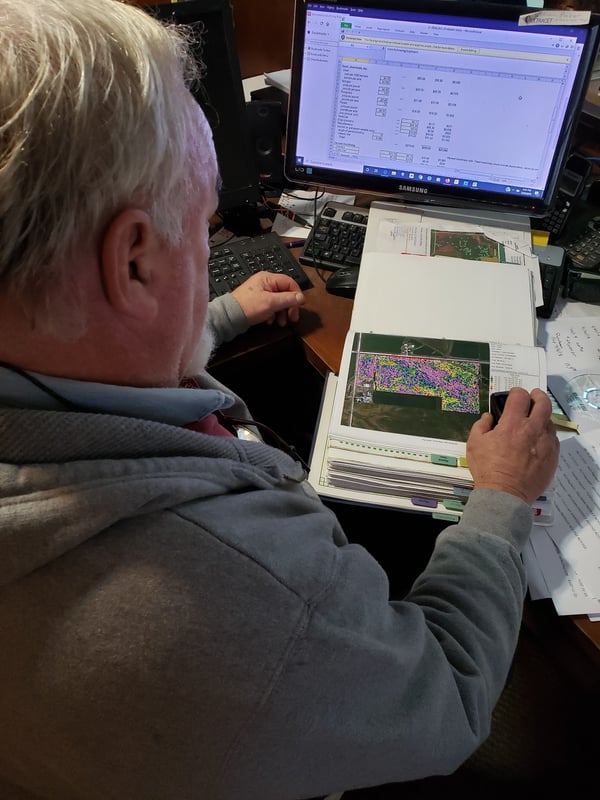
premiercropyielddata_farmer

FRUSTRATION #6: DATA IS OVERWHELMING

RENEE HANSEN: I really think, and I see it too, just within our own family operation too, that sometimes you can get so comfortable diving into something new, they want to, a grower wants to get into something new, but it’s like, where do you start? How do you get started? It’s having a service, something that Premier Crop offers, something that you offer, just helping them, starting to input the information, contacting the people to get the information, knowing who to contact. So, right now in 2021, we’re at the beginning of March. Why would a grower need to get involved in something like this? Why should they wait?

KATIE MCWHIRTER: I don’t think they should wait. I think it could seem very overwhelming and don’t know where to start. It just takes that conversation to get them going. Really, I say, that’s why it’s so wonderful that we have the great group of advisors that we have to guide them through this process. We all like to be guided. We all like to know what’s next. I don’t care if it’s the program at church, the bulletin to what’s next. Or when you get on an airplane overseas, and it’s saying: ‘Here’s what’s going to happen. Then, this.’ That just puts everybody to ease and guide them along. Our advisors, it’s like we farm with them. I mean, I know I wasn’t going to go back and farm, but that love of agriculture and helping farmers, that’s our group of advisers. That’s their characteristics, their qualities. They genuinely want to help because it’s like they’re farming.

RENEE HANSEN: Thanks for listening to the Premier Podcast, where everything agronomic is economic. Please subscribe, rate and review this podcast so we can continue to provide the best precision ag and analytic results for you. To learn more about Premier Crop, visit our blog at premiercrop.com.

Learn more about the power of precision ag.

Unlock Insights to Your Farming Operation

“Data is valuable, but data in the hands of the right people with the right context is really, really valuable.” – T.J. Masker


RENEE HANSEN: You are listening to the Premier Podcast, where everything agronomic is economic. Today, we are talking with T.J. Masker, Senior Product Manager at Tractor Zoom, headquartered in Urbandale, Iowa. They are focused on helping bring price transparency to farm equipment and valuations for farmers, bankers, equipment dealers and insurance companies. T.J. has a lot of experience and knowledge in the precision ag space, and today, I asked him questions on how to unlock new insights to your farming operation using precision ag. Hey, T.J., welcome to the Premier Podcast. Just wanted to talk to you a little bit about unlocking some of the new insights to a farming operation, and I know you have a lot of experience. So, can you tell us a little bit about your background?

T.J. MASKER: Yeah, I grew up on a small family farm in southwest Iowa and did the traditional thing. Went to Iowa State, got an ag business degree, but for the last, well, about 11 years of my career, I’ve been working directly with farmers, helping them manage and understand their data better. So, whether that be agronomic data like soil tests, machine data that we get around like fuel usage or, in my current role helping farmers really value farm equipment, as that’s becoming the second highest cost on the balance sheet. What we’re really trying to understand is how we can make better decisions from that data. But the common theme is that ever since I went to Iowa State and graduated college, I’ve been passionate about helping farmers with data to make better decisions.

RENEE HANSEN: Yeah, you’ve had a lot of experience with data since you’ve been working in the field. So, can you tell me that? What is your experience with other precision ag systems, and what makes data so important?

T.J. MASKER: Yeah, I remember this, probably, like it was yesterday. I was covering a territory in south-central Iowa for one of the major seed brands. And I had farmers who kept asking me, like: ‘What can we do with this data? How do we start to think about how we utilize it more?’ This was almost eight years ago, and I literally Googled, like, ‘farm data’ something or another, and it led me, ironically enough, to Premier Crop and filled out the ‘contact us’ button. Then, I think it was Tony or Ben or somebody who reached out to me about: ‘Hey, we’d love to talk to you, understand where you’re coming from.’ And that ultimately led me to working with Premier Crop about seven-and-a-half years ago and doing direct advising with farmers in central Iowa. And many of those farms that I worked with back in the day, I’m still really close with today as I’m trying to solve new and unique problems, but I think, at that time, I had zero experience with precision ag. So, I had to learn how to set up the monitors, what Ag Leader SMS was, what software was to make better decisions. It was also my job to go out and recruit farms and help their operation. So, I think, over that time, I had to learn a tremendous amount about precision ag, what it was capable of. But, ultimately, I think for me, what it came down to is there’s so much value in this data and what we can get out of it if we’re measuring things correctly. And I think one of the things I experienced, even with the farms that have been collecting data for 15 years, was that, man, if we get this data structured in a way, it’s going to allow us to unlock so much potential. And whether that be if you’re using Climate FieldView or using John Deere Ops Center or using Granular, where I was at. It doesn’t matter unless the data is structured in a way that you can get the results out of it. And that, to me, was always the biggest ‘light bulb moment’ for a lot of the farmers.

RENEE HANSEN: Yeah, so since you’ve had the experience working with multiple different systems, what makes a specific platform better than another?

T.J. MASKER: When I talk to farmers about it, it’s really measuring the ROI, I think. Dan, I probably coined his phrase too, but if every agronomic decision is an economic decision, and we think about things that way, it fundamentally changes why we might do something. So, I think about systems that are able to actually provide that value to you as a farmer, and there’s not a ton of them out there. But we also need those systems that allow us to move data more easily. So, that’s why Climate, John Deere Ops Center, Ag Leader AgFiniti is another great example. Those tools help us get the data from the farm into the trusted advisor or the partner’s hands really quickly to make better decisions. That is valuable. I can tell you that there’s a reason why those tools are so heavily used because it solves a pain point. What I like to think about is: that’s one step. The next step is taking all this data and turning it into a better plan for next year. So, if I was at Granular, the way I described this problem is like: ‘I need to understand what we did and then how we did to understand what we need to do differently next year.’ So, if you focus on farmers collecting all this data on what they did, let’s get the scorecard for how they did at the end of the year. So, tools like Premier Crop. You think about all the things you can do with the query tool to answer questions from your data. Then, the real power is like: ‘All right. Using all this data, I now know with a high level of confidence going into next year that I’m going to have the best possible plan I can have.’ Mother Nature and God willing, things are going to fall into place. Well, let’s use everything we’ve learned to come up with the best possible plan, and we’ll adjust in season, right? Planting could get delayed by two weeks, so we might have to adjust seeding rates. All those things come into play, but let’s start with the best possible plan. And I think that starts with collecting and analyzing really great data throughout the previous growing season or previous seasons if you will, if you think about how many years of data a farm might have.

iStock-653836730

RENEE HANSEN: Yeah, I think you said something in there, like competence, where a grower just really needs to have that competence within the data. They’re collecting so much of it anyway. So, getting a grower started, it seems really overwhelming sometimes, just to get started with data because of the systems that you mentioned. They have Climate. They’re using John Deere Ops. Then, to add another system to their whole platform can seem really overwhelming.

T.J. MASKER: What’s funny is I’ve done customer discovery the last seven-plus years in my different product roles, and if you talk to every farmer, they’ll tell you they just want one system to manage everything. And the reality is that’s not possible. I think what we need to do as an industry to be better is to make things connected more easily, and you’re starting to see that. And the easier we can make it to connect different parts of the puzzle to the key people that need it, that is where you really drive value for the farmer. Because if you think about all the trusted people that the farmer is working for, you’ve got agronomists. You’ve got an equipment dealer. You’ve got a seed rep. You’ve got a banker. You’ve got probably a commodity broker advisor, potentially. So, you start to see all of these people that are helping the farmer with all the information that they have. It becomes really powerful if you can connect all those dots, and I think, for a while, we as an ag industry or a tech industry didn’t do a good job of this. I think everyone was trying to build a complete way to solve every problem. And now you’re starting to see that change quite a bit, and I believe it’s for the better because the more connected these things are, and the less you can alleviate a lot of the pain of getting data from one spot to another, the better off everyone’s going to be.

RENEE HANSEN: In one of our previous podcasts, we talked about how you need to connect all the pieces of the puzzle, and it sounds exactly what you’re talking about. You just need to connect everything together. It’s one big puzzle, and when you finally get it together, it starts to work like it’s more of a system. Growers have all this information. They have these systems. They have monitors. They have the tractors, like you said, that they’re heavily invested in. So, why would they invest in a service that helps them manage their data, that helps them make better decisions? Why should they do that?

T.J. MASKER: Yeah, I think this is really important, and I think understanding who you’re partnering with is really important too, from a farmer perspective. So, I think you’re going to see a lot of the bigger ag companies continue to invest in this space for good reason, right? They know there’s a tremendous amount of value in this data. What I also think is extremely valuable is what that independent advisor can mean to your farm. For example, I was out at one of the farms I used to work with on Friday, and we talked a lot about this. If you think about 7-8 years ago, where they were at, they were trying to manage it in house. They were writing their own fertilizer recommendations. They were collecting all their data. And now, fundamentally, they’re approaching things differently, and every year they’re trying to chip away at this thing. So, a great example is when I started working with them 7½-8 years ago. We talked a lot about: ‘Wow, you guys can grow really great soybeans. What if we grew more soybeans, for example?’ It was funny to talk with them on Friday. And as they approach planting season this year, they’re going to start one planter on corn and one planter on soybeans at the same time because the data has shown them that if they get in earlier on soybeans and get those soybeans in, there is X-yield gain from that. And that wouldn’t have been the case seven-and-a-half years ago. What data allows us to do is to test little things, and the way I always approached it with farmers was like: ‘Give it three years.’ We have the data that tells us that this decision is likely to produce a positive outcome. If we try it, we can’t just try it for one year. We have to commit to trying it for three because odds are, over those three years, we’re going to see that return. So, I think that’s where the power of having a system or a service to manage that is critically important. And I think you’re starting to see a few others come up in this space, as well, because they probably realize a little bit of the model of that trusted advisor is the most powerful model. And it’s because, fundamentally — again, I think Dan will probably laugh — but agronomy is local. What works for the Des Moines Lobe might not work as well where I’m from in southwest Iowa. It might not work as well for my buddy that farms in eastern Iowa. Data’s valuable, but data in the hands of the right people with the right context is really, really valuable. I think a lot of farmers are frustrated with managing that data. So, how do you find somebody that can help you and kind of provide that ROI? And, at the end of the day, they have to prove their worth, right? Fundamentally, they have to prove their worth, but I think they’d be surprised what they would see from partnering with somebody like that.

RENEE HANSEN: Yeah, definitely. Like what you said, there is definitely a shift that you’re starting to see with farmers, that they are wanting to see more of their data and utilize more of their data, where in the past, there was a lot of resistance and maybe because the market was too flooded. So, what would you tell a farmer who has resistance to working with a precision ag service?

T.J. MASKER: Once, I think I called on a farm for three straight months that was resistant to this, and it wasn’t because they didn’t see the value. It was that this was a piece of their operation that was so important to them that they’d been trying to figure out. And I think one of the things is when you have a group that’s been around for, let’s say, 15-20 years, there’s a lot of value in that versus I might be a little bit more skeptical of somebody that’s only been around a year or two because there’s that track record there. So, what I would think about looking at is who has a track record? Do they have farmers that are willing to talk to them about why they decided to partner with this person? Because, at the end of the day, we know there’s value in the data, but maybe there’s an opportunity for a farmer to share their story with another farmer that’s a little bit resistant and tell them: ‘Hey, I was exactly where you were at seven years ago, and now the way we do things seven years later is fundamentally different.’ So, I would just be open to having that conversation with others that are finding success in this area and help them along in their journey.

RENEE HANSEN: Well, sometimes, you get in a pattern where you are very comfortable with what you’ve been doing the past years, and you’ve been successful. You’ve been profitable, but there comes a point where there’s a tipping point where your margins are starting to get a lot thinner, and a grower needs to maybe change some practices. And that data can tell you exactly what practices to change.

T.J. MASKER: Yeah, it definitely can. I mean, all these things come flooding back to my head, but you think about some of the marginal areas of your farm that just don’t produce much. We did the math 5-6 years ago, and it said: ‘Hey, if we don’t apply dry fertilizer on these spots, we can save an average of $5 an acre across all the acres.’ And the reason why we weren’t going to apply there is: one, we didn’t expect the return, and two, guess what? When we analyzed the soil test results by those areas, they were, a lot of times, the highest soil test values, which, if you back away from it, makes a ton of sense. Because if you’re applying the same rate of fertilizer across the field, and the good parts are taking off more, you’re going to see these lower-yielding spots, for example, have higher soil tests. So, you start to tell that story, and all of a sudden, you’re like: ‘Wow, just by doing that one thing, I’ve saved $5 an acre across all my acres.’ I don’t know what fertilizer prices are at today. Normally, I’d have a better pulse on it, but it might be higher. It might be $6-$7. I don’t know. But you start to approach things from that standpoint and manage each field like it’s its own kind of factory. I know there’s that analogy out there, but it really does make sense when you start to look at it at that level.

RENEE HANSEN: And a lot of companies are talking about data science and machine learning, and they’re trendy words. I don’t want farmers to get afraid of companies starting to use this because if they are resistant to using precision ag, they’re going to think: ‘Oh, well, now they’re just turning this into something that’s more automated.’ So, what do you think companies mean, and what should a farmer know about data science and machine learning within the precision ag space?

T.J. MASKER: Yeah, so companies are investing a lot of money into data science, and it’s an ability to take a lot of the data we have and try to learn really quickly. Versus a traditional method would be: ‘I’m going to evaluate this year’s crop. Then, I’m going to go around and, then, implement three practices that I learned from this year’s crop.’ Versus: ‘Hey, could we speed this up through data science and machine learning and try to learn from 15 crops and apply that knowledge to one year?’ What I will tell you is that most farms that I’ve worked with, and I still believe this to be the case today, is that they want to learn from the data on their own farm, but that also means that they can leverage data science on their own farm. So, the way I would think about it is to think about trials that you’re running. How are you setting them up? Because that truly is data science in its very, very simplistic form, but that’s what it is. We’re trying to test and validate things and use the data. Another trend, like with machine learning, is you’re going to hear more and more about ‘combine automation,’ which is real. I think I was listening to a podcast the other week about how they go out to a farm and demonstrate this to a farmer. Because most people would say: ‘Hey, I know I can adjust the settings on my combine better than any computer can.’ So, one of the things they do is they completely purposely set the settings wrong on the combine for one pass, push the button and watch it adjust. And they watch the farmers’ eyes light up with how quickly and how accurate those adjustments are, and I’ll tell you the tech side of things. As I’ve been talking to farmers specifically about equipment, the tech side of things is tying more and more into that equipment-buying decision. So, what technology are you using? Who’s the provider, whether it be John Deere or Case, or what’s the system that’s going to manage it? And they’re starting to talk more about making decisions for new combines based on automation, which is machine learning which taught that. I think you saw some announcements from John Deere in the last two weeks with the See & Spray technology with the acquisition of Blue River. So, this stuff is going to keep coming, and it’s going to come pretty fast. But at the end of the day, it’s just like a trial on the farm, where seeing is believing. And I think once you see this technology in the hands of different people, you’re going to see people adopt it at different rates, but I’m pretty bullish on the ‘combine automation’ stuff just because of what I’ve seen and what it can do. And I know, from direct feedback from 50-plus farmers over the last four weeks, that is something that they’re looking at.

RENEE HANSEN: Yeah, it’s pretty incredible, the advancements that they’re making within the technology, just with the tractors, the combines. But, then, also kind of going back to that data, too, and data science, where if a grower is anywhat interested in their data, having to layer all of that in a spreadsheet of Excel and having your brain trying to figure it out, it’s just too difficult. Let the computer do the mathematics for you. I mean, that’s the whole purpose of the data science. It’s learning through your data. So, I’m just kind of reiterating what you were saying, T.J. You’ve shared a couple of stories. You shared that you talked with 50 farmers within the last four weeks. What are some of the most successful stories that you have from a farmer using precision ag?

T.J. MASKER: Yeah, I remember this was kind of the fun one and like the best case study that I have. It was that we started working on a problem, and the same thing applies to product management if I’m trying to solve a problem for a farmer. But it’s like: ‘What’s the goal here?’ And it’s like: ‘The goal was to increase soybean yields for this specific farm.’ They couldn’t get above 45 bushels. So, we started to break down the problem and study the group data that we had, to say, okay, well, we haven’t ‘limed’ in five years. Maybe that’s something we could do. Another thing that the farm hadn’t done in five years was try a different seed brand or variety. So, that’s another thing we could do. Another thing they typically did was only fertilized ahead of the corn crop. Okay. So, let’s split up that application. So, we literally picked a field and said: ‘We’re going to kitchen sink it, and we’re going to try everything we can. And we’re going to make sure we have trials set up within the field.’ I think we ended up hitting 75 or 80 bushels per acre, which was almost double what their average was. Now, granted, Mother Nature cooperated and rained when it needed to rain. But the point was we were able to say fungicide meant ‘this.’ A different variety meant ‘this.’ Using lime, dry fertilizer on this part of the field meant ‘this.’ And we literally laddered it up to that number. To me, we can spend a lot of money on inputs and resources, but doing that, and actually just calling it the ‘kitchen sink’ but having our checks in place, fundamentally changed how that farmer grew soybeans moving forward. And we were able to increase the average over a lot of acres, 15 bushels. But if we didn’t identify what the core issue was and start to think about how we strategically implement different tests, we would have never gotten there. And I laugh because the same thing exists in product development, where you’re trying to build things for farmers. It’s like: ‘What’s the problem we’re trying to solve? How do we prove value, and how do we incrementally get there?’ So, whether it’s agronomy or software development or building the next widget for a John Deere tractor, it’s all the same when you break it down. It’s how you solve problems and measure it to make improvements.

RENEE HANSEN: Well, that’s a great success story, and the fact that, just in one year, how much they can learn and then take it to the rest of their operation over the next 3-5-10 years. And the profit that you’re getting out of that service is tremendous. I mean, it’s definitely worth the cost of the service.

T.J. MASKER: Absolutely.

RENEE HANSEN: You mentioned a little bit about where precision ag is going in the future, but where do you think precision ag is in the software space? So, we talked a little bit about automation with tractors and combines, but what about in the software space? Where do you think precision ag is going?

T.J. MASKER: I think it’s going to continue to get ‘smarter,’ which is kind of an annoying tagline, but it’s going to get smarter about how much you’re applying what rate on what date. A lot of this, we’re getting so good at understanding the impact, and we have enough data to understand it. I also think I’m pretty confident — we saw it in a past experience. I see it in the current one. The value of the mobile device and whatever you have with you is going to continue to dominate this space from a software perspective. You think about: ‘I can pull up Climate or the Ops Center on my phone and have an answer really quickly. I want to show my landlord how the field yielded in a second.’ Farmers are going to continue, in my opinion, to demand that the tools they’re using be accessible from anywhere. And so, precision ag, yes, there’s the technology in the cab. Yes, that’s important. But I would argue that this device — the phone, the tablet — probably more so the phone than anything is going to continue to be such a critical piece. It’s how farmers run their business, and they expect to have things on their phone. So, I would think if I’m working with a provider, that is going to be one of my number-one needs, and it’s also going to drive a lot of engagement for that farm, as well, which is critical for any tool you’re trying to use because a farmer’s going to get value out of a lot of things. But having that answer really handy with them whenever they need it is very, very valuable.

iStock-489255170 - edited-1

RENEE HANSEN: Yeah, getting your data any time, anywhere, I think, is kind of a little tagline that we use, even with one of our mobile apps that we have within Premier Crop. But I think I agree with you that farmers want it. They want to pull it up, and they want to see it. They need to show it, whether that be the banker or the landlord themselves. So, they’re looking at the field, getting ready to plant, getting ready to harvest. All of the above.

T.J. MASKER: Yeah, and it has to be easy to use, which is such a challenge, right? Because if you talk to the 50 farmers that I’ve talked to, you’re trying to pull out the nuggets that are similar between all of them, but there are always unique use cases. But I think as long as you’re solving for the 90%, you’re going to be well on your way to help the farm make better decisions, which is ultimately everything that we’re about and trying to do.

RENEE HANSEN: Great. Well, thanks, T.J. Thanks so much for joining us today. Really enjoyed all of your knowledge and your experience and sharing on the Premier Podcast.

T.J. MASKER: Awesome. Thank you.

RENEE HANSEN: Thanks for listening to the Premier Podcast, where everything agronomic is economic. Please subscribe, rate and review this podcast so we can continue to provide the best precision ag and analytic results for you. And to learn more about Premier Crop, visit our blog at premiercrop.com/blog.

Learn more about farm profitability.

Get Started Using Your Farm Data

At Premier Crop, we say that agronomy is local. Farmers say it too, though, because we have such a vast amount of data within our system.

Working with Premier Crop doesn’t require a grower to be an expert on any one thing, because we’re using the data, along with our industry agronomy experience to deliver analytics and insights. We work with many business minded growers, people who really enjoy using data, but might not necessarily have the time to do it. The operations we work with are the CEOs of their farmings operations. Our advisors work with these growers to collect, manage, organize, and make sense of the data, letting the farmer farm as they want to, without any time invested.

We take care of everything, from variable-rate recommendations, cost tracking, to delivering the analysis in a way that a grower can easily understand. We all know that looking at data can be pretty overwhelming and hard to make sense of.

The baseline of everything we do is tied back to a yield file or yield map. So, one or two years of historical yield data is essentially the only thing we need to get started. There are roughly 80% of growers out there who are capable of collecting yield data, or maybe they already are collecting yield data, they just don’t know how to use it. Growers just need to have to have some yield data to get started. Another layer that’s helpful in providing more insights is soil data. However, the baseline to get started is yield data alone.

Precision ag can be overwhelming because there are so many different layers of data, from soil sample data, yield data, planting data, and as-applied data. The brainpower needed to add all of that up yourself can be exhausting.

Our ultimate goal is to help take that lift off of growers’ shoulders. The last thing many growers want to do after a long day is sit down at their computer and manage all of their data. That’s just another piece of the pie of the value that Premier Crop ultimately brings. Especially during busy seasons of the year, there are much more important tasks for them to focus on instead of messing around with data. That’s why our advisors help with the monitor and technical tasks. When it’s “go time,” it is a race against the clock, no matter what is going on.

Yield Efficiency is another tool that Premier Crop offers to help growers achieve success with their data.

By helping growers find their yield efficiency, we’re redefining the success metric for today’s farmer. For so long, growers have been solely focused on yield. Now, we have introduced the concept of yield efficiency and the conversation is shifting.

Yield efficiency is the amount of money in return from your crop that you have left over to pay land and management costs. Yield is the number-one driver of yield efficiency, but it also accounts for every other aspect of the farming operation as well. As long as we can drive higher yields while still lowering your break-even cost per bushel, we’re becoming more profitable. Profitability equals success with our growers. As long as we’re lowering that break-even cost per bushel and driving higher yields, we deem it as a successful season, whether it’s $10 an acre or $100 an acre farm profitability. We know there are dollars left on the table on every acre, so it’s just a matter of finding it with your farm data.

One big way to start improving your yield efficiency is by better managing your fertilizer investment. Make sure that you’re taking into account the crop removals when you’re making fertilizer recommendations.

Every year when you grow a crop on a piece of land, nutrients are taken off in the grain. As stated above, our main goal is to manage variability in yield. Within that variability in yield, you’re taking off different amounts of nutrients in different parts of the field. If you’re applying fertilizer the next season to account for the field average and crop removal, you’re ultimately under-applying in a lot of the field, but over-applying on a lot of the field, also.

That’s why at Premier Crop, we use the actual yield file to see exactly what we’ve taken off the field to replace it the next season. We use an equation so we’re not mining down the better areas of the field, and then over-applying in the worst areas of the fields. This practice could result in an extra $50 to $100 an acre for the grower. Many growers can do this with the variable-rate technology they have, they just need to put it to use and believe the fact that it pays off. Visit www.premiercrop.com for more information on farm efficiency.

farm efficiency

Understand Your Field Profitability

Now is always a good time to start managing your farm decisions at a finer scale.  If someone were to ask you if you know your cost of production, you’d likely have an idea.  But, when I say it’s time to manage at a ‘finer scale,’ the question that precedes it is, “Do you know how much it costs you to raise a bushel of grain in each unique part of your field—that is—as your productivity changes across the field?”

Most growers focus on understanding their costs and profitability based on assumed averages with an understanding that some ground is subsidizing other ground.  Growers understand diversification and spreading risk.

How could your management decisions change if you started to understand your field profitability based on actual field performance? While knowing field averages is important for marketing decisions in season, layering your costs with your actual yield data tells a different story.

Not all fields are created equal, we know that.  But how does it change our farming practices?  Understanding breakeven cost per bushel at a finer scale compared to the overall operation can change how you manage those fields.  Here are our 4 key takeaways that drive how we help growers understand their profitability and plan for the next year.

  1. There is drastic variability within each field
  2. Higher yields are key to success
  3. It’s important to know the ‘why’ behind profitability
  4. Look deeper into average production costs across your operation

______________________________________________________________________________

THERE IS DRASTIC VARIABILITY IN EACH FIELD

There are certain parts of your field that consistently outperform the field average. On the other end of the spectrum, there are parts of the field that produce well below the field average year after year. This shows that variability in your fields is real, so how are you going to manage this variability? We do this by using variable rate prescriptions to drive down your breakeven cost/bushel at the sub-field level. Below you will see an example of a field that had variable rate fertilizer and planting applied to it using our Management Zone method. As you can see, this grower invested $33.24/acre more into the A zone of the field versus the C zone of the field, but he was still able to lower the breakeven cost/bushel by $0.37/bushel.

One grower we’ll use as an example had not yet invested in variable rate seeding. He was variable rate spreading fertilizer based on actual yield combined with soil test data, but his seed costs were not always being covered by the bushels raised. He ran the numbers on how he could use technology to adapt his seed costs to the productivity of his fields, and decided to put electric drives on his planter for the next year.

HIGHER YIELDS ARE KEY TO SUCCESS

You can’t save your way to prosperity.  Choosing to cut costs in a way that is contrary to what is agronomically correct will not gain you bushels. Without bushels to cover your costs–ultimately you will not be profitable. Lenders can be quick to encourage cost-cutting. But cutting nutrient, plant health and pest management investments can cut yields and profitability.

We frequently lead our customers to spend more input dollars only on the best field zones creating higher margins. That is possible when you can track and record those cost/investment differences, then share a profitability analysis (see graphic above) at the end of the growing season.

In corn and soybean production, you can spend your way poor but you can’t save your way into prosperity. Frequently, the only way to lower your cost per bushel and increase profits is to produce higher yields.

FIGURE OUT THE ‘WHY’ BEHIND PROFITABILITY

Here is an example of a time where soybeans cost the grower more to raise than the grower had planned. Even when the average yield was 60 bu rather than the 50 bu estimate the banker used, the actual costs ended up just over $12/bu. We needed to figure out why, and what could be done differently to be profitable on soybeans. By looking at each breakeven cost per bushel map, the grower found some major problem areas in a few fields, mostly related to weed pressure and sandy soil. While he knew there were some issues in weedy areas, he could now visualize what it was truly costing –upwards of $19 per bushel on over 7 acres.  Contrast that with an adjacent high yielding area that only cost $7-10 per bushel of beans–it got their attention.

LOOK AT AVERAGE PRODUCTION COSTS ACROSS YOUR OPERATION

Using the same grower from above, his owned acres were covering high costs on their rented acres in a bigger way than he realized.  By looking at each fields’ cost per bushel map alongside a rank of their fields’ average production costs against each other, he found that his rented land was costing them $.50 more per bushel for corn and $.71 more per bushel on beans (when still assigning some value to the cost of owned land).

average production costs

Through transparency with multiple landowners and sharing of information, they had productive conversations. While rent was not lowered, it wasn’t raised on any of his acres. They also were able to show specific areas of fields that needed tile and could articulate what it was costing them.  One landowner signed a new flex lease agreement including execution of cost sharing for tiling.

__________________________________________________________________________

If you’re a grower reading this, you might be comparing your own breakeven costs to this example and thinking “I’m doing better than that.”  Our question to you would be—do you know that for sure?  Have you analyzed it to this degree?  You might still be leaving dollars on the table that could be in your pocket.

One of our biggest takeaways for understanding your field profitability is the understanding that managing differences in productivity is key. You need to increase profitability on every acre.  The best parts of the field can’t be relied on to cover the costs for the rest. Using technology and data analytics to prove what works in each unique environment so that it can be managed will be critical to your successes. If you don’t measure it, you can’t improve it!

New call-to-action

Put Your Data To Work

GPS technology has allowed growers to capture variability within a field – from yield to soils, fertility, pH, varieties, variable rate application and agronomic treatments. More than likely, you have accumulated binders full of color maps and hard drives full of files.

While collecting agronomic data is getting easier, using it to make decisions can be a challenge. Visually correlating the relationship between two maps, for example, yield vs. soils, is possible but becomes mind-numbing as you collect more data layers on dozens of fields.

Maps are a great way to visualize agronomic data, but the real power for decision making is in the data file. Organizing data layers into a georeferenced database structure allows us to tackle real-world complexity that is applied agronomy. Applied agronomy at the field level is the collision of hundreds of manageable variables – it isn’t rocket science; it is way more complex.

Premier Crop embraces this complexity with respect. We respect that all agronomy is local, and what drives yields and profitability changes year to year within areas of the country, across a grower’s operation, field by field, and in each part of a field.

After years of helping growers and advisors analyze data to drive decisions, we’re frequently asked, “What matters most agronomically?” Our answer is always the same: There is no silver bullet. It is never one specific variable that universally drives yield variation or profitability.

It’s not just plant health, variety selection, trait packages, weather impact, population, nitrogen timing, soil type, planting date, harvest date, tillage or fertility. We could go on and on.

Agronomic complexity drives many to look for simple solutions. While companies like ours continually drive to make it easier – some make “simple” solutions work only because they pretend complexity doesn’t exist.

New call-to-action

Analyzing your agronomic data is messy. Correlation doesn’t prove cause and effect. We gain confidence by seeing similar results on multiple fields across an entire operation and across thousands of anonymously and confidentially pooled acres in your area. Our experience has taught us that most growers want their agronomic advisor to help in this process. While it’s hard work, we don’t have to hit home runs to pay for the effort.

Agronomy is complex. There is no silver bullet that will drive yield and profitability. You must look at all variables across a wide range of acres when making important agronomic decisions.

Want to move beyond just looking at those pretty maps? Here are 3 questions to ask yourself to start putting your collected data to work.

  1. Dive into how you evaluate the relationship between soil test fertility/applied nutrients and yield. How do you manage your fertility program? Are there ways you could use other data – for example, yield – as part of your nutrient strategy?
  2. Do you check your previous years’ variable-rate population recommendations? How does your agronomic data explain whether the recommendations worked or not?
  3. Are you using the same seed variety as last year? Why or why not? Did you base that decision on data or a gut feeling? Think of what different variables you could look at within your data to be more informed, rather than emotional, when buying seed.

Visit our blog at www.premiercrop.com for more precision ag and data analytics resources.

Benchmark your Farm Data

Telling your customers they’re under-performing isn’t a great business model. Encouraging them to take part in agronomic benchmarking can sometimes have that same effect. Those at the top might enjoy the satisfaction of knowing they are the stars, but how do you gently push the below average customers to step up their game?

The problem with agronomic benchmarking is that the solutions to reaching better numbers aren’t always obvious.

When seed companies tell you the genetic potential of a bag of seed corn is 500 bushel per acre and it starts going downhill once you open the bag, it’s almost implied that they’ve done their part and you are the one who is failing to perform.

Comparing your yields to those in the counties you farm in might be okay unless you farm the poorest soils in each county. Then, you might resent someone who points out the obvious – that your yields are below the average. Comparing your yields to those of others that farm the same soils in your part of the state is better, but being labeled in the bottom quartile isn’t fair if you didn’t get similar rainfall.

Even if both soils and weather are similar, what about rotations? What about the cost of production? Maybe all those higher yields came at a high production cost?

So what are the keys to meaningful agronomic benchmarking? We’d suggest these as a few of the important keys:

  1. Realistically quantify the growing environment to get closer to apple to apples comparisons.
  2. Look longer-term – look for trends over multiple years. Everyone has a great or a bad year once in a while but looking at longer-term trends are more meaningful.
  3. The more depth of data, the more value in the benchmarking. Depth will provide you with more confidence in the comparison as well as more answers.

The best benchmarking services don’t just tell you where you rank – but they tell you why. What does the data say you need to change to perform better or to keep doing to stay on top?

The key is to never stop digging for the answer to “why?” It is easy in all data analysis to have “apples to oranges” comparisons and take data at surface value, but the key to good analysis is to keep digging deeper to get fair comparisons, thus creating the most educated and profitable agronomic decisions.

Visit our blog at www.premiercrop.com for more precision ag information.

New call-to-action

Are High Yields More Profitable?

Why do you put so much focus on driving higher yields per acre?

Is it a feeling of social responsibility to help feed the world? A sense of pride or feeling like you’ve won a contest? Are you wired to achieve – a constant quest to do better? Does it stem from your school days or parenting – always wanting to have a great report card?

For many growers we work with, we don’t believe any of those motivations are the driving force towards higher yields. Growers are generally pretty quiet about their high yields. For them, it comes down to a simple business reality – high yields drive profitability.

Business and economics professors have ingrained in us that some business costs are fixed and others are variable. Fixed costs are the same regardless of units produced. Sometimes, they are referred to as “sunk” costs because it’s what you sink into the business just to be in business. In crop production, we frequently consider our investment in land – either through ownership or rent – as our largest fixed cost.

Over the decades, we’ve replaced labor with larger equipment that has fueled dramatic productivity gains. But that increasing investment has increased the fixed cost of crop production in many operations. Farm economics professors will frequently list nutrients, seed, crop protection products, fuel and hired labor as variable costs. But for most operations, that’s not an accurate characterization. What percent of seed cost, herbicide cost or nitrogen cost is truly variable?

Everyone plants hybrid corn – so the real seed cost that is variable is the portion above the cost of a high-yield, non-traited hybrid. In corn production, most growers are going to apply a minimum of 100 lbs. of N per acre in some manner. The portion of your nitrogen investment that is truly variable might be the final 50 -75 lbs/ac. Choosing the cheapest herbicide program can be an example of “playing with fire” (boosting weed resistance for higher future costs). So is your herbicide program really a variable cost?

Lenders can be quick to encourage cost-cutting. But cutting nutrient, plant health and pest management investments can cut yields. In a high fixed-cost business, dividing those fixed costs over more units of production is usually the path to higher profits.

We frequently lead our customers to spend more input dollars only on the best field zones. That is possible when you can track and record those cost/investment differences like we do, then share a profitability analysis at the end of the growing season.

In corn and soybean production, you can spend your way poor but you can’t save your way into prosperity. Frequently, the only way to lower your cost per bushel and increase profits is to produce higher yields.

New call-to-action

Use Farm Analytics to make Improvements on your Operation

Every grower sets goals for their farming operation. Seeking high yields or decreasing costs of operation are commonly cited, but ultimately what every grower wants to know is whether or not each decision is profitable.

How do we go about doing this? Since no two fields are the same, there’s an increasing need for information generated down to the sub-field level. We can’t apply the same rule of thumb across an entire operation or we’d never gain any improvement. Some of our advisors refer to this as ‘farming by the foot’ to gain a deeper understanding of each field in order to have optimal success. By studying each foot individually, using farm analytics, we have the capability to drill down and identify each limiting factor(s) per field.

We often hear statements from grower such as:

“The home farm has been my best field for 30 years – my other fields don’t measure up.”

“I’m cutting back on input costs because it simply doesn’t pay.”

“Maybe I’ll try it – next year…”

To overcome them, we first need to break down ‘big data’ from a farm approach into a field, and even sub-field, approach – to define variability at the field level in order to make smarter, more profitable decisions. By digging into farm analytics, a grower’s ‘best’ field might turn out to be average from an economics standpoint. Comparatively, one of the lowest-yielding fields can turn into one of the best with the right management plan. Once growers start to see how much they benefit from the data they’re receiving, they start paying attention more closely.

By looking at each field individually, we develop a management plan catered solely to the field at hand. Low production areas such as sand pockets, nutrient-depleted ridges or ponding zones, are all taken into consideration with management zones. Seeding and fertilizer rates may be decreased in low production areas to save on costs while higher rates are allocated in high production zones. PCS Advisor Adam Walters commented, “It’s amazing to see growers save $12/Ac by zoning to reduce costs while at the same time boosting production.”

We often hear, “we have all this data, now what?” or “how do we get growers to implement changes?” Our goal is to get a grower to a deeper level of understanding with their data.” By interpreting the results at the field level, growers can make better decisions on field management to ideally accomplish improved profitability and efficiency.

As a farmer what are you doing to break down ‘big data’ to define variability at the field level in order to make smarter, more profitable decisions? It’s time to start using your data and farm analytics to help you profit.

New call-to-action

How to Collect Data for Farm Analytics

To efficiently collect data on your farming operation, it’s important to have a good plan and keep notes as you go, collect in a timely manner, and verify that data matches what happened throughout the season. There are many data points that need to be collected, verified, and entered to get a full-scope picture of your operation for analytics purposes.

Steps to Efficiently Collect Data for Farm Analytics:

  1. Take notes as you go
  2. Collect data files as soon as possible
  3. Communicate with your advisor to make sure they are aware of your expectations through the season
  4. Verify and validate your data at the end of the season

DSC_0373

First of all, it’s so important to find an advisor that you trust and for the two of you to be on the same page before the season even begins. If everything goes according to plan, then you both know where seed/chemical/fertilizer goes. However, we know that even those most well-laid plans don’t always happen as we anticipate. In that case, it’s very important to take diligent notes.

One of the best things you can do for yourself is to take notes as plans change while the change is fresh in your mind. It’s easy to remember something as it happens, but after a few weeks, you may not remember it exactly. One of the easiest things you can do for both you and your advisor is to print off the field information sheets that Premier Crop offers with each field. A simple notebook or text to your advisor also works if you don’t have these handy. Once you have these notes, you need to collect the corresponding data files as soon after you’ve finished as possible.

While you should collect data quickly after application occurs, it’s not possible to stop the planter after each field to send the new file to your advisor. However, if you use a cloud-based data management tool, such as John Deere Operations CenterClimate FieldView Plus, or Agfiniti, you can share your operation or username with your trusted advisor who can download files as you go. If those options are not in your arsenal, then exporting your files from the monitor and sending them to your advisor as soon as you are done with planting, spraying, or fertilizing is the next best alternative. If data is collected in a timely manner, it is much easier to verify that it is correct.

Verifying and validating data is a critical step for data analysis. Good data in = good analysis out. Validating is easiest to do when things are fresh in your mind. As long as you have created a game plan with your advisor, kept notes, and collected data in a timely manner, the validation part should be an easy and painless process. Our Premier Crop Advisors are here to help you through any of this process. If you don’t have a Premier Crop Advisor, reach out to us to see how we can get you on the path of doing more with your data.

New call-to-action

Response to Fungicide: It Varies

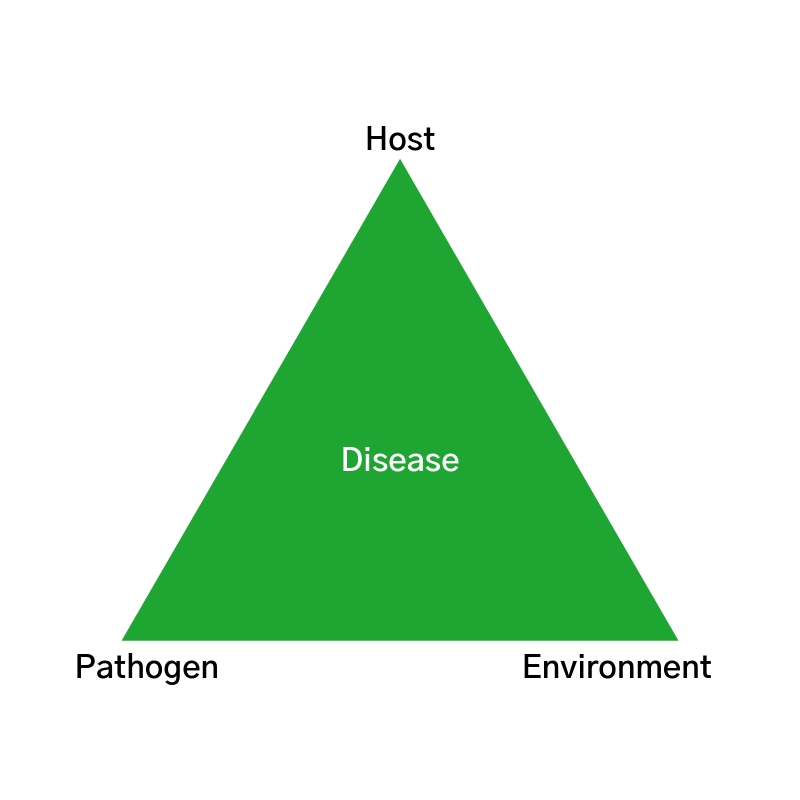
You don’t have to look very hard to find chemical manufacturers’ advertisements claiming a significant positive yield response (15, 20, 25+ bu./ac) to using one of their fungicide products. There are many effective products on the market that provide good control and protection against fungal pathogens, but advertisement claims based on ‘average trial data’ aren’t guarantees for your fields. Three critical components (a host, favorable environment, and pathogen) must come together at the same time for a plant disease to thrive. These three components are commonly referred to as the Plant Disease Triangle. Management or alteration of just one of these components prevents or reduces disease severity.


diseaseHost

It’s important to refer back to the Plant Disease Triangle when gauging the need for fungicide application, as well as past local trial results and current crop economic conditions. How do environmental conditions within the field (soil pH, fertility levels, applied nutrients, etc.) affect the vulnerability of the host (corn or soybean plant) as it relates to disease pressures? Is a pH imbalance affecting nutrient uptake, which in turn makes this specific hybrid more susceptible to fungal disease pressure? Does it make sense, economically, to apply fungicide to lower productivity areas within fields? Variability exists in all fields and managing the yield-limiting factors is what will show a yield response come harvest. Agronomy is complex and agronomy is local. Yield response to fungicide fluctuates within each field based on the interactions of many variables, which are all part of the disease triangle. Conducting on-farm fungicide trials generates more agronomic knowledge related to this complex interaction, which improves decision making for future applications.

Being able to use my family’s farm as a ‘testing ground’ makes working with the solutions Premier Crop provides to our partners even more enjoyable. I am able to experience first-hand what many of our partners and advisors put into practice each and every day. Last year I placed a few fungicide Enhanced Learning Blocks (ELBs) in one of our fields to test the effectiveness of a popular fungicide product. An Enhanced Learning Block is a randomized, replicated trial of different rates, products or application timings. ELBs provide a formal testing environment within a field to determine whether or not the treatment had a statistically significant impact on yield.

Trials were setup to be an on/off scenario – 20 gal/ac and 0 gal/ac each replicated 6 times within the trial area (ELB). Two of the ELBs were placed within the same hybrid – one on heavier soil and the other about 800 feet away in lighter soil on a hill. The product was applied at R1 with a Hagie sprayer. Prior to application we had been receiving ample rainfall, so we anticipated potentially higher fungal disease pressure, however that was not the case.

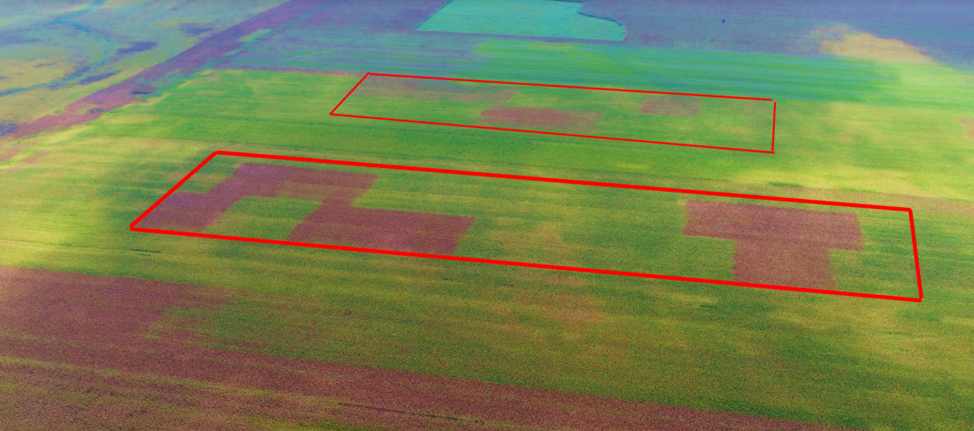
The image below was taken with a drone about one month after application. You can easily see the replicates in the trial area that did not receive any product. Based on the image what do you estimate the yield difference to be between the treated and non-treated rates? What would an imagery solution come up with for a yield difference based off their algorithm calculating yield from NDVI?

fungicide_ELB

As we were harvesting this field we could see the location of the fungicide trials as we worked towards them. While combining in the trials the difference in plant structure was obvious – the tops of the corn plants in the untreated replicates had all broken off. Both the drone image and visual observations at harvest pointed to a significant yield response to fungicide in both trials.

When I received the Enhanced Learning Block trial report I was a bit surprised with the actual results – visual observations are deceiving! One trial had a 1 bu/a yield response and the other was 8 bu/a. I was expecting at least a 15 bushel difference.

#1 – lower ground, heavier soil.

#2 – higher ground, lighter soil.

Why did the trial results end up this way? I have some ideas, but no definite answers. Likely the yield response shown in the trial on lighter soil was due to the treated plants’ improved ability to withstand late-season moisture stress, which wasn’t a yield-limiting factor in the heavier soil environment. What I do know is that a 1 bu/a response didn’t come close to paying for the product and application costs, and an 8 bu/a response was likely a little better than break-even. Understanding when, where, and to what degree these products work will allow for better utilization (spatial application), ultimately increasing ROI.

Are we going to spatially apply our fungicide next year? Probably not. Are we going to continue to conduct on-farm trials and Enhanced Learning Blocks to learn more about when, where, and how well fungicides work? Definitely. With the power of local agronomic knowledge, I don’t think it will be too long before spatial application of fungicide becomes a normal practice in crop production.