Cost Per Bushel

Premier Crop has been challenged by growers and industry skeptics. The recent euphoria over the value of grower’s data has been a welcome change in that more growers are starting to value their data and wonder how to best put it to use. But having spent so much time with growers, I know that in the end the ultimate credibility test for every data offering will be “does it pay?”

And that’s where we started as a company. Our goal wasn’t just to use growers’ data to help them drive yield, but must more importantly to drive profitability!

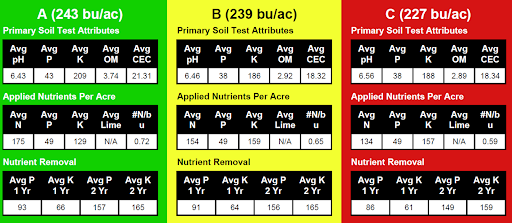
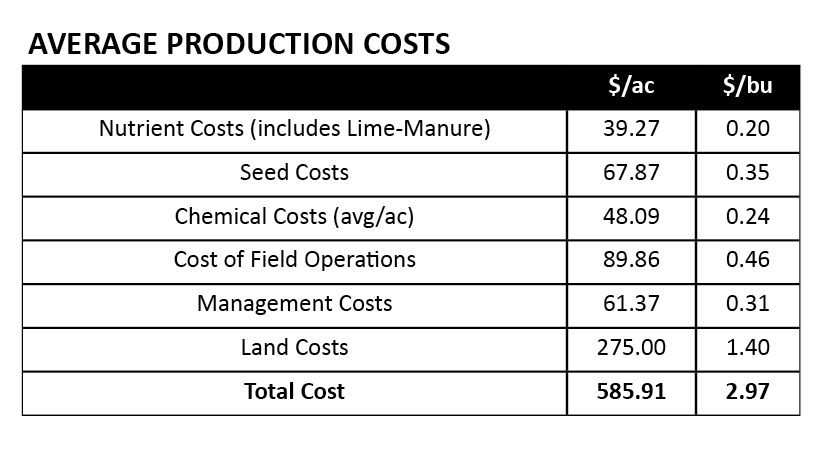
Our answer was to create a robust database that could not only track agronomic layers and input treatments but also the costs associated with each treatment plus land, management and cost of field operations.

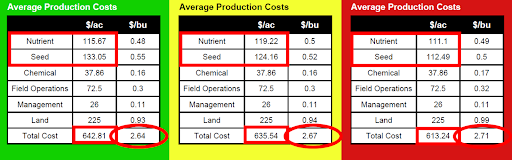
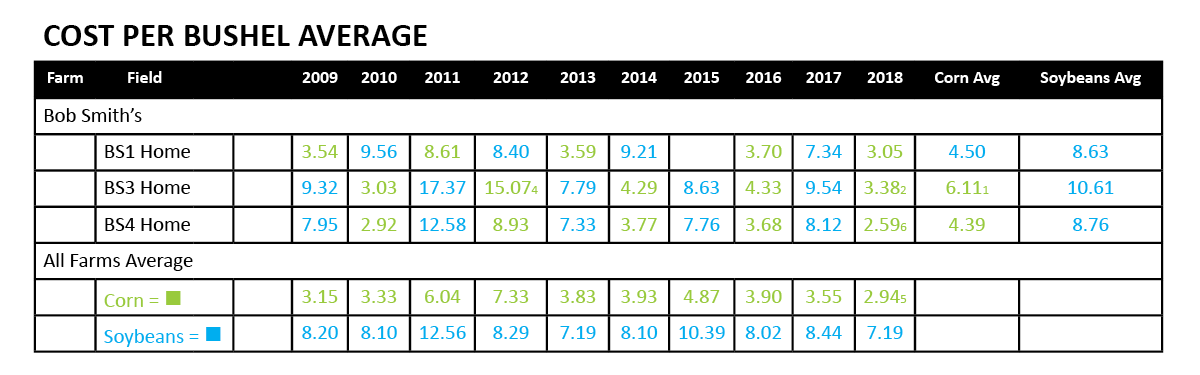
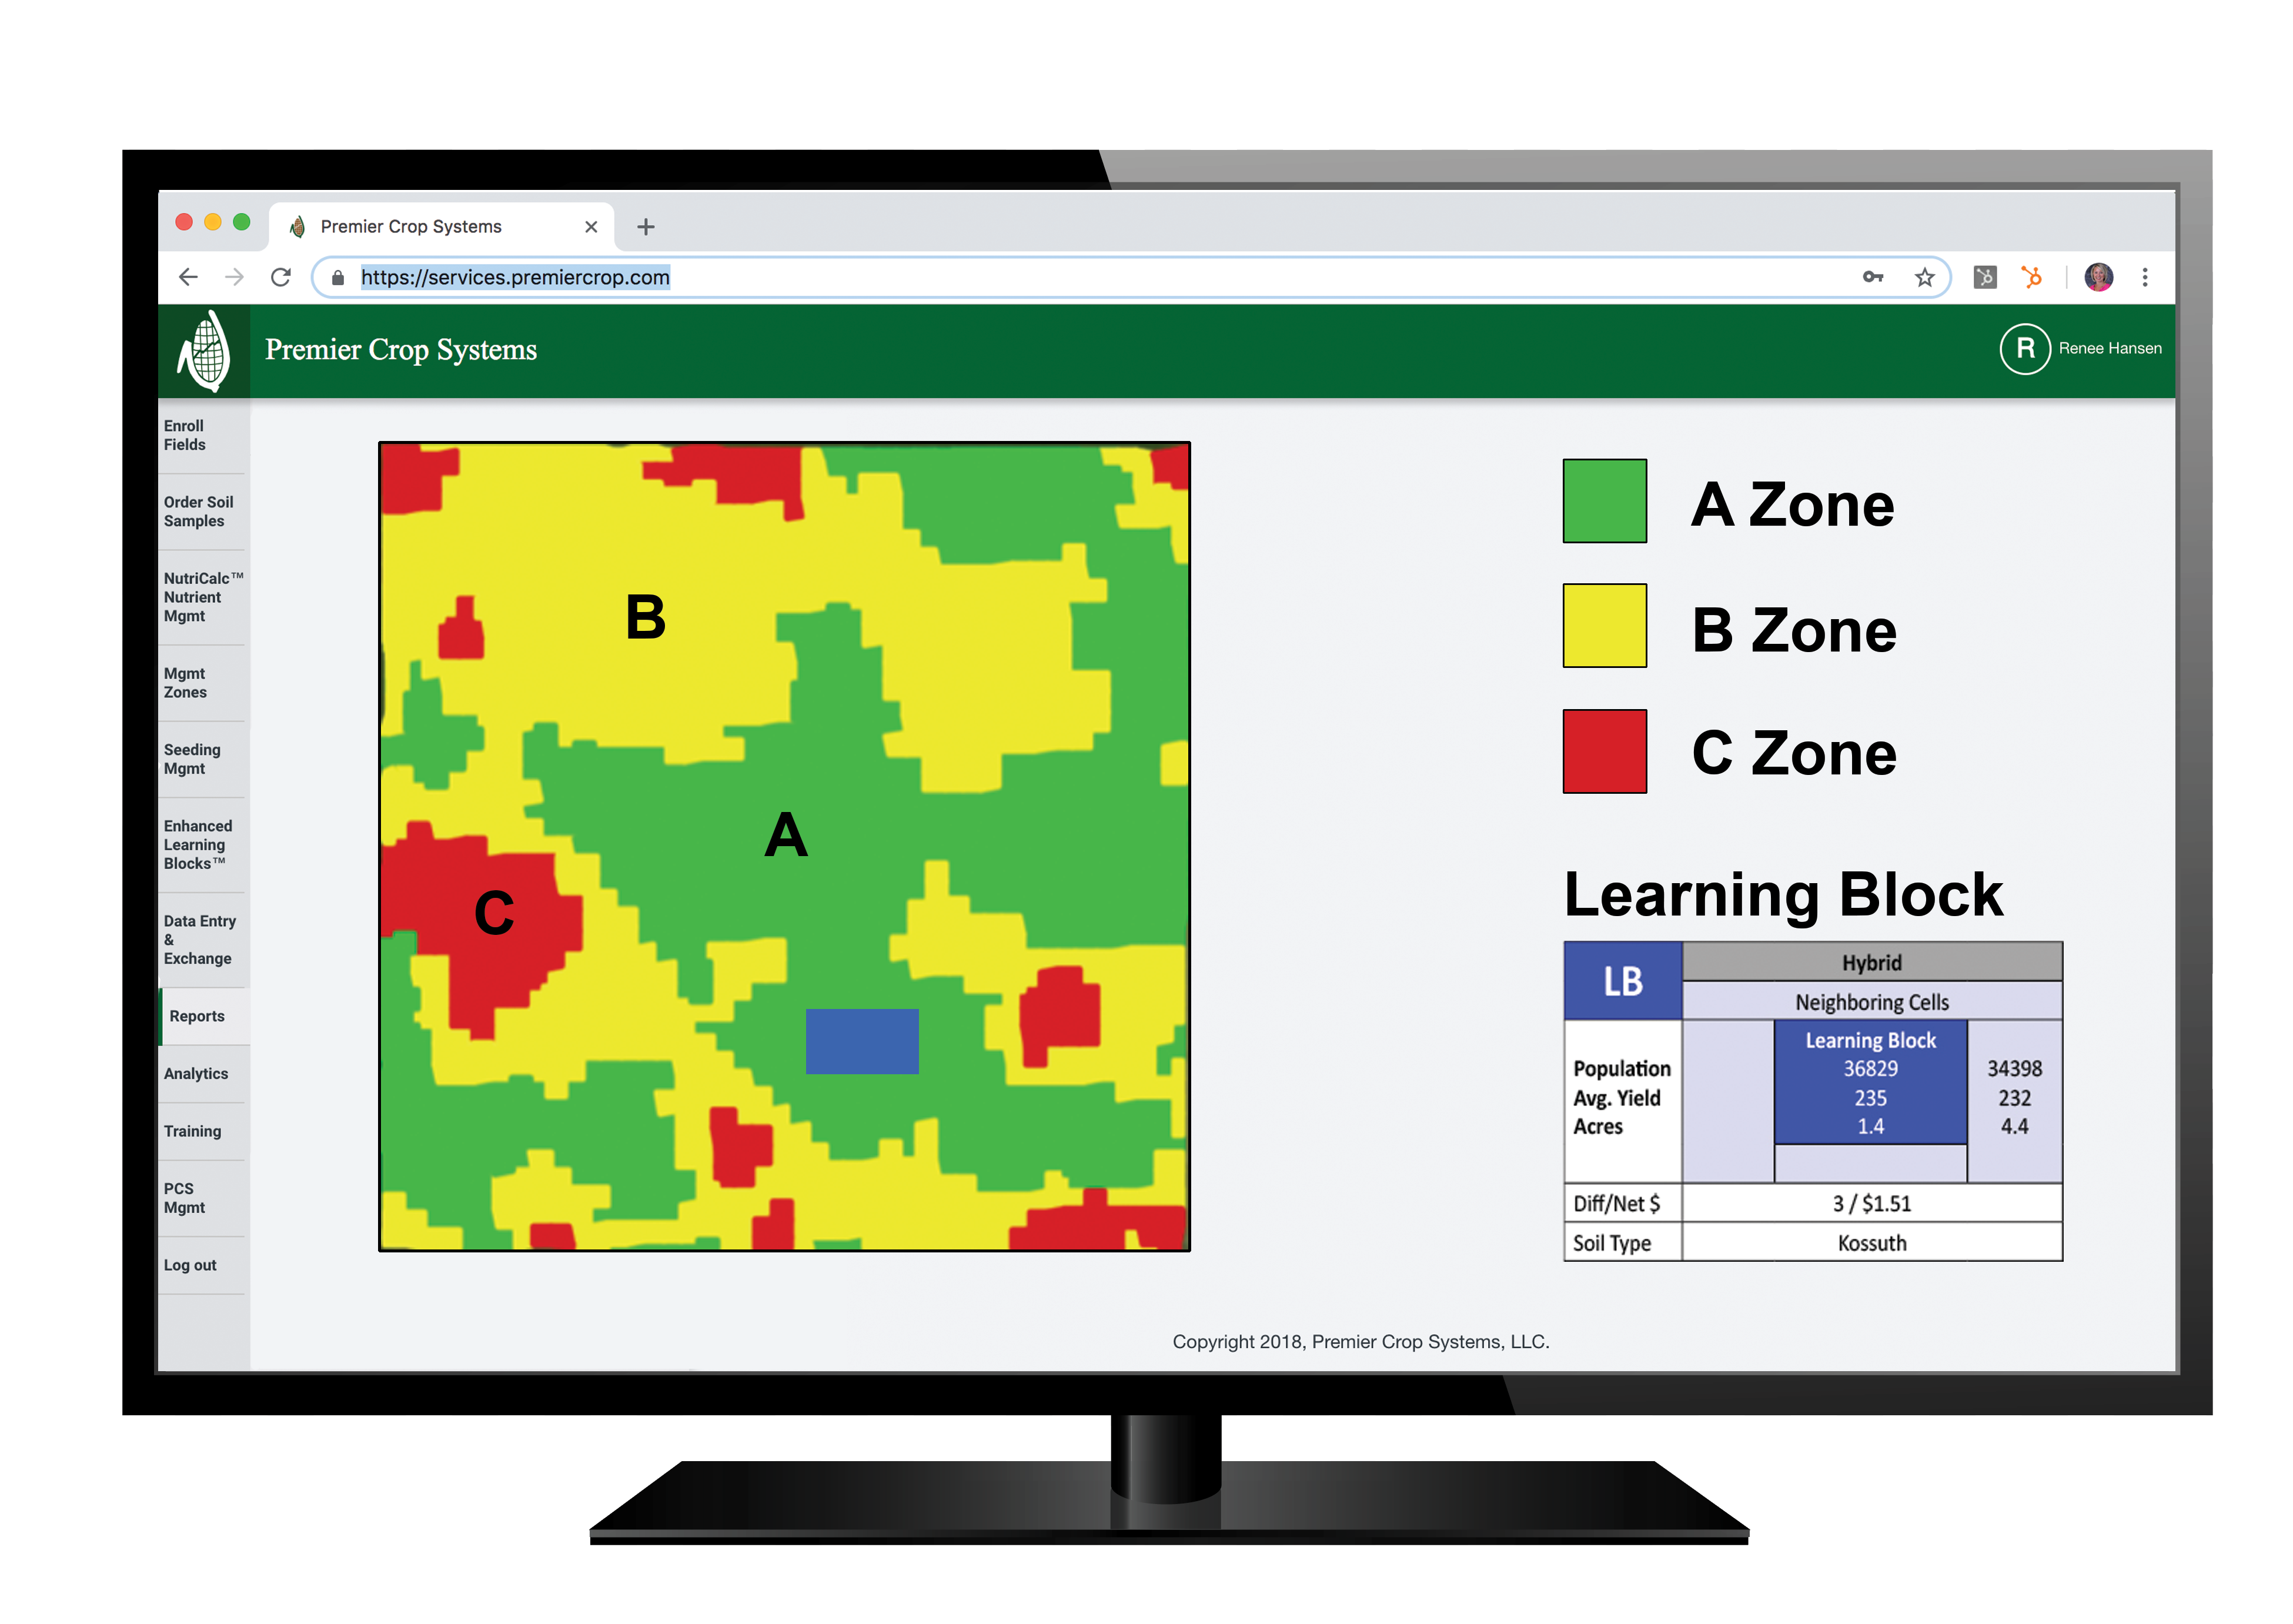
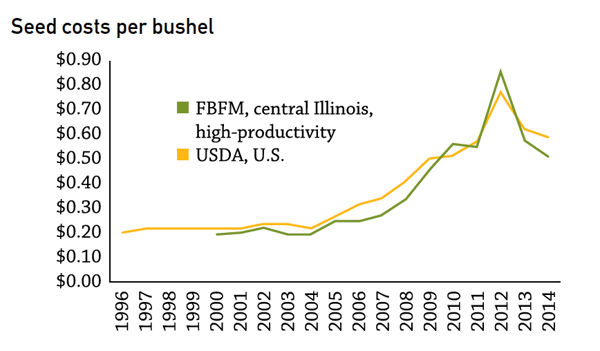
When we started in 1999, there were many years when the grain market provided very few significant swings. The challenge of developing a solid grain marketing plan started with knowing your cost per bushel. We took that challenge to the extreme – providing grower with a cost per bushel map that included tracking costs down to 1/10th of acre increments.

Screen Shot 2018-08-17 at 2.00.03 PM

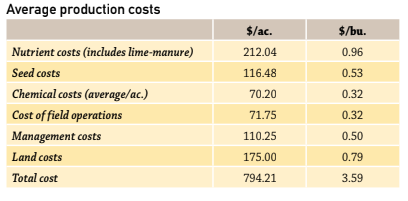
A simplistic approach would have been to take whole field average costs and divide them by the yield field.

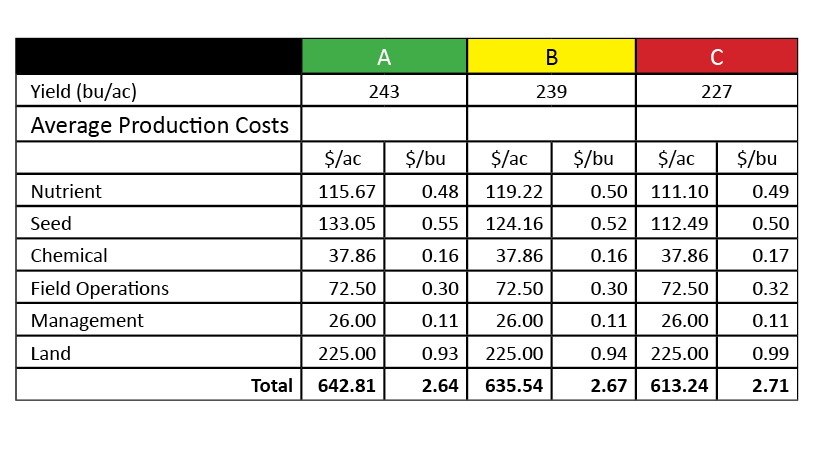
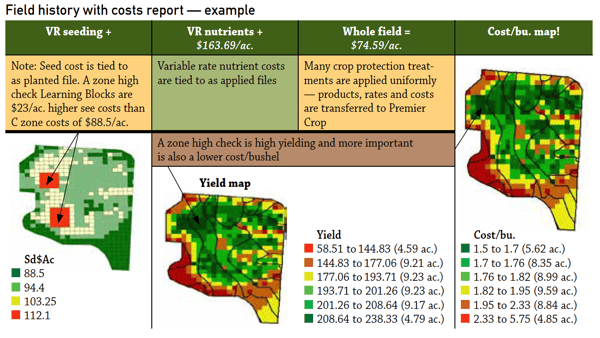
Our approach is much more accurate. If a variable rate nutrient application called for more nutrients to be applied in an area of the field, the cost of those nutrients was processed with the nutrient application field. If seeding populations were higher in a management zone, the associated cost of extra seed was tied to the planting file when it was processed.

Screen Shot 2018-08-17 at 2.00.08 PM

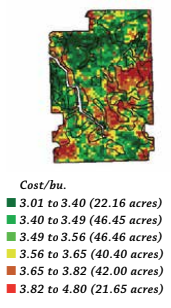
This practice is a lot of work but the results provide analysis that can make critical decision making easier. Over the years, growers have used cost per bushel maps in many different ways. To have meaningful conversations with landlords. To change crop rotations on fields that show a profit advantage on one crop and not another. In some cases to decide if there are areas of a field that should not be cropped and might fit better with a conservation use. One farming operation used their cost per bushel data to grow in another direction where the combination of land rents and yields were more profitable.

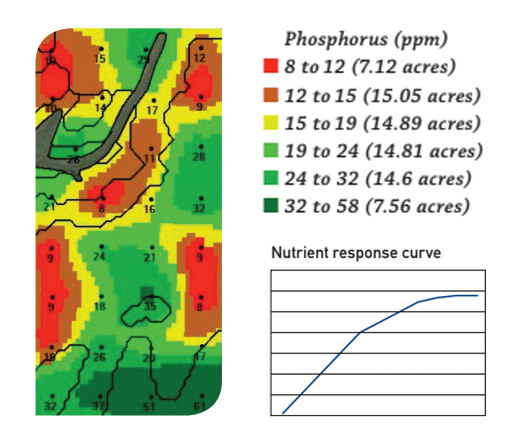
Accurate cost per bushel information is highly confidential and can provide the ultimate benchmarking solution as it goes much deeper than just yield but compares the economics associated with those yields as well. Imagine the power of knowing your long-term average cost per bushel by dominant soil types. Maybe you’ve mastered being profitable on lighter soil types and that is one of your strategic advantages.

The knowledge you create from your data can be powerful in managing your farm and the risky involved in farming today.

Got Data?

  1. What strengths does your data show? Where does it suggest there is room for improvement?
  2. How might you use your data to manage risks in this growing season and beyond?

Remove the Guessing and Make Data Driven Decisions

As farmers face another year with challenging markets and high inputs, we as agronomic advisors continue to work with our clients in order to find where we can remove some of the guessing when it comes to the decision-making process of planning another season. It comes as no surprise to anyone that is involved in Agriculture that many areas saw higher than normal precipitation in 2018.

The map below shows the state of Iowa and the departure from normal in inches of rainfall in 2018.

2018 high percipitation

(source: https://water.weather.gov/precip/  parameters from last year versus normal rainfall.)

Unfortunately, this did lead to some areas of drown outs and low yielding areas in fields. Thus, there were many areas that had little if any removals of nutrients but many growers will treat those areas the same as areas that yielded well in the field. This is just one of many examples where VRT and precision agriculture can save the grower on inputs across their farms. It is important to look not just at soil sampling and soil types but also historical yield when deciding on proper recommendations for the field. At Premier Crop, it is important to us to treat every field individually and not look at those fields in a cookie cutter style approach. Premier Crop has an extensive database with over 20 years’ worth of observations.

It is important to look at the return on investment for not just for every field or every acre, but what it is actually taking to produce every bushel. We are able to take all of the costs that are provided and quantify the grower’s yields with those costs. Does it make sense to continue to treat historically poor yielding ground the same as historically high yielding ground? Would your inputs be better spent if focused slightly more on ground that has more yield potential? It is important to us that we treat every acre in an unbiased way, as if we are farming it ourselves, and the data allows us to do that.

The example below shows a field that has been put into three different zones of productivity based upon fertility and historical yield.

premiercropmanagementzones_productivity_blog_lk

We then break that out further and show how each zone did on a per bushel basis with all the costs entered. As you can see we dropped our rates in the least productive zone because it didn’t show the same ability to produce as the other two management zones.

premiercrop_costperbushel_blog_lk

This is a great example how Premier Crop uses data to prove profitability. It’s time to stop guessing and use your data to make profitable decisions.

THREE Ways to Determine Field Profitability Using Your Technology {Pt. 1}

This is a three part series focusing on ways to determine your field profitability using your technology. We will post the series over the course of two months. If you don’t want to wait, you can get the full series here.

__________________________________

In tough economic times, it is more imperative than ever to know your productivity and be able to evaluate the cost or benefit of your decisions. Our mission at Premier Crop is to make this easy for you and give you multiple ways to evaluate across your operation. I will walk you through the different methods of evaluation: cost/bu, variance reports, and learning blocks, along with why each is important.

The first measurement is the cost per bushel on a spatial level to give you a new look at each individual area of your field.

COST PER BUSHEL

Q: What is the end goal of your operation? To raise more bushels to sell at a profit.

Q: How can you do this if you are basing everything off of cost/ac? Cost/bu should be your end goal. How much did your fertilizer cost you per bushel? How much did your land cost you per bushel? This diagram shows a realistic view of your operation.


determine your cost per bushel

We look deeper than your Average Production Costs to find the impact on your cost per bushel by field. And we go even deeper than only looking at your field, we break down each field into management zones and determine the cost/bu in each unique zone. (see diagram below)

Manage your cost per acre in management zones to determine field profitability


Not every area of your field performs the same and using cost/ac as your main metric of measurement can have detrimental effects on your overall productivity. Let me explain.

Your A zone is the most productive area of your field, it consistently performs well. Your C zone, by contrast, is the area of your field that constantly disappoints you. It never seems to do well and brings your overall field average down. Why would you treat them the same? You may be able to cut your cost/ac in the C zone by giving it less fertilizer and seed, allowing crops more room to spread out and grow, but if you do that in your A zone, you would see a decrease in productivity. Your A zone wants to be pushed, it needs more nutrients and can handle more seed population than the C zone.

This is a detailed look of each field, but sometimes you may want a more broad view of your overall operation to make management decisions. This is when step number two is valuable, by viewing your Field Productivity Report Card.

Stay tuned for our next post featuring the Field Productivity Report Card.

THREE Ways to Determine Field Profitability Using Your Technology {Pt. 2}

This is a three part series focusing on ways to determine your field profitability using your technology. We will post the series over the course of two months. If you don’t want to wait, you can get the full series here.

__________________________________

In tough economic times, it is more imperative than ever to know your productivity and be able to evaluate the cost or benefit of your decisions. Our mission at Premier Crop is to make this easy for you and give you multiple ways to evaluate across your operation. I will walk you through the different methods of evaluation: cost/bu, variance reports, and learning blocks, along with why each is important.

The first measurement is the cost per bushel on a spatial level to give you a new look at each individual area of your field.

FIELD PRODUCTIVITY REPORT CARD

After determining your cost per bushel, it is valuable to look at all your fields and rank them, like a report card. This process allows you to view which field deserves the gold star and which field needs more attention. This is a process that is automatically generated for you when you are enrolled in our program.

One part of the report shows a cost/bu field average over all of the crop acres for a given year and over multiple years. It allows you to look at trends in regards to cost/bu over time. This report will show you if one field is consistently producing a lot more or less yield or costing a lot more per bushel.

In the report below we can see that Bob Smith’s BS3 Home field corn averages $6.11/bu(1) across all the years of data, which is higher than his other fields in comparison. In 2018 it cost him $3.38(2) to grow a bushel. This report will show where the cost/bu had a significantly higher average (2012 $15.07/bu(4) corn) but since 2014 this farmer has been doing a good job of maintaining his cost/bu average on the BS3 field. However, we can see that across all acres of our fields the average cost of corn in 2018 was $2.94/ac(5). Therefore this field raises a flag for us to look deeper into the field data.

In contrast, the BS4 Home field averaged $2.59/bu(6) in 2018 which is below our average corn costs of $2.94/bu(5). This field has a consistently lower cost/bu year over year than other fields.

premiercrop_costperbushelaverage

What does this mean? The purpose of the report is to get us to ask ‘why?’

BS3 could be averaging a higher cost/bu because our management zones are not correct, we may be trying to push the field too hard, our plant population is off, or the nutrient prescription is flat-rated. Or we may be paying higher rent on that field and need to consider if it is economically responsible to keep renting at the current rate.

Again, this report is a big-picture overview across a whole operation, it’s main strength is to get us to ask why. Why is BS4 performing so much better than BS3? What can we change to get our cost/bu more in line across all of our fields? Lower seed costs? Split apply nitrogen? Apply fungicide?

Premier Crop can help answer these questions, our trained agronomic advisors can identify yield-limiting factors by doing an in-depth analysis of your individual field. We are able to recommend a management change that will affect your bottom line across a whole field. That is our ultimate goal, to make you profitable.

Is there a way be profitable without implementing wide-scale changes across your whole operation? The answer is yes, with step three, Learning Blocks…stay tuned!

Making The Data Deliver

farmtofork-logo-reduced

Dan Frieberg, President of Premier Crop Systems, talks about data and breakeven cost per bushel on the Farm to Fork Podcast.

Listen Now

Host: A yield map will tell farmers what part of the field is performing well and what part is performing not so well. The temptation is to want to find out what is going on in the problem areas and fix them. But Dan Frieberg with Premier Crop Systems says that may not be the best decision economically.

Dan: We like to talk to growers about managing variability that exists within the field. We talk a lot about pushing the best part of the field a little harder and then maybe being a little more conservative with some of the lower production areas. Managing the growers input investment to get the higher return.

Host: Frieberg says growers can throw a lot of money and effort at low yielding areas of a field that may never provide the kind of return on investment they hope for.

Dan: Every decision that’s made has an economic consequence and we believe that high yields are important, but maybe more important is being able to deliver accurate breakeven cost per bushel. That’s where we take it, at the end of the day, that’s what growers are looking for. They want to know what the economic reason to do things differently.

THREE Ways to Determine Field Profitability Using Your Technology {Pt. 3}

This is a three part series focusing on ways to determine your field profitability using your technology. We will post the series over the course of two months. If you don’t want to wait, you can get the full series here.

__________________________________

In tough economic times, it is more imperative than ever to know your productivity and be able to evaluate the cost or benefit of your decisions. Our mission at Premier Crop is to make this easy for you and give you multiple ways to evaluate across your operation. I will walk you through the different methods of evaluation: cost/bu, variance reports, and learning blocks, along with why each is important.

The first measurement is the cost per bushel on a spatial level to give you a new look at each individual area of your field.

LEARNING BLOCKS

What is a Learning Block? Premier Crop has created a low-risk way to test and check variable rate seed populations, crop protection products and nutrient rates in one-to-three test acres, called Learning Blocks™. You have the ability to check if the optimal rate for that environment is higher or lower, in a low-risk way, built right into your prescription, using your technology.

After you have established management zones for your field, Learning Blocks prove whether a practice such as plant population or different nitrogen rates, are effective in that zone. Since Learning Blocks are one-to-three acre cells it’s a low risk way to prove and maximize efficiency.

premiercrop_learningblock_blog_THREEways

In the diagram above, this Learning Block was performed to test plant population. Did it pay? Yes and no. The Hybrid A did not have enough yield increase to offset increased seed costs. Hybrid B did have a yield increase to produce a positive ROI.

A great benefit to Learning Blocks is that you can place multiple Blocks in one field to test different management zones, soils, nutrients and more. This can ultimately help you make confident data decisions that will help you profit, all while using the technology you already have.

premiercroplearningblock

Get started, contact us to calculate your profitability and schedule a demo today.

How to Lower Your Breakeven Cost Per Bushel


Dan Frieberg talks with Delaney Howell and Mike Pearson with Global Ag Network sharing his insights on how to lower a grower’s breakeven cost per bushel. Dan talks about the strategy you need to sell bushels and not acres and how Premier Crop is different by offering a more refined and detailed management system. He compares what Premier Crop does to the Dairy Herd Improvement Association (DHIA), when the dairy industry started tracking production by the individual cow, and how Premier Crop is viewing data not only at the field level, but within parts of each field.

Therefore, as a farmer using Premier Crop, you are able to track your data by small increments of each field to increase profitability.

Time to Scrutinize ROI

Increasing return on investment for every input is clearly on the mind of every grower. They are in an economic squeeze, but that doesn’t mean they won’t invest more in crops. It does mean they are scrutinizing every dollar they spend. The current success measure now goes beyond yield increase to include which inputs offer better return on investment.

During Premier Crop’s 20 years in business, one of the most dramatic changes has been the evolution of the biotech seed industry. University of Illinois research shows per-acre seed investments have increased 4 to 5-fold in that time. While yields have increased, seed cost per bushel produced has also increased 4-5 times. Part of the increased cost/bushel has been offset by reduced herbicide and insecticide/acre investments.

hybrid selection cost per bushel

But this is not your father’s seed investment! The times and economics associated with managing your seed investment have changed and deserve more attention.

The return on investment for managing your seed investment within fields through variable rate seeding has never been higher. How do you know your ROI on variable rate seeding? For Premier Crop, the answer has always been tying input cost to the as-planted or as-applied fields, adding all input, land, management costs to generate a cost per bushel map for each field.

Why cost/bushel versus a profit map? Our experience is that the first step in a solid grain marketing plan is knowing your cost per bushel of production. Grain marketing in most operations can be a 12-month process and we want to be able to deliver results and analysis as soon as the yield file is processed.

Consider this field’s story:

precision agriculture field history with cost report

Don’t Farm Averages

Sometimes “averages” can be your worst enemy.

Everyone has heard far-fetched examples that illustrate the problem with “average.” Picture standing with one foot in ice-cold water and the other foot in steaming-hot water – the average of the two is OK. Sometimes that’s what using averages can do in your farming operation.

An example would be using average as you consider your fall nutrient budget. Tighter, even negative, margins will cause many to scrutinize input spending this crop year with much more intensity. Unfortunately, too many suppliers will simply calculate the most nutrients that can be applied for your per-acre budget and apply those rates on every crop acre. For all the headlines about precision agriculture, the majority of nutrient applications are still the same blend applied across every acre.

Agronomically, a better answer is to focus your input dollars in the site-specific areas of individual fields that will provide you with the most economic return on your nutrient investment.

At some point in our farming history, all of us have seen a nutrient response curve. Applied nutrient response curves tend to have these similar characteristics – steeper at lower levels and flatter at higher levels. For example, most of understand that generally we get more yield response for the first 50 pounds of nitrogen applied than the last 50 pounds. Finding maximum economic return is the basis for nutrient response curves.

dontfarmaveragesphosphorus

Think about response curves as you review the soil test phosphorus map above (expressed in parts per million – double the numbers if you are used to pounds per acre). If you composite-sample this field, the average is 20 ppm of P – running parallel with many university threshold levels where a response to applied P can be expected.

Using university recommendations as a reference, virtually any type of georeferenced soil sampling will reveal that in this field, spreading the same rate of P on every acre will result in no yield response is 50% of the acres (the green part of the map). As bad as that might seem, there is a decision even more economically harmful. Making a decision to not apply any phosphorus because the field’s average soil test level is 20 ppm would likely result in lost yield in 50% of the field (red, orange and yellow areas).

None of us can control or even predict all the curves of Mother Nature can throw our way. But using data from your fields opens the door for you to manage the crop production variables that are manageable. The fall’s tight economics area great time to put all your data to work – to stay away from averages. If you don’t have school data, now is the time to get started. The cost of a good grid soil sample spread over the normal four-year life equals less than one-third of 1% of your production cost.

Collecting and using your data can move you away from defaulting to using averages and getting average results.