Leveraging Big Data

In our latest Premier Podcast:
“The more data you get,
the more it lets you break it apart
into more meaningful insights.”
– Dan Frieberg

Big Data in agriculture

DARREN FEHR: In today’s session, we’re going to talk about big data. I should start off with the definition of big data, so our listeners can get connected to what we’re talking about. It’s a phrase that has integrated this world of technology across industries. It’s about capturing relevant data from a huge number of sources, collecting it today and translating it into something that people can use, into actionable insights to solve problems at scale and at speed. In this world of ag, we have billions of dollars of venture capital funding pouring into agriculture through technology builds, and big data has been at the center of a lot of that. How do you see this being advantageous for agriculture?

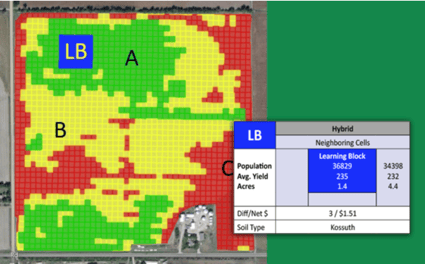
DAN FRIEBERG: Darren, I think it depends on the lens that you’re looking through. If you’re a manufacturer, there’s probably a different set of values from big data than if you’re a grower. So, it probably depends on your goal. What do you want to accomplish with the data? Obviously, big data is enabled by computing power. We just have a lot more capacity because of server farms and cloud computing. We just have way more capacity, which lets us collect more and then lets us crunch through more data. In ag, it’s relatively recent. It’s not lost on me that, before yield monitors, we really made a lot of decisions in ag based on what I would call small data, which was a lot of replicated trials. And we’re talking tiny, where a replication in a trial might be 25-feet-long, replicated three times. That becomes an observation. So now, with yield monitors and all the other devices, we’re able to collect data at such high resolution. In a hundred-acre field, we would divide that field into 4,000 unique observations that are geo-referenced, tied with a lat, long, yield value and hundreds of layers of data underneath that.

DARREN FEHR: I want to get back to our big data collecting capabilities. There’s a ton of data being collected in ag today, from a lot of different sources, and a whole bunch of it is public. It seems like there’s a lot of these newer companies coming out, trying to take advantage of public data and the complexity of sourcing it and putting it together into some usable format. What are the benefits for the farmer, in terms of seeing all of the publicly available data and, specifically, for their farm and how it helps them make decisions?

DAN FRIEBERG: With a lot of the public data, for us, it’s really course. We would call it really course, meaning it’s not drilled down to a level where I think it’s all that helpful. But if you’re a company, and you’re selling an analytics package to a grain trading company, the truth is you don’t need it refined. That coarseness is fine because you’re trying to understand global yield trends and how it will move the supply chain. So, to me, a lot of the public sources aren’t as valuable to a grower as they are to other stakeholders.

DARREN FEHR: Let’s talk about some of the myths out there on big data, and this is one thing we hear a lot. We hear the words “weather modeling,” but what we’re talking about is predicting the future. It might be future weather or future performance. Tell me about big data in predicting the future. My understanding is it’s always been based on historical data, and if the historical data isn’t validated and verified at a high enough resolution, how do we use all of this to predict or model future production trends?

DAN FRIEBERG: All models are based on assumptions. They’re based on data, but there’s some assumption built into them. It’s about understanding specific geographies within fields, how they’re similar to other similar geographies in other fields. It’s almost like the more data you get, the more it lets you break it apart into more meaningful insights. The power of what we have in ag is that you have different growing environments every year. As we grow as a company, we have different growing environments within the same year. So, Nebraska or Minnesota can have a dramatically different growing environment than Indiana and Ohio. For example, you could see how a hybrid or variety performs in the same year in dramatically different growing environments, just because you’re seeing it across these big geographies.

DARREN FEHR: But that’s highly dependent on believing in this idea that agronomy is local, that agronomy and geography have a really close relationship with each other. There’s this whole idea of big data and aggregating it across multiple different agronomic environments. How do we give it enough credibility that people can make decisions from it?

DAN FRIEBERG: Over the years, as we’re building as a company, the ability to aggregate data geographically is a big deal. The ultimate power of all this is subfield because that’s where you drive change. If you’re actually going to change and make improvements, it’s going to be subfield. Everybody wants to see beyond their own operation. They want to see agronomic practices or agronomic trends or rates. They want to see that beyond their own operation. As we’ve grown as a company, initially, when somebody comes in, they want to see the biggest data set possible, which means bigger geography. The bigger you get and the more data you get, then, all of a sudden, they’re like, “I really don’t care about seeing the big data. I want to see the local data.” Local is king in ag. The bigger, richer data set you can get locally, the more powerful it is because there are more things that are relevant and stay the same. We almost went through a decade where it seemed like the whole seed industry on corn was going to a lot of fixed-year numbers. The only way you could drive yield was to drive population. In the data, no matter what size of database, there was this trend. We were marching up 400 or 500 seeds per acre for a decade because that’s what it took in order to drive yields. Now, we’ve gone through almost a decade where it seems like there’s a lot of flex in numbers, so we’re producing much higher yields at lower populations. But, when we were going through that match up in population, all of a sudden people started looking at row width. We had this phenomenon where everybody was chasing 20-inch corn and even narrower corn. 39,000 in a 30-inch row is too close. The plants are on top of each other, and need to space them out more. In the data, 20-inch corn was a South Dakota and southern Minnesota phenomenon. That’s where we were seeing the most 20-inch corn. We had people outside of that area that wanted to drill down. They wanted to see data outside of their area because they were trying to make a decision about switching to a narrower row of corn, as a way to space out the plants as they continue to drive the population.

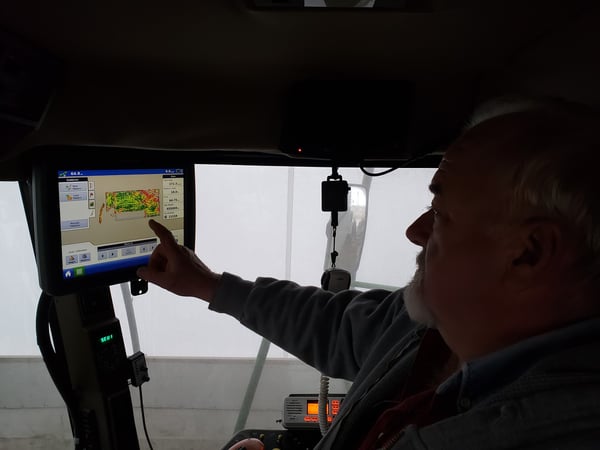
DARREN FEHR: With this idea of resolution, first of all, it’s data resolution. I want to make sure that we’re clear. You mentioned the word subfield, and to all our listeners, when I say high resolution, I’m meaning subfield. This goes beyond the field boundary, and we’re looking at different parts of different areas inside of every field. So, high-resolution data means subfield. I look at it like digital photography. We walk around with our cell phones, and they’re not phones anymore. They’re cameras, obviously. They’re used for filming and capturing videos. I always marvel at the fact that, when you capture a digital photo today, at a very high resolution, you can blow it up and make it as big as you want, and it’s still clear. I think about big data that way. If we capture and collect it at this subfield or high-resolution level, we can blow it up, and we can use it so that the insights are still clear.

DAN FRIEBERG: No matter how much you blow it up. Versus the other way. If you don’t capture that kind of detail, then, as you blow it up, it distorts.

DARREN FEHR: Myths about big data: if you haven’t got involved in big data now, you’re probably too late.

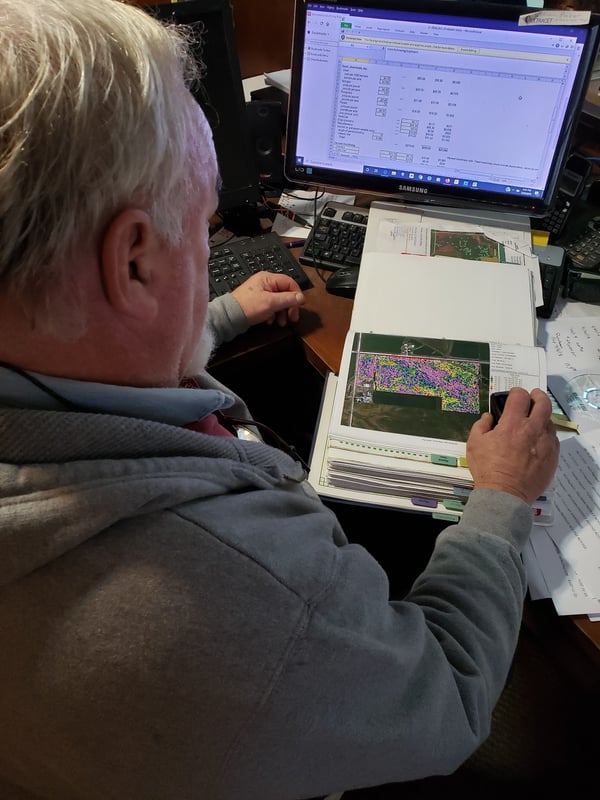
DAN FRIEBERG: No, not at all. A lot of growers are sitting on data, and nobody’s helped them use it. Yield data is, by far, the most. There are growers who quit caring about yield data because they haven’t used it. One of our successes is that, as we get engaged, we grab that historic yield data and try to use it to capture the variability that exists within fields. With a lot of growers, their data is in different buckets, and it’s not put together in a way that they really can capture it. A 3,000-acre grower in our system would create 120,000 observations. We would see yield by all these hundreds of layers of data, 120,000 times, just on a 3,000-acre operation. You can go from zero to big data really quick in farming. Anytime you get started is great, and you can start creating value right away.

DARREN FEHR: Another Big Data Myth: Data is messy, it’s complex, it can be confusing and it can be deceiving. Let’s talk about this idea where I see relationships between the data, which you have always talked to us about in terms of correlations, but not always do those relationships cause an effect. Talk about causation and correlation. As we think about this COVID-19 business, there’s an incredible amount of data being used to inform the public about what’s going on. Do we have the right metrics? Do we have the right data that is coming out, and do people understand the context of the data? What is safe and what’s not? Talk about your view on correlations here and how deceiving it can be.

DAN FRIEBERG: Well, just before we talk about COVID real quick, because we’re capturing data off the planter, as it goes across the field, we’ve been able to calculate planting speed. One of the very early signs was we had a report that showed the faster they planted the corn, the better and higher the yield. So, there’s a correlation. That’s an example where faster planting speed was correlated to higher yields, but when you actually interviewed the grower and talked to the grower about what happened in that field, parts of the field worked up rough. And so, they slowed down because they were trying to maintain seed-soil contact. As they went into those areas that worked up rough, they slowed the tractor down and slowed the planter down. In the part of the field that worked up great, they planted at normal speed or higher speed and, sure enough, that was where the higher yields were. The rougher areas worked up rough, so the real correlation was to field conditions of planting, but it showed up as planting speeds. So, it was an example where you can have correlation, but it doesn’t necessarily mean causation.

The COVID thing, Darren, is so wild from a data perspective, and I just feel like we are in the Wild West every time I watch the news. I think there’s way more exposure than what we realize just because of not testing as much. I saw a news clip last week where Rhode Island has the highest number of new cases per 100,000 people. Rhode Island is leading the nation. But then, you look at the other statistic, which is they’re doing way more testing. They’re leading the nation in testing per 100,000 people. The reason they’re leading the nation in new cases is they’re leading the nation in more tests. Clearly, with COVID, there’s a spatial piece to it, like the density of populations. We’re not immune in rural environments, but a whole bunch of people are rethinking living close to other people. We could actually have a migration to rural America because you’re not as packed in as tight as you are in big cities or, obviously, in any place we can find people, space-wise. There’s a big spatial piece to the COVID thing, and there’s going to be so much data analytics coming out of this when we get done. It’ll be interesting.

DARREN FEHR: Let’s talk about nitrogen and data. Nitrogen seems to be a very popular topic, and there’s always this idea that one pound of nitrogen is enough to produce a bushel of corn. Talk to me about this generalization of data.

DAN FRIEBERG: That’s a historic number, so it’s not recent. Universities have all flipped, and that’s not the university recommendation now. For decades, we lived in a world of this idea of 1.2 pounds of nitrogen per bushel produced minus credits for legume. If you’re on a corn-soybean rotation with a 250-bushel yield goal, or 200, let’s say, 1.2 would be 240 minus 40 or 50 pounds of credit for a soybean crop per head. That would put you back at about 200 pounds of N. So, that 1.2 less credits led people to this notion of about a pound of nitrogen per bushel produced. Certainly, what our experience has been is that’s no longer at all close. Nitrogen use in the data, Darren, tends to fluctuate a lot with the price of commodities. I hate to say it, but when we went through a seven-dollar corn cycle, you could see it in N rates. Now that things are tight again, we’re back to what I think we should be all the time, which is trying to squeeze every bushel out of each pound of nutrient that we apply. So, I think we’re actually in a better place. In times like this, we’ve seen people produce plus 200-bushel yields on 0.6 pounds of N per bushel. That’s really scrutinizing your nitrogen and it’s using variable rate to do nitrogen. Growers want to make sure that nitrogen is not what’s yield limiting. They tend to be aggressive a lot of times, and so we try to help them put that in perspective. Actually, that idea of a pound of N per bushel may not be that far off, except that there are zones within a field where 0.7 pounds of N per bushel might be ideal. And there are other parts of the field where it might take more than a pound of N per bushel produced. We believe very much that nitrogen response is very spatial. It changes. The ideal rate changes within each field. Of all the nutrients, nitrogen would probably be the one that is the most uniformly applied. A lot of growers put the same rate on every acre, and so we see it as an opportunity for dramatic improvement.

DARREN FEHR: We are somewhat biased because we’ve been promoting variable rate technology for two decades. Seed population and planting population aren’t that much different. We’re biased because we see the incredible amount of dollars left on the table. Planting population, specifically in soybeans, have just taken a dramatic turn. Talk about that.

DAN FRIEBERG: Soybeans have just been the opposite strategy of corn. We keep backing off the population in the best parts of fields and seem to actually continue to increase yield. We probably hold our populations a little higher in the worst part of the field, just to be more aggressive in those defensive areas. There’s not as many dollars in play from a seed investment perspective, but we’re still seeing dramatic positive results from reducing populations, in almost any kind of a growing environment, as well. Last year, Darren, was the exception because we had so much late-planted. So, last year, because of 2019 being such a wet spring, we pushed soybean planting so late that it was probably the outlier in the data.

DARREN FEHR: What are some examples? You’ve done a lot of work on the economics of variable rate. What are some examples that you can think of that come to mind about just the shock and awe of how much money is left out there when we deploy flat-rate solutions?

DAN FRIEBERG: We have the big data analytics, and we have all kinds of big data analytic tools, but now we’re able to do replicated trials in mass, in volume, in growers’ fields at the speed of farming. The equipment is executing the trial, so it’s preprogrammed. The trial is preprogrammed into the prescription, so we’re laying down replicated trials. We’re ramping up really fast, and then we can aggregate those trial results to like-agronomic environments. I’m a huge advocate of variable rate everything, but now we’re able to put the dollars and cents to it through replicated trials. And it really surprises me. We’re talking about 100-dollar-an-acre net swings for as little as a 4,000-seed difference. Just dramatic swings. So, if you push over the top, if you push populations too far, not only do you spend more on seed, but you can drive yields down really fast. Getting the rate right in every part of every field is big time dollars. On nitrogen, it could be 50-dollar, 60-dollar-an-acre swings. In this world that we’re in right now, when you talk about 50 to 100-dollars-an-acre differences, that’s it. We’re going into struggling to break even. We’re going to need some combination of crop insurance. Growers absolutely hate it, but we’re in a situation where, just to break even, we’re going to need some government program. There are all these political debates on how much to subsidize what part of the sector, but in the ag economy, it’s really difficult to make money, to break even. So, 50 to 100-dollar-an-acre swings, just on how you manage inputs, is real, and it’s big dollars.

DARREN FEHR: That’s a good setup for our next podcast, and that’s, all around, you can’t manage what you don’t measure. So, we’ll talk about that on our next podcast. Final words on how farmers should think about big data from your perspective?

DAN FRIEBERG: Big data needs local context. The best big data is local big data. That’s awesome, so that’s number one. Number two is that, instead of viewing big data as always providing the answers, sometimes I think the best thing about big data is providing the questions. Because big data lets you see relationships that you couldn’t see before, it sets you up to do a trial to answer the question. So, big data can be the source of what to look for next. It’s almost like, instead of providing answers, it provides the next question, which is what we’re all about: this continuous improvement. We’re all about: what can we do to change? What can we help you change to drive continuous improvement? With big data, sometimes it provides answers that you can take to the bank, but a lot of times it provides insights that lead to questions that lead to: let me do a trial. I think I see something, and now I want to prove it.

DARREN FEHR: That’s an incredible insight. Dan, it’s always a pleasure. It’s always fun to hear your thoughts, your experiences. Thanks for sharing your ideas and thoughts on big data.

Yield Efficiency at a Year-End Grower Meeting with SciMax Solutions

“I think people are really good looking at a 10,000-foot view, but when you dive deeper into the economics and profitability, that’s where the rubber meets the road.”
– Landon Aldinger, Farmer, Iowa Falls, IA

PETER BIXEL: Good afternoon. My name is Peter Bixel with SciMax Solutions, and today we’re north of Iowa Falls and visiting with a client of ours, Landon Aldinger.

LANDON ALDINGER: Hello. This is Landon Aldinger. I farm around the Iowa Falls area with my father Mike Aldinger. I am a fourth-generation farmer in our family. We currently run a row crop operation. We have some beef cattle, some hog operations and also have a sales and consulting business here in town called Precision Farm Management.

KATIE DECKER: Tell me a little bit about how you got started with SciMax and why you started working with Peter.

LANDON ALDINGER: Yeah, so I would have met Peter through my father, who, I believe, the connection point was through Latham, correct? Yeah, Latham Hi-Tech Seeds offered a service that was called seed to soil. My brother-in-law Randy and myself and my dad and my dad’s Latham RSM kind of introduced us. Dad was actively working with SciMax at the time through Latham, like I said, but we’ve kind of grown our relationship together over the years, adding various products.

KATIE DECKER: Do you still farm with your father?

LANDON ALDINGER: Yeah. We have a full corn and soybean farm. We have a few fat cattle here up at my place. We own some hog buildings that we do odds and ends with. And then we have a sales and consulting business, where we sell a full retail line of herbicides, fungicides, insecticides, any crop protection products, and then also sell Latham Hi-Tech Seeds and Wyffels Hybrids.

DSC_2089

KATIE DECKER: Talk through how you guys work together.

LANDON ALDINGER: I call Peter and then he doesn’t call me back. No, I’m just kidding. I’m kidding.

PETER BIXEL: It was that way.

LANDON ALDINGER: No, it’s the other way around, usually. I use all the folks at SciMax to assist in creating that crop plan for the year, obviously. Planning from seed placement, a variable-rate nitrogen piece, our variable-rate seeding rates, just pulling all that data together and maximizing our potential profitability and efficiencies. Then, we get to this time of year, where we’re looking backwards and kind of addressing: “How did we do in analyzing that?” The analytical side is why I enjoy the relationship. It’s easy to go out and just pick corn and say: “I got 200 bushel, or whatever you got, and that’s great.” But what did you do to dictate that outcome?

KATIE DECKER: Do you have an instance of a problem you guys were faced with, and then once you started working with SciMax, how they helped you overcome that?

LANDON ALDINGER: Yes, my grandpa actually owned the fertilizer plant.

PETER BIXEL: They had a fertilizer plant, so their fertility levels were really good. As they’ve been pulling off more yield, it just helps Landon now that we’ve been watching the fertility levels by the yield that they’ve been achieving and just being cognizant of what those levels are and how to address them, using the tools to basically fix or continue to keep them where t

hey’re at. They’ve done a lot of litter. A lot of chicken litter too, as well, to help source a lot of that stuff, and then the hog manure that Landon mentioned. So I’d say just really concentrate on those fertility levels to make sure to keep them up because that’s the thing that I think helped Landon’s grandpa, dad and then him, just having that good base. That foundation has really helped set the operation up for success.

KATIE DECKER: How does SciMax really help you get the most out of the data that you’re collecting?

LANDON ALDINGER: Like I said, I think in any system there isn’t always just one variable for success that you can tweak or fine-tune. It’s taking a part of the entire system, what your manure management practices are, what your fertility levels are that he’s talking about, how you’re placing the seed, where you’re placing the seed at what rates. Same with nitrogen. And I think the ability to dive into each one of those segments of that system and analyze this worked with this other combination but didn’t work so well over here, you almost get a blueprint for going forward. I think, as we’ve seen hybrids evolve or their genetics evolve over time, we can really start to tailor-make it to the hybrids. That’s where I see the biggest focus for me, I guess, being a seed dealer, and I carry that onto my customers, too.

PETER BIXEL: Yeah, I think that’s helped Landon, knowing his hybrids inside and then just kind of putting out the practice on his own acres and then seeing: “Okay, if we push it to 38 or 40,000 or something, does it pay?” Maybe it doesn’t because, again, back to the good fertility, everything else is set. So, now if you change that one variable, did it pay? And he can take that to others to help their operation if they’re similar.

LANDON ALDINGER: Or a combination of variables, too. Sometimes that data gets lost in the noise, and it’s hard to kind of separate it out and see. So, I think their services have helped us that way immensely.

PETER BIXEL: This year has just been a challenge because you don’t have Ethan and Tyson going through, each one of them, individually. Two people at Premier go through it all, and I know they have a lot. They go through each one, verify and then, if there’s a question, they send it to their in-house statistician. Then, they send those out, so it’s been taking like a month to get those reports back.

LANDON ALDINGER: Yeah. Well, there’s a lot of stuff in there.

PETER BIXEL: Yeah, we just did it on population this year. That’s all that we looked at. We had two farms. Leto’s and Bradford, I think, were the two that we did.

KATIE DECKER: Can we talk a little bit more? Just go a little deeper into the decision making. How is Peter helping you make those decisions, both agronomically and economically, on your operation?

LANDON ALDINGER: I come from an angle of the seed perspective, being a seed salesman. I want to know everything I can about every hybrid and where it likes to live and how it likes to operate. We’ve done a lot. I think, probably, the bulk of the work that we’ve done with you is the variable-rate planting populations; that and the nitrogen piece for ourselves and customers. I mean, how many times do I call you and just on random stuff, too?

PETER BIXEL: Well, yeah, it’s not necessarily just about, I mean, from fungicide recommendations to product things. I don’t know. I’m just thinking out loud here, but just anything in general. What do I use in my operation? I’ll tell him what I use, but it doesn’t mean he has to or, by any means, needs to. It’s just good, I think. It’s the same way back from him to me, not just me to him. It’s just a sound barrier or somebody to talk through things with and see if your plan or if your strategy makes sense.

LANDON ALDINGER: I think maybe more than one key aspect of that data-driven decision is just forcing operators to think in those terms: doing trials and setting them up and comparing products. I’m looking at two fungicides right behind you, and we had head-to-heads out there, and we learned. I mean, we’re going to look at the data, but I can look at it just visually and see that there was a difference. I think people are really good at just doing the visual 10,000-foot view, but you really have to dive into it and then start doing the whole, from the economics and the profitability side, which is where it really comes down to rubber meets the road.

KATIE DECKER: Can you tell me a little bit more about the trials that you’ve been doing? You don’t have to give me any specifics on certain products or varieties or anything, but maybe why you decided to do the trial and some things that you’ve learned.

LANDON ALDINGER: I’m just thinking in terms of this last year because we probably had a little bit more, but there’s always the fungicide head-to-head. There are always new products, comparing them to old standards and then running the cost analysis of how they compare versus yield. Standard stuff. Varieties. We do a lot of head-to-head populations within those varieties. At Leto’s, we had the high-yielding stuff.

FBscimaxpeterandlandon

PETER BIXEL: Landon was tissue sampling every week and then, basically, had a plan put together of what to apply and when. It’s different from what he was doing on other acres to see if he could push it or what we’d see.

LANDON ALDINGER: Correct.

KATIE DECKER: What do you think is the value of working with Peter and SciMax, in general? Why would you work with them over a competitor or someone else?

LANDON ALDINGER: Right now, I would put it mainly on trust. We talk, probably, I don’t even know how often but quite often. He’s just a trusted advisor, and I don’t really like that term, but it is. I know I’m getting the honest truth when I call him and he gives me his recommendation. And if it’s something different than what I see, then we try to dive into: “Why are my results different than what your results are?” But I think there’s just a trust factor right now, and that’s why we’ve continued to partner with them for the long term.

Please subscribe, rate and review this podcast so we can continue to provide the best precision ag and analytic results for you.

Three Steps to Combine Farm Agronomics and Economics

We often use the phrase, “Everything agronomic is economic.” What does that really mean?

First, let’s first define agronomics and economics. What is agronomics? That’s everything that we do in the field related to making good management decisions. It’s deciding how much fertilizer to apply and where to put it, planting rates, crop protection, tillage systems and how to incorporate all of this into the farm. Those all go into how we grow our crop. On the economics side, we’re talking about all of the money involved in farming. Farming is a business, and just like any other business, you need to make sure you have cash flow so you have the opportunity to farm again next year, and the year after that. So, how do we focus on agronomics and economics? We do that by analyzing growers’ data. We use that knowledge to help them make decisions on their farm.

Knowing what you’ve done on the farm in the last five, 10, or 20 years can provide valuable knowledge as you plan into the future. However, if you never take that data and don’t use it to make decisions, it’s not doing you any good. It’s important to invest time into collecting your farm data. We work with growers to analyze their collected field data. We add costs to the layers of data including product cost, operations cost, management cost if they have any land-specific cost, and tie that to the yield file so we can see what is making agronomic and economic sense on the farm.

It’s fairly easy to tell where there are higher yields, but it’s a lot harder to know if that yield increase also caused an increase in the pocket book. Did the decision pay for itself? Did you produce enough bushels to offset the cost of production? Every pass across the field matters agronomically, but it also has a cost associated with it. We give you three steps to help combine your farm agronomics and economics below.

1. PLANTING

When you’re preparing to plant, your seed has the highest yield potential it’s ever going to have. Everything we do at Premier Crop is aligned with protecting yield potential, and planting population is a big aspect of this. If you overcrowd the plants, you’re going to make them compete for resources, which will end up reducing your yields. On the flip side, if you have too low of a population, then you’re reducing your yield potential by not having enough in the first place. You can’t produce more bushels of corn if you never plant the seed to begin with.

Combining agronomics and economics is about finding the right rate for the right part of the field, which we accomplish with management zones. A management zone is not just a seeding rate like it is with many other precision ag companies. We manage the field and the operation off of the zones. We break fields into high-producing areas, which are A zones, average-producing areas, which are B zones, and lower-producing areas, which are C zones. The B zones are the types of areas that do pretty well year in and year out, but they don’t have the capability to be the highest producing areas of the field. Our C zones could look like a wet spot, an area shaded by trees, or a family of deer could live nearby and eat it all the time. We manage nearly everything based on these zones.

premiercroppbreakevencostperbushel

In the A zones, our high-producing areas, we push planting populations. We plant more seeds in these areas because these parts of the fields have the capability to produce more bushels. In the C zones, we’re going to pull back our population because we know those spots just simply don’t have the yield potential. By labeling it as a C zone and understanding that it is not going to produce as well, we can manage risk by lowering the planting population. This practice will save money on seed costs in this part of the field because by lowering the population, we have reduced seed cost, which helps the bottom line. However, if we can get part of the field from a C zone to a B zone, or from a B zone to an A zone with fertilizer or any management practice, we will go after that to increase our return to land and management, what we call yield efficiency.

2. FERTILIZER

When variable-rate technologies first came out, the discussion was: “It’s going to save you money and reduce your fertilizer usage.” We found that’s not always the case, though. Instead, grower’s are making better decisions with their planting or fertilizer dollars. They are putting those dollars in the areas of the field where it’s needed and where they can get a return on their investment. We are driving farming towards thinking more on the economic side of the business.

In general with farming, if you’re doing a straight rate across the field, you’re essentially treating every acre the same. We know that every acre is not the same because when you’re harvesting, even if you don’t use a yield monitor, you can see variation in the amount of loads you’re taking off. You can tell how good or bad the corn is as you’re driving across the field. So, why would you treat your inputs the same if you’re not taking the same amount off of it at the end of the day? That’s why it’s so important to tie the economics to planting, and fertilizer. That is where the real benefit lies.

Even if you are locked in on your planting populations, placing different checks in a field through different years allows you to gather historical data and be able to check and say: “In this year, if we’re looking at a cold, wet spring, this is the best population to go with.” Even if we don’t use that specific data in the next year, we are still collecting it for future years.

It is also important to factor in your planting population when you’re determining your nitrogen rates. We often use the example: If you invite more plants to dinner, you have to have enough food to feed them. We could apply a straight rate, but we’re going to be overfeeding the poor-production areas and underfeeding the high-production areas. So, if you have a higher population in the A zones, you need to account for the added food they’re going to need. We can also push the nitrogen rates a little higher in the A zones because we have the capability to produce more bushels, not just because of the higher population but just because the ground is better. By pushing that, you’re taking a little bit more risk, but it’s a smart risk.

3. ANALYTICS

To get started looking at a grower’s analytics, we first pull yield monitor data. Then we look at everything the grower has done throughout the year, whether it’s fertilizer, lime, planting, nutrients, or crop protection products. We dig in and see what the economic benefit was. When planting, did we build small test plots into the planting maps for our growers called Learning Blocks. We then use the information from our all of our data within a management zone to see if we have the right rate. Learning Blocks not only show us what produces the highest yield, but it also shows which population provides the greatest return on investment. Once the prescription is in a grower’s monitor, they can just focus on farming. It’s very little thinking on a grower’s part because we’re constantly constantly checking our work.  It is important that we prove what we’re doing is the best option possible.

premiercropgrowerseedingtrials

The analytics is where the magic happens. Not many companies look at what happened after harvest. Premier Crop uses our platform to make informed decisions based on what the growers data is proving through on-farm trials, Learning Blocks and Enhanced Learning Blocks to provide statical confidence to help the grower see their profit.


Not every operation has the same goals and not everyone sets out to produce the max amount of bushels. It’s a “do it and check” process. We go out and do something, we check our work, and then we make corrections for the next year. As a grower, you’re always busy. You are going from one thing to the next, and there’s always something to do. Going through the data can be a tedious task that leaves you feeling like your time would’ve been better spent elsewhere. The benefit of working with a Premier Crop Advisor is that we retrieve the data, clean it up, and enter it into the system. A grower just needs to hit “record” when they’re running through the field.

Want to learn how you can work with an Agronomic Advisor to start making agronomic decisions based on your economics? Contact us to schedule a demo today.

Learn more about the farm profitability.

Managing Profitability with Ag View Solutions

“We’re all about tying the economics to the agronomics, which just means when we’re adjusting nutrient rates and plant seeding rates and decisions about what we spend in different parts of the field, we’re tying that out at the end of the year.
– Dan Frieberg

RENEE HANSEN: Welcome to the Premier Podcast, where everything agronomic is economic. Today, we’re talking with Shay Foulk with Ag View Solutions on his Ag View Pitch podcast. We recommend that you go listen to the Ag View Pitch podcast and subscribe. They have numerous podcasts out there with lots of valuable information. Today, Shay is talking with Dan Frieberg and Brenton Rossman about the value of Premier Crop.

SHAY FOULK: Welcome back, everyone, to another episode of the Ag View Pitch. Today, you have Shay Foulk with some special guests from Premier Crop Systems. I appreciate everybody taking a little bit of time to join in. We have Dan Frieberg and Brenton Rossman, as well as Renee Hansen, tuning in. Dan and Brenton, I’m hoping here that we can get a good introduction from both of you and learn a little bit more about what Premier Crop Systems is. I’ll preface this by saying we really enjoy having this perspective and different conversations on what organizations can provide and what value they can bring to the farmers that are listening to this podcast. So, if we could just start with a quick introduction from each of you and get going from there.

DAN FRIEBERG: Sure, I’ll go first. Dan Frieberg, and I started the company in 1999. Really, Shay, it was kind of the advent of a lot of spatial files, meaning georeferenced files. So, if you think of a yield file, we were starting to be able to tie the yield monitor out to a GPS receiver. Then, soil sampling and variable-rate nutrient activity was going on. So, it was just all this agronomic data that now could be georeferenced to a spot in the world. It was just kind of born out of that idea of being able to tie it all out and build a database file that is a georeference for each field each year and be able to analyze the results and provide insights and turn that into action the next year. The company does just a lot of variable-rate activity. We just believe that the right rate changes within a field boundary. That’s how we got started, and I’ll let Brenton go from his perspective.

BRENTON ROSSMAN: Yeah, thanks. Brenton Rossman. I’ve been with Premier Crop Systems for five years now. Started with the company right after college. Primarily work with our retail partners in delivering our program through the retail channel. So, I live in northwest Iowa, which is where I grew up and have the opportunity to help on my family’s farm. I enjoy getting to utilize our tools and get firsthand use with them on our own operation, as well. Happy to be visiting with you today.

SHAY FOULK: Yeah, that’s great. When it comes to that georeferencing that you were talking about, Dan, I recently read a report that anywhere from 62 to 70% of farmers across the United States are utilizing some form of yield mapping systems or variable-rate applications. How have you seen the adoption of these technologies change over the last decade or so, in particular, I guess, through the Midwest here, where we’re generally located? What do you think that opportunity looks like in the future?

DAN FRIEBERG: I think we went through a period of high commodity prices the last time. The equipment companies, really, were one of the beneficiaries of high commodity prices. So, a whole bunch of people upgraded equipment, and every time that happens, they upgrade technology, as well. Then, that means that the technology they were using passes to the next buyer of that equipment. So, there’s kind of this ripple effect of more and more technology. That’s why surveys come back like that, but what we find is a lot of people aren’t really utilizing the data the way we think it’s possible. So, a yield monitor can become “Harvest TV,” where it’s almost like an expensive moisture sampler, which is great because you’re able to direct grain to the right spot for drying and things like that. But we think there’s so much more possibility to use your yield file as a way to measure agronomic and economic success.

SHAY FOULK: You better be careful, Dan. I might steal that “Harvest TV” and make a YouTube channel out of it. I like that term. Brenton, from your perspective as the farmer and the background that you’ve had with your family operation there, how long have you had some of this technology in the farm operation, and where do you see advancements from the farmer perspective moving forward?

BRENTON ROSSMAN: I would say my dad has been a fairly early adopter to the hardware side of the technology. Variable-rate drives on our planter probably the last 12 years, at least, I would say. Collecting yield since the nineties. So, we’ve been early adopters on that stage of the conversation, but as far as taking that information that we’ve been collecting, if you go into my dad’s office, he’s got notebooks and binders full of maps, all of this information, but now we’ll be able to use the data behind that information. So, where I see it going is just the ability to collect, analyze more of this machine data and information, have it stored in one location and then utilize the power of computers and software to, then, look at it in different ways so we can make decisions going forward.

SHAY FOULK: I think how you phrase that is a great segue into the next question that I have. I know some of what you deal with, with Premier Crop Systems, is looking at yield efficiency and how are we taking these variables and making really good decisions with it? So, Dan, I was wondering if you can kind of talk on some more specific things that Premier Crop offers to the farm operations that they’re working with. What does that look like today if someone was interested in finding out more about what you all do?

DAN FRIEBERG: Gladly. Shay, a lot of times, we use the phrase “everything agronomic is economic.” We’re all about tying the economics to the agronomics, which just means when we’re adjusting nutrient rates and plant seeding rates and decisions about what we spend in different parts of the field, we’re tying that out at the end of the year. So, we’re capturing that spatially. That cost is tied to the file. If we recommend and encourage you to plant more seeds in what we think is the best part of the field, we’re capturing that additional seed cost as an input cost. We can map it all the way to breakeven cost per bushel, and that would include land and management costs, but we describe yield efficiency as return to land and management at a benchmark selling price. The user interface lets the grower set their own selling price, so it’s calculating revenue minus what you invested in nutrients, crop protection, seed and field operations. Shay, we wanted a way to take land cost and management cost out of the benchmarking nature of it. We found that land cost can really be a real distortion when you’re trying to benchmark across operations. It’s really that same message. If we adjust inputs, we’re tracking the cost either up or down. So, we’re able, at the end of the year, to show whether that was the right decision or not.

SHAY FOULK: I was talking with a really good operation here in western Illinois, about 30 minutes before we were recording this podcast here. He made the comment that you kind of have to have three to four years of good information to make decisions off of it. And, of course, there’s low hanging fruit. Year one, you’re going to see some things that are pointed out: variable rates, quickly identify issues, particularly when it comes to soil sampling or plant tissue sampling, and learn more about your operation. You use the term benchmark there, and, with some of what we do, we’re very careful with benchmarking from a standpoint of no two operations are the same. But I think what, sometimes, people get confused with is benchmarking doesn’t have to be against other farm operations. Benchmarking against your own operation, and, like you said, that land cost can throw such a wrench in understanding how that ties into an overall system and what management decisions you can be making out of that. But I’m sure that information is extremely powerful once you have two, three, four years worth of information at your own benchmark and then making decisions for your operation moving forward. Do you have any comments on that?

DAN FRIEBERG: I think, for me, the internal benchmark, like you say, is by far the most powerful. Amazingly, the growers love to benchmark against each other. Sometimes, I don’t understand why, but they love to be able to see beyond their own operation. So, whenever they look beyond their own operation, it’s anonymous, and they don’t know who they’re benchmarking against, and it can be extremely local or regional or a fairly good-sized group. So, benchmarking, growers love that piece of it, and they love the economic piece too. Personally, I think the most powerful is within your own operation, just field by field and then drilling down within a field by management zones. Shay, the one thing I would tell you is we’ve come up with a way to start making decisions even quicker. In 2005, we started putting check blocks inside prescriptions, and we trademark that as learning blocks. A learning block is just a comparison area. It’s like introducing an experiment into the field, and we’ve just automated the process. That’s kind of what software is really good at, is automating processes. But what it does is it lets you, in a single year, it lets you go to school in areas of the field. It’s really, really popular. If I suggested you plant 39,000 in the best part of the field, you’d have anxiety about whether that was too much or not, or whether it was worth the seed investment. But you’d try an acre. You would try an acre of 39,000 in a heartbeat just to see if it worked or see if it paid. So, learning blocks, now we’ve added more to that where you can do replicated trials. You can do multiple rates and have it be replicated, but it’s really opened the door to how do I get there quicker? How do I get on that journey of making decisions and getting this constant feedback? Every year is different. So, what you said a little bit ago is exactly right. Three or four years of data is way better than one year, but you can get started really quick. We’ve had people start where, like on variable-rate soybeans, they were so unsure of what to do that they just seeded the field at the normal rate, and they put a bunch of learning blocks in just to experiment with different rates.

Screen Shot 2021-03-25 at 8.25.01 AM

SHAY FOULK: That’s great. One thing I want to go back to on the benchmarking, too, is a reason why a lot of farm operations that we work with like that exterior benchmarking. I’m not saying benchmarking is bad, so I don’t want that to be misconstrued here. But the reason they like that additional benchmarking is, sometimes, as farmers, we are the CEOs and the shareholders and the managers and the laborers all in one. Not every operation is a collaborative opportunity amongst different farmers. Not everybody has a community infrastructure where they can ask questions and look at economics in comparison, or maybe they don’t even have a family member to rely on, anywhere from first-generation farmers to someone that has just had to take on a lot of responsibility. So, I can see that benchmarking being a very valuable tool and then taking that information, like you said, with these learning blocks and applying that as quickly as possible. Brenton and I were talking here offline. One of the challenges with the learning process with some of this data is when it gets to variety or hybrid-specific crop analysis because in the industry, I mean, three to five years is about the lifetime that we’re seeing in these, and you can’t always make good decisions. About the time you learn what a hybrid does or how it responds, aside from the information that you’re getting from the seed companies, right when you get comfortable with it, there’s something else new out. And you have to take advantage of that because of the genetics and because of the advancements that we’re seeing in chemistry and herbicide resistance and things like that. So, I guess, Brenton, can you talk about that a little bit from a farmer perspective? It sounds like there are other things that we can quickly learn. Then, as we learn these products, the variety and hybrid-specific products, we can continue to make good decisions off of that, correct?

BRENTON ROSSMAN: Yeah, and that’s one thing. A passion of mine is on farm trialing and learning as much as I can, trying to put data into practice on our own farm to make the next step faster with a hybrid in year two or year three if this was its first year in season. What can we learn about all the different agronomic situations or scenarios on our own farm? How do hybrids perform differently? Lighter ground, heavier ground. High soil test P and K versus low soil test areas. We’ve done a lot of population trials on our farm, and it’s interesting. Definitely not bashing seed companies or anything, but we’ve done trials where we plant a certain hybrid at 35,000. That may be the suggested rate. On a certain soil type in a certain environment on my own fields, we see the highest return at 31,000 seeds per acre, so a lower seeding rate. Just having the ability to do some of this testing on our own farm, learning about the local environment, I’m going to trust the data from my own farm and use that for making decisions going forward.

SHAY FOULK: Well, and Dan, you said it really well at the beginning of this podcast. You have variability within your field boundaries. Whether it’s a 10-acre field, a 4,400-acre field, it doesn’t matter what size it is. There’s variability, and farmers know how to manage that instinctively, especially as you get time and experience in there. But if we can take that information from learning blocks or farm management zones and make better decisions off of it, hopefully we can learn quicker, and hopefully we can save money. Are you guys generating profit maps at this point?

DAN FRIEBERG: We do. Right now, it’s breakeven cost per bushel.

SHAY FOULK: Okay.

DAN FRIEBERG: So, we kind of focus that way, and it goes back to that we want to deliver the map the second yield file hits versus when the crop is marketed. A lot of growers sell over a 12-month period, so they don’t actually know their selling price, a lot of times, until months after harvest.

SHAY FOULK: That’s where the marketing decisions can be key, though, on knowing that cost of production and having it dialed in. Of course, that’s what we spend a lot of time working with growers on, and Chris and I will be the first ones to tell anybody out there. We run a system called Profit Manager, and you don’t have to use Profit Manager. You can use university systems. You can use any number of programs that are out there, but knowing that cost of production, and then how it ties back into the whole operation, is key and, I think, looking at it at a breakeven cost. If I know, as a farmer, instinctively, what my cost of production is, if I have that dialed into the penny, for me, let’s say it’s $3.72 or whatever it is on corn. If I’m looking at an area of the field that’s saying, hey, your breakeven is $5.43 here, that’s pretty eye-opening because we market in bushels. We’re not marketing off of dollars revenue per acre most of the time. Some operations do it that way, and they are successful at that, but it can be a pretty easy way to look at that. So, I think that’s interesting from the profit mapping perspective. How long have you been doing that?

DAN FRIEBERG: We actually started doing that in the very beginning. Almost killed the company in 1999 by doing it because what we ran into when we rolled it out is, first of all, back then, there was a lot of disorganization among growers. So, you would ask a grower for the cost information, and they would hand you a folder full of seed invoices and say, here, you sort it out. Back then, there were just a lot of growers who weren’t super organized. We’ve transitioned a lot in the last 20 years. But the second thing, Shay, is it really ratchets up the trust level between the grower. When you’re starting to track, when you really are getting to breakeven cost per bushel, that’s the most private information. If you put your actual land and management costs into it, too, that’s really private information. It’s the P and L for the field, so it’s super private. We kind of walked our way into it. Now, a lot of times, people start out, and it’s a faster transition now than it was back then. But they kind of have to get confidence before they’re really willing to share every detail about their operations.

SHAY FOULK: Yeah, and I understand that. I mean, farmers have a certain level of independence that they like, and there’s a reason, sometimes, that they’re in the industry because they’re their own boss. They can make the decisions. They can choose who they share the information with. So many operations we’ve seen have taken the understanding of, maybe, I can’t do all of this as effectively as someone else can by helping me. I talk with people all the time on that. When it comes to the reservation of sharing numbers, folks like us with the consulting side, or you all with the data management, we don’t care personally what John Farmer’s numbers are in north central Iowa or southwest Indiana. I mean, we don’t have the capacity to do anything with that information nor would we want to. We keep that wholly private, and having conversations with you all offline, too, I think, is one of the reasons I wanted to conduct this podcast. It’s just understanding that anytime you can get linked in with a company that really, truly values what the farmer is looking for and providing the value in that relationship and ensuring that they have that privacy and that the numbers aren’t going to be shared, and you’re just here as a provider to help them grow, that’s an excellent business model. I really appreciate it from that perspective. Go ahead, Dan.

DAN FRIEBERG: Shay, when you were talking about the high-cost areas of fields, you were talking about breakeven cost per bushel, and then you said, but what if I have an area that’s $5.42 or whatever. That happens. That’s real. We typically don’t tell any grower that we’re going to save them money because, a lot of times, if we save money on one part of the field, we invest it in another part of the field. But there are parts of fields where not investing as much is the only way you can lower your breakeven cost per bushel. You just can’t continue to invest the same in those parts of the field. You still have to farm them, but, for us, it’s all about making sure that the investment in crop protection and nutrients and seed is right for that area of the field. Sometimes, those are the best success stories, just learning to manage your investment in those poor-producing areas. Again, on a per-acre basis, you’re going to spend that money on the best part, but investing less in the worst part of the field, sometimes, is the only way to lower your breakeven.

SHAY FOULK: Brenton, I’m going to pick on you for a couple of minutes here. Dan, having tons, decades of experience here and starting the company, for you, with the — and I’m not saying Dan doesn’t — but having the real boots on the ground and talking with farmers all the time and having these conversations, what would you say makes Premier Crop Systems different from others in the industry that are doing some of this? What do you think the future of this type of business is? How do you see it continuing to provide value to farmers?

BRENTON ROSSMAN: I think the first thing that partners I work with, or growers I come into contact with, is they appreciate our independence as a company not tied to any input sales. We sell our service and our solutions. So, that’s important to me, and I think that’s important to a lot of our customers, as well, and also having a system that is not a canned output. Output from our system changes based on the grower’s goals. Advisors have the ability to customize their delivery, maybe, as Farmer John, for example, has a real interest in dialing in his fertility rates and maximizing his efficiency with that aspect of his operation. But Farmer Tom down the road is much more interested in the seed side of things, so just the ability to have a holistic solution that is completely customizable. I just think the business model, or that mentality, going forward will just continue to have success as the farmer of the future continues to evolve, and the younger generation, like myself, becomes more involved and wants to make decisions from data, has questions and really wants to dive into this information.

SHAY FOULK: One thing I would add to that is, you said it there in a little bit of a different way, but even though we’re moving towards making better management decisions, it doesn’t make things less complex necessarily. There are more and more high-management situations and high-management decisions to push the yield or to push the yield efficiency in some cases, too. I think, as we start experimenting and working with more of these things, whether you’re putting liquid in your planter, or you’re having a multipass nitrogen system, or you’re trying any number of biological products or a lot of the great programs that are out there right now, I think it gets even more important at that level of managing that information because, not only on a cost of production side, but from an information overload side. Is what I’m doing really working? Is what I’m doing really having the yield efficiency outlook that I want and providing the revenue back based on the time, effort, money in management that I’m putting into it? So, I think, as we gain the complexity in these operations, you have to have some sort of data management system that reports back to you or that you can take those numbers and do something with it because it has to be actionable. Dan, I think you hit on this early on. We’ve had this yield mapping information for 20 years or more at this point. We’ve had variable-rate planting information, and yet, today, I still get questions probably once a week on, well, where are your soybean planting rates at? Or what are other farm operations doing for nitrogen and fertility management? There’s nothing wrong with asking those questions, but in order to take that next step in the farming operation, we have to take actionable information and do something with it. So, Dan, I don’t know if you have any other comments on that.

DAN FRIEBERG: No, just everything you said is right on. It’s also like what you were talking about. Before the podcast, I was asking you about your experience with cover crops because that’s a big one we get. There are a lot of growers who have never done anything with cover crops, so they’re wanting insights or wanting to know the economics, and we’re constantly trying to figure out how we help prove it out quicker. That’s exactly why I was asking for your experience, because there’s just a lot of attention right now on cover crops.

SHAY FOULK: Absolutely. Is there anything that I’m not asking or anything that you’d want the listeners of this podcast to keep in mind as we move forward? The podcast is distributed all over the United States and Canada, farm operations of any shape and size. What message would you want to leave the listeners of this podcast with, as we wrap up here?

DAN FRIEBERG: Agronomy is local. What matters in one part of the country sure doesn’t in another part of the country, or it’s different. So, nitrogen management would be a great example, where what strategy you use really changes based on where you are. There are major east-west differences. There are big north-south differences. That agronomy local message is really a key. When you were talking about benchmarking, and we were talking about sharing data, it’s one of the reasons growers love these aggregated data sets that we talk about, where you’re anonymously comparing to other operations. It lets you see hybrids and varieties that you didn’t get to plant. You probably had 30 or 40 elite numbers pitched to you, and you might’ve planted 10 of them. But at the end of the year, you’d like to know how the other 30 that you passed on did. It’s just all part of that learning faster. How does everybody learn faster? Having a data platform to help growers learn faster is just a big piece of where our hearts are at and where we believe our future’s at.

SHAY FOULK: From your point there, Dan, too, I want to bring in a point from Brenton and I’s conversation here a week or week and a half ago, whenever it was, of that independence. You’re not tied to a seed company. You’re not tied to a chemical company. So, regardless of which of those top 40 hybrids did best or varieties, or maybe it wasn’t even one of those that was pitched to you that just had a fantastic year, being able to learn from that information and seeing it and having it available and understanding how it might fit into your management zones on the farm operation. It can make some of those decisions a little bit easier. The other thing that’s really unique about this is, not only with it being non-identifiable back to a particular operation or not being able to see anybody’s particular numbers, is when it comes to managing those decisions. If you have 40 products in front of you, it can be really overwhelming, but being able to take that and make those decisions faster, I really appreciate that perspective. I’m going to turn to you, Brenton, on this. If someone’s listening to this and wants to learn more about Premier Crop Systems, how do they get a hold of you guys? How do they ask some of these key questions and see what your services look like?

BRENTON ROSSMAN: I’d say the best way to get a hold of us would be to just visit our website. From the website premiercrop.com, there’ll be a link on there for contacting us. Then, we’ll get you in touch with the right person.

SHAY FOULK: Absolutely. Dan Frieberg and Brenton Rossman, I really appreciate the time today, guys. Hopefully, those listening to the podcast got some value out of this, whether you choose to talk to someone at Premier Crop Systems, or just taking the information that you’ve learned here and maybe thinking about it as a different way. We have an exciting, new 2021 season ahead of us, and we all get opportunities to make good decisions. And the farmer is the eternal optimist. So, getting linked in with some of these people that can help your operation and take it to the next level, I think, is so important to hear more about those of you in the industry who are doing some of these things. So, Dan and Brenton, I really appreciate the time.

DAN FRIEBERG: Thank you, great to be with you.

SHAY FOULK: Thanks to Renee and Molly for getting us linked in. Really glad that we can do this. And, most importantly, thank you to everyone on the Ag View Pitch for tuning into another podcast, and we will catch you next time.

RENEE HANSEN: Thanks for listening to the Premier Podcast, where everything agronomic is economic. Please subscribe, rate and review this podcast, so we can continue to provide the best precision ag and analytic results for you. And to learn more about Premier Crop, visit our blog at premiercrop.com.

Big Data With Local Context

Big data is a phrase that has integrated this world of technology across industries. It’s about capturing relevant data from a huge number of sources, and translating it into something that people can use. Big data provides actionable insights to solve problems at scale and at speed. In this world of ag, we have billions of dollars of venture capital funding pouring into agriculture through technology builds. Big data has been at the center of that.

There are several ways big data can be advantageous to agriculture. It depends on your goals. What do you want to accomplish with the data? Obviously, big data is enabled by computing power. We have much more capacity because of server farms and cloud computing. These let us collect more and crunch through more data.

In ag, the topic of big data is relatively recent. Before yield monitors, we made many decisions in ag based on what I would call small data, which was a lot of replicated trials. A replication in a trial might be 25-feet-long, replicated three times, and becomes an observation. So now with yield monitors and all the other devices, we’re able to collect data at a high resolution. In a hundred-acre field, we would divide that field into 4,000 unique observations that are geo-referenced, tied with a lat, long, yield value and hundreds of layers of data underneath.

There’s a ton of data being collected today in ag from many different sources. Much of it is public. It seems like there are newer companies trying to take advantage of public data and the complexity of sourcing it and putting it together into some usable format. Public data is not drilled down to a level where I think it’s all that helpful. If you’re a company selling an analytics package to a grain trading company, you don’t need it refined. With that type of data, you’re trying to understand global yield trends and how it will move the supply chain. So a lot of the public sources aren’t as valuable to a grower as they are to other stakeholders.

MYTHS OF BIG DATA

Let’s talk about some of the myths out there on big data. We often hear the words “weather modeling,” but what we’re talking about is predicting the future. It might be future weather or future performance.

All models are based on assumptions. It’s about understanding specific geographies within fields, and how they’re similar to geographies in other fields. It’s almost like the more data you get, the more it lets you break it apart into more meaningful insights. The power of what we have in ag is that you have different growing environments every year. As a company, we get to observe different growing environments within the same year. So, Nebraska or Minnesota can have a dramatically different growing environment than Indiana and Ohio. For example, you could see how a hybrid or variety performs in the same year in dramatically different growing environments because you’re seeing it across these big geographies. It’s highly dependent on believing in the idea that agronomy is local, that agronomy and geography have a really close relationship with each other. It relates to the idea of big data, and aggregating it across multiple different agronomic environments. So how do we give it enough credibility that people can make decisions?

Over the years, the ability to aggregate data geographically has been a big deal. The ultimate power of all this is at a subfield level because that’s where you drive change. Every farmer who works with us wants to see beyond their own operation. They want to see agronomic practices, trends and rates.

When a farmer starts working with us, they usually want to see the biggest data set possible, meaning they want to see data from a large geography. However, we believe that local data is king in agriculture. The bigger, richer data set from a local perspective is more powerful because there are more things that are relevant and stay the same. We almost went through a decade where it seemed like the whole seed industry on corn was going to fixed-year numbers. The only way you could drive yield was to drive population. No matter what size of database, we saw a trend. We were marching up 400 or 500 seeds per acre for a decade because that’s what it took in order to drive yields.

Now, we’ve gone through almost a decade where it seems like there’s more flex in numbers. We’re producing much higher yields at lower populations. However, when we were going through that match up in population, growers started looking at row width. We had this phenomenon where everybody was chasing 20-inch corn or even narrower corn. The plants were on top of each other, and needed to be more spaced out. In the data, 20-inch corn was a South Dakota and southern Minnesota phenomenon. That’s where we were seeing the most 20-inch corn. We had people outside of that area that wanted to drill down. They wanted to see data outside of their area because they were trying to make a decision about switching to a narrower row of corn. This was a way to space out the plants as they continue to drive the population.

Since we’re capturing data off the planter, as it goes across the field, we’ve been able to calculate planting speed. One of the very early signs was we had a report that showed the faster they planted the corn, the better and higher the yield. That’s an example where faster planting speed was correlated to higher yields, but when you actually interviewed the grower and talked to the grower about what happened in that field, parts of the field worked up rough. And so, they slowed down because they were trying to maintain seed-soil contact. As they went into those areas that worked up rough, they slowed the tractor down and slowed the planter down. In the part of the field that worked up great, they planted at normal speed or higher speed and, sure enough, that was where the higher yields were. The rougher areas worked up rough, so the real correlation was to field conditions of planting, but it showed up as planting speeds. So, it was an example where you can have correlation, but it doesn’t necessarily mean causation.

One of the many myths people believe about big data is that if you haven’t got involved already, you’re probably too late.

Many growers are sitting on data and no one has helped them put it to use. There are growers who quit caring about yield data because they haven’t been able to use it. One of our successes is that we grab that historic yield data and try to use it to capture the variability within fields. You can go from zero to big data really quick in farming. You can start at any time and begin creating value right away.

Six Frustrations with Precision ag

“Growers tell me they are frustrated with precision ag, they’ve invested in the technology. I tell them, ‘You just want to put the pieces of the puzzle together to see exactly what the picture is.’ And they are relieved when Premier Crop can help.”

– Katie McWhirter, Director of Training and Development


RENEE HANSEN: Today, we’re talking with Katie McWhirter, our Manager of Training and Development. Katie is chatting with us about the frustrations of precision ag.  Katie, tell us a little bit about your background and a little more about you and your role at Premier Crop?

KATIE MCWHIRTER: I was born on your typical farm in southeast Iowa, livestock and row crop. My father’s just now retiring, but funny as he is, he is in his late sixties, and in 2013, he invested in electric drives to be able to variable-rate seed. He variable-rates his fertilizer. He does all that, which is so not what people think of that generation, embracing technology like that, but he knew that, working with me, he’d be able to make use of that equipment that he was investing in. Then, on the flip side, I have a brother who was, I guess for lack of better words, gifted or brought into the row crop world. He’s actually in the livestock industry and doesn’t have that technology, but we started talking one day, and he said: ‘I think I can use my data to do better. It’s not that good.’ So, talking with him, does he have the latest and greatest? No. But, again, his data is everywhere, and it’s just meeting him where he’s at to say, okay, I realize you don’t have this technology or this technology, but we can still use what you have to make a better decision. Even as recent as about an hour ago, I’m entering in some of his costs and his inputs to really make him see that there is variability within his operation even at a field level, which means profitability is variable at that field level. So, I’m excited to watch his journey as he gets more into this space.

20210405_170325

FRUSTRATION #1: CONNECTIVITY

RENEE HANSEN: So, Katie, what would you say? We were talking before we hit record on this podcast, how do you come up with a list of five to 10 things that growers don’t like or are frustrated about with ag technology?

KATIE MCWHIRTER: Well, those frustrations definitely vary in the different hats that I wear. Probably the biggest frustration is that these technologies, if you’re talking about in or on the equipment, would be that they don’t communicate together, especially if they’re not a solid color, meaning they’re not all the same brand of equipment. That is a frustration for growers. I would say, also, a very big frustration, and funny as I’ve been out here in the last couple weeks, growers don’t think that they could, I wouldn’t say, benefit from our services, but they’re very worried because they don’t think their data is good. So, it’s two combines, it’s three combines, it’s not calibrated. How can you change some of these frustrations? What we can do, is take that data, and as long as it’s capturing that variability and we have an end measurement, whether that’s going to be bushels or yield, we can post-calibrate or make that data usable within our system. I think even the simplest technologies really can benefit from what we do.

I think one of the things I’ve learned is that we really have to ask questions to these growers to find out, when they talk about ag technology, no different than what I did with you, to find out what exactly they’re frustrated with. If they’re frustrated with data, what do they mean by that? I mean, is it they’re frustrated because they’ve got two or three combines or two or three planters and it’s not all brought together? Is it because they don’t feel like they’re getting a complete picture? I met with a grower yesterday who said: ‘The soil sampling is here. We’ve got these spreadsheets on our computer. Their data’s all over the place.’ I smiled, and I said: ‘You just want to put the pieces of the puzzle together to see exactly what the picture is.’ They’re like: ‘Yes, that’s what we want because we’ve invested in it. We know that each of those separately has been bringing us value, but it’s also bringing us frustration as we know we should be bringing them all together to make an even better decision.’

FRUSTRATION #2: DATA ISN’T GOOD ENOUGH

RENEE HANSEN: What was some of his biggest hesitation? I know you mentioned that he felt his data wasn’t good enough but elaborate on that a little bit more. Tell me more about that.

KATIE MCWHIRTER: Well, the yield monitor doesn’t have a card in it, so we haven’t been collecting yield data. So, I mean, the basics of what we’ve always said is a must. It’s really what we’re rooted in, but with our new planning tools, I immediately was like: ‘Okay, but there’s so much more we can do even by putting together, at the field level, his yield goals and his expected revenue and his variable-rated nutrients because he’s been grid sampling.’ Even though he doesn’t have what we, even a month ago, thought was an essential piece of what we had to have to be able to work with a grower, he’s going to test me on this one because he’ll get a yield monitor. That’s the agreement by fall, but I believe we can still provide him value being early enough and being able to identify his yield efficiency scores, his planned yield efficiency scores in each field, to be able to potentially identify profit robbers and how we could try to lessen that on his operation as a whole. Yeah, he definitely was hesitant until I showed him. I’m like: ‘Here’s what I need.’ And he immediately says to me, he’s pointing at the paper, and he’s like: ‘I’ve got this. I’ve got this. I’ve got this.’ I’m like: ‘Yeah, you’ve got the pieces. Let’s get them put together.’

RENEE HANSEN: Yeah, putting it together all in one system, and you also mentioned connection and connectivity. I mean, that seems to be everything’s everywhere. So, you also tell me, what are you doing to help him solve that and get all the information into one spot? I mean, you are doing some of the work for him.

KATIE MCWHIRTER: Right. So, I get the pleasure of contacting the people on his agronomy team. I think, before, some people might’ve seen us as the competition or a threat, and what I’ve said to both his seed supplier and his crop protection and fertilizer salesperson is I’m not here to step on your toes. I don’t sell those things. What I’m doing is I’m trying to help him be more profitable. That’s been fun to talk with his team, and, in fact, as soon as I start putting these pieces together, I want to meet with his team and show them what we’re trying to do for him in order to make him a more profitable farmer.

inthecabyieldmonitor

FRUSTRATION #3: DIFFERENT COLORS OF EQUIPMENT

RENEE HANSEN: Yeah, and what about the color of equipment with numerous different colors of equipment? Or the farmer, the grower, isn’t applying some of their inputs. Somebody else is doing it for them. How do we go about getting some of that information?

KATIE MCWHIRTER: Oh, definitely. Again, I met with another grower yesterday, and as we’re talking, sometimes they think all this information has to be captured somewhere or captured on a monitor. It has to be captured somewhere, but there are so many different pieces of information that we keep track of. I think that is a really big misconception, what data is. Some people, I’ve laughed, they think it’s a singular thing. For us, it’s a plural. I mean, so much data can be collected not necessarily on a monitor. So, putting that all together in one system, be able to look at it, to get a clear picture as far as what’s correlating yield or, more importantly, what’s driving profitability or, better yet, holding the entire operation back from being more profitable.

FRUSTRATION #4: IS A PRECISION AG SERVICE PROFITABLE 

RENEE HANSEN: Yeah, you’re talking about some of the things that they can start inputting and putting the pieces of the puzzle together. So, what’s the output? What do they get? What are we giving a grower? How is it going to benefit him?

KATIE MCWHIRTER: What it gives the grower is a clear picture of their operation as far as profitability, that return to land and management. The numbers don’t lie. I mean, I’ve always said the numbers do not lie. Take the emotion out of it, but that’s not where it stops. Essentially, it’s a continuous cycle. Don’t give me a pretty map, and that’s great, right? Don’t give me that. I need you to be able to, and our growers need us to be able to, without any bias, to say: ‘Here’s what we could do with it.’ Ultimately, it’s going to be the grower’s decision, and that’s what I was telling the grower yesterday. We’re never going to do anything that you don’t want to do, but we will challenge you as far as this is what we’re seeing in the data, and if you’re wanting to improve, it really looks like this is an area that we could focus on.

FRUSTRATION #5: FEAR OF CHANGING EVERYTHING AT ONCE

RENEE HANSEN: Yeah, something that you mentioned, Katie, was it’s a continuous cycle and how it’s never ending. You’re constantly learning. So, even at year one, there is so much that we can learn about. So, tell me, what does a grower learn at year one?

KATIE MCWHIRTER: Which is funny because, when I got back into working directly with growers, that was one of the questions that they asked me when we were first sitting down: ‘What do you think we’re going to learn this year?’ As I was getting all this data from him, and I’m like: ‘I don’t even want to take a guess.’ I have a suspicion, but I don’t want to say it out loud, but I think it was just their biggest ‘aha’ was I’ve never looked at my data like this before. I’ve seen it on the typical red, yellow, orange, three-shades-of-green map. Maybe I’ve done a little bit of comparison in some of these other platforms before, but never have I looked at it this way before. Whether that was in charts or in our data visualization tools and then, ultimately, to tie those costs back to it. Some of the things they thought, they were right, and some things they were kind of surprised, which has led to decisions. When I started with them in August, I mean, I told them I was not going to push them to anything that they didn’t want to do technology-wise. All of a sudden, we’re sitting down for our planning meeting in December. I’m like: ‘Oh my goodness. Four months ago, this is not where we were.’ I didn’t think this is where we were going, and now we’re jumping in the deep end of the pool. I don’t want you to do this and be uncomfortable. I want you very comfortable with the changes that you’re suggesting we make. That’s been fun, though, to lead people through because we all know that change is hard, and it’s very hard to get outside of our comfort zone. So, I actually start my sales training, my leadership training course, with: ‘Here’s your comfort zone, and outside of it, that’s where the magic happens.’ That’s so, so true with farmers.

premiercropyielddata_farmer

FRUSTRATION #6: DATA IS OVERWHELMING

RENEE HANSEN: I really think, and I see it too, just within our own family operation too, that sometimes you can get so comfortable diving into something new, they want to, a grower wants to get into something new, but it’s like, where do you start? How do you get started? It’s having a service, something that Premier Crop offers, something that you offer, just helping them, starting to input the information, contacting the people to get the information, knowing who to contact. So, right now in 2021, we’re at the beginning of March. Why would a grower need to get involved in something like this? Why should they wait?

KATIE MCWHIRTER: I don’t think they should wait. I think it could seem very overwhelming and don’t know where to start. It just takes that conversation to get them going. Really, I say, that’s why it’s so wonderful that we have the great group of advisors that we have to guide them through this process. We all like to be guided. We all like to know what’s next. I don’t care if it’s the program at church, the bulletin to what’s next. Or when you get on an airplane overseas, and it’s saying: ‘Here’s what’s going to happen. Then, this.’ That just puts everybody to ease and guide them along. Our advisors, it’s like we farm with them. I mean, I know I wasn’t going to go back and farm, but that love of agriculture and helping farmers, that’s our group of advisers. That’s their characteristics, their qualities. They genuinely want to help because it’s like they’re farming.

RENEE HANSEN: Thanks for listening to the Premier Podcast, where everything agronomic is economic. Please subscribe, rate and review this podcast so we can continue to provide the best precision ag and analytic results for you. To learn more about Premier Crop, visit our blog at premiercrop.com.

Learn more about the power of precision ag.

Put Your Data To Work

GPS technology has allowed growers to capture variability within a field – from yield to soils, fertility, pH, varieties, variable rate application and agronomic treatments. More than likely, you have accumulated binders full of color maps and hard drives full of files.

While collecting agronomic data is getting easier, using it to make decisions can be a challenge. Visually correlating the relationship between two maps, for example, yield vs. soils, is possible but becomes mind-numbing as you collect more data layers on dozens of fields.

Maps are a great way to visualize agronomic data, but the real power for decision making is in the data file. Organizing data layers into a georeferenced database structure allows us to tackle real-world complexity that is applied agronomy. Applied agronomy at the field level is the collision of hundreds of manageable variables – it isn’t rocket science; it is way more complex.

Premier Crop embraces this complexity with respect. We respect that all agronomy is local, and what drives yields and profitability changes year to year within areas of the country, across a grower’s operation, field by field, and in each part of a field.

After years of helping growers and advisors analyze data to drive decisions, we’re frequently asked, “What matters most agronomically?” Our answer is always the same: There is no silver bullet. It is never one specific variable that universally drives yield variation or profitability.

It’s not just plant health, variety selection, trait packages, weather impact, population, nitrogen timing, soil type, planting date, harvest date, tillage or fertility. We could go on and on.

Agronomic complexity drives many to look for simple solutions. While companies like ours continually drive to make it easier – some make “simple” solutions work only because they pretend complexity doesn’t exist.

New call-to-action

Analyzing your agronomic data is messy. Correlation doesn’t prove cause and effect. We gain confidence by seeing similar results on multiple fields across an entire operation and across thousands of anonymously and confidentially pooled acres in your area. Our experience has taught us that most growers want their agronomic advisor to help in this process. While it’s hard work, we don’t have to hit home runs to pay for the effort.

Agronomy is complex. There is no silver bullet that will drive yield and profitability. You must look at all variables across a wide range of acres when making important agronomic decisions.

Want to move beyond just looking at those pretty maps? Here are 3 questions to ask yourself to start putting your collected data to work.

  1. Dive into how you evaluate the relationship between soil test fertility/applied nutrients and yield. How do you manage your fertility program? Are there ways you could use other data – for example, yield – as part of your nutrient strategy?
  2. Do you check your previous years’ variable-rate population recommendations? How does your agronomic data explain whether the recommendations worked or not?
  3. Are you using the same seed variety as last year? Why or why not? Did you base that decision on data or a gut feeling? Think of what different variables you could look at within your data to be more informed, rather than emotional, when buying seed.

Visit our blog at www.premiercrop.com for more precision ag and data analytics resources.

Use Farm Analytics to make Improvements on your Operation

Every grower sets goals for their farming operation. Seeking high yields or decreasing costs of operation are commonly cited, but ultimately what every grower wants to know is whether or not each decision is profitable.

How do we go about doing this? Since no two fields are the same, there’s an increasing need for information generated down to the sub-field level. We can’t apply the same rule of thumb across an entire operation or we’d never gain any improvement. Some of our advisors refer to this as ‘farming by the foot’ to gain a deeper understanding of each field in order to have optimal success. By studying each foot individually, using farm analytics, we have the capability to drill down and identify each limiting factor(s) per field.

We often hear statements from grower such as:

“The home farm has been my best field for 30 years – my other fields don’t measure up.”

“I’m cutting back on input costs because it simply doesn’t pay.”

“Maybe I’ll try it – next year…”

To overcome them, we first need to break down ‘big data’ from a farm approach into a field, and even sub-field, approach – to define variability at the field level in order to make smarter, more profitable decisions. By digging into farm analytics, a grower’s ‘best’ field might turn out to be average from an economics standpoint. Comparatively, one of the lowest-yielding fields can turn into one of the best with the right management plan. Once growers start to see how much they benefit from the data they’re receiving, they start paying attention more closely.

By looking at each field individually, we develop a management plan catered solely to the field at hand. Low production areas such as sand pockets, nutrient-depleted ridges or ponding zones, are all taken into consideration with management zones. Seeding and fertilizer rates may be decreased in low production areas to save on costs while higher rates are allocated in high production zones. PCS Advisor Adam Walters commented, “It’s amazing to see growers save $12/Ac by zoning to reduce costs while at the same time boosting production.”

We often hear, “we have all this data, now what?” or “how do we get growers to implement changes?” Our goal is to get a grower to a deeper level of understanding with their data.” By interpreting the results at the field level, growers can make better decisions on field management to ideally accomplish improved profitability and efficiency.

As a farmer what are you doing to break down ‘big data’ to define variability at the field level in order to make smarter, more profitable decisions? It’s time to start using your data and farm analytics to help you profit.

New call-to-action