Premier Crop’s New ELBs Allow us to Experimentally Establish Causation

Throughout Premier Crop’s nearly 20-year history, we’ve perhaps been the most diligent at communicating that what we do – big data analysis – would be considered “observational data analysis,” which can show relationships and correlations, but stops short of providing cause and effect.

Within crop production and agronomy scientific circles, making decisions using observational data analysis has been viewed as inferior and some would argue its an informed guess.

It’s only been in the last few years, with the dynamic investments by major ag companies, that millions of yield observations have been validated as valuable in crop production decision-making. For decades, the foundation of agronomic knowledge has been the trial results from small randomized and replicated plots.

That experimental design and the statistical analysis dates back to the 1930s, analysis of variance (ANOVA) created by Sir Ronald Fisher, whom many consider the father of modern statistics. All universities and industry companies have adopted and use replicated plots as the gold standard for conducting trials and proving that change in treatment actually causes change in yield.

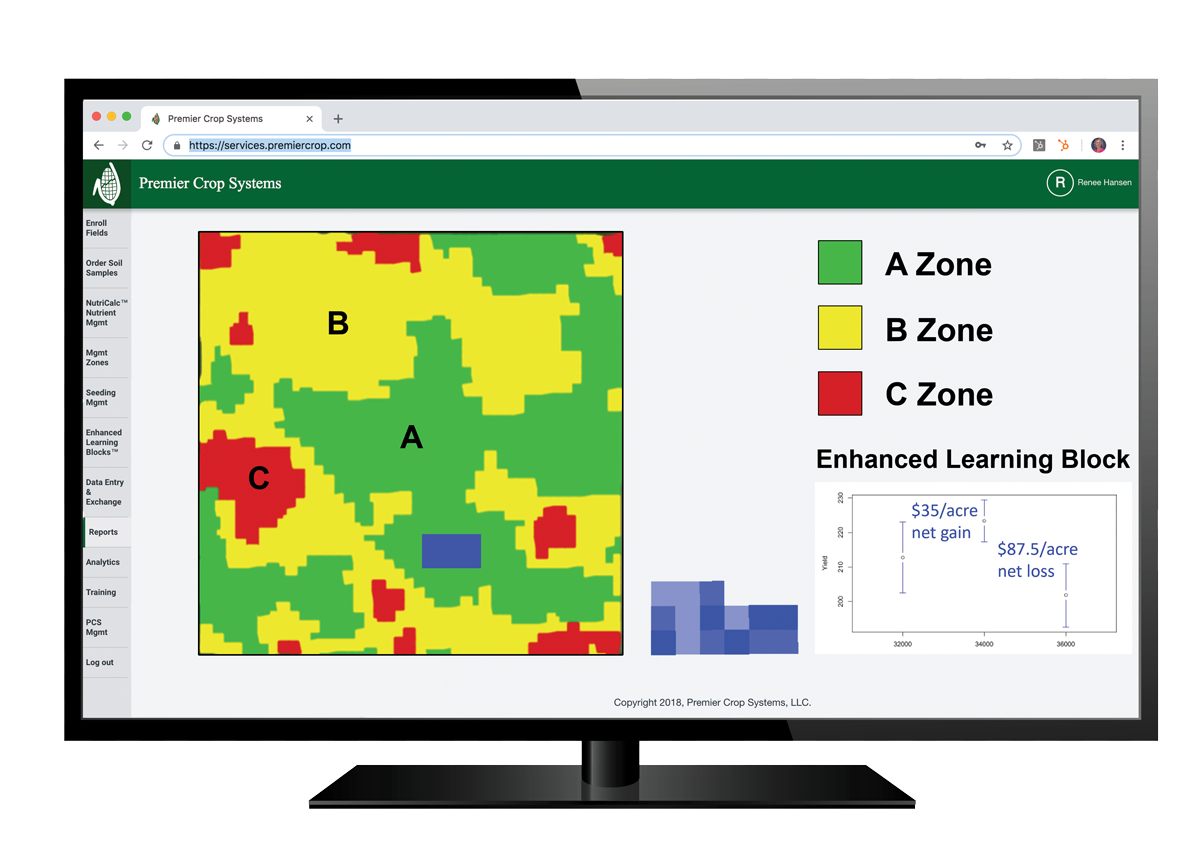
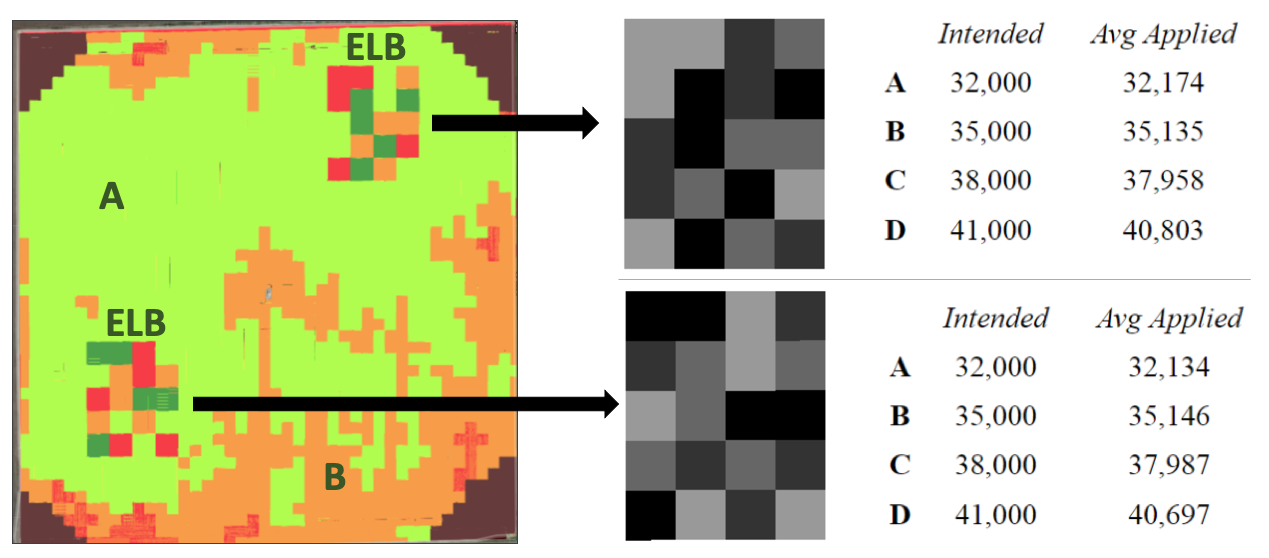
Premier Crop’s new Enhanced Learning Blocks (ELBs), built to enable randomization and replication of trials in the farmer’s own fields, allow us to move beyond correlation and experimentally establish causation.

ELBs represent a breakthrough in generating new agronomic knowledge cost-effectively, and on a much larger scale than ever before possible.

Why You Should Test Products on Your Own Farm

Why should you test products on your own farm? Your farm is unique and you have the equipment capabilities and data to conduct those trials. With little risk, you can have a more robust dataset than many companies.  I’ll explain…

It starts with grid soil sampling. Soil sample data is the foundation to understanding and analyzing yield in each part of each field and ultimately, if products or rate changes will provide a return on investment. If there is something wrong with the foundation, additional inputs generally won’t show a return.  From there, we gather information such as– variable rate nutrient information, as-applied planting data, chemicals, fungicides, insecticides, weather data, and more.  Because in the real world, there isn’t one variable. It’s important to know what your measuring stick is, and we’re different, because we use actual costs and yield to understand why products perform and where they perform best.

Often times, information provided for new products or management methods are gathered from trials averaged across geographies, which may not fit your location or your farm. Certainly, there is excellent research out there–high quality university research and independent plot research that has good information. But inevitably, products come to market and growers try new technologies, but they don’t work or they don’t work everywhere.  Why not?

We believe products work in specific places and we want to help growers find those specific places in their field. We hear this from growers all the time, “sure I’ll take a gallon of fungicide or insecticide because I want to see it, I want to try it.” You want to see the product, apply it and harvest it yourself to see how it does on YOUR field.

Most growers are capable and have technology to test products on their farm, but aren’t taking the final step of doing an in-depth of analysis. Premier Crop offers multiple testing methods including a patented scientific approach of randomized, replicated trials executed through a prescription and harvested with your own equipment. The exciting part?  You may have the technology to run these trials on your own fields.

test trials on my local farm

As a grower do you try new products or test new rates?  How do you measure if that product or methodology worked? Visually? With a weigh wagon?  Do you use a yield monitor and software to do a simple analysis?  I’m here to tell you—you can do more with what you already have, and we’re excited to work with you!

Crop Research: Evidence-based Decisions

I’m always looking for parallels – examples from other industries on how they use data to drive better decisions. While on the road, I listened to several Freakonomics podcasts. One that related well was titled Bad Medicines, Part 2: (Drug) Trials and Tribulations.

Much of the podcast discussed how human medicine is transitioning from being “eminence-based” to “evidence-based”. Eminence is where decisions are based on the advice of a distinguished expert who has a combination of practical experience and powerful communication skills (still happens in agriculture). Evidence-based decisions results from randomized and replicated trials to drive future decisions.

Some of what the medical community believed to be true has now been proven to be wrong. But even the move to doing trials has had issues.

In the late 50’s and early 60’s, a new sedative called thalidomide was introduced in much of the world as a sleep aid. What was unknown about the drug, which was given to the general population including pregnant women, was that it caused fetal deaths and serious birth defects. At the time, President John F. Kennedy praised our FDA because the drug had not yet been licensed in the U.S.

One of the results of this tragedy was a decision to exclude women (because the risk of pregnancy) from all clinical drug trials. The podcast highlighted the fact that not doing trials on 50% of the population had unintended consequences with other drugs which behaved differently because of the differences in metabolism between men and women.

One of the obvious parallels for crop production is that most agronomic trials are done on the best soils in the best parts of the best fields. Most variety trials are intentionally located on well-drained, high fertility environments – the trial design is to eliminate any variables other than genetic differences. Just as women represented a significant under-tested percentage of the population, we don’t have many trials on our less than ideal soils. Using your own data to compare varieties or treatments on your less productive soils can be more valuable than any plot book.

Another similarity between medicine and crop production trials occurs when trial protocols are tilted to situations that favor the product’s performance. In drug trials, it can be as simple as choosing younger patients with the medical condition. Younger patients, as compared to older, tend to have fewer “additional” health issues that might mask or override the drug’s effects. Crop production trials can have a similar protocol bias. Testing a nutrient enhancer in a low fertility environment or a fungicide on a hybrid with a weak disease rating can show positive results, but they might not be representative of how the product performs on your soils with your hybrids.

agriculture scientific research trials

You can use your precision ag equipment to do trials in your own fields to achieve valuable results from your most challenging soils and fields. As human medicine has moved to evidence-based decision making, one thing they discovered is that approximately 15% of the time, an established treatment has been overturned or reversed. Since medical research greatly outspends agricultural research, it will be interesting to find out how much of what we thought we know isn’t correct.

Premier Crop has developed Enhanced Learning Blocks. These scientific trials enable you to test new crop production inputs in randomized, replicated trials to identify optimal input rates for your local area with minimal risk. The scalable patent pending approach from these trials create local agronomic knowledge specific to your geography.

Best Average Rate Costs Profits

Long before GPS was part of our acronym vocabulary, my early agriculture career started in eastern Iowa and northern Illinois. On one of those scorching hot July days, as you were driving through the area, every so often the road would be higher than the fields and you could visually capture a birds-eye view of the fields below. You could see parts of the fields, where the corn was rolled up tight as the plants went in to “protection” mode – while other parts of the field look perfectly normal. Images like that help make me an advocate that managing parts of the fields differently would make agronomic and economic sense.

Now those “pictures” can be captured in detail with a drone, a plane, or a satellite and further documented with your yield file. Since 80% of the US corn and soybean crop is rain-fed, we can’t solve the problem of running low on moisture in those drought-prone parts of fields. But we can manage those areas by changing the seeding rate – spreading the plants out a few inches can provide more room for the root mass needed to maximize yield and economic returns per acre.

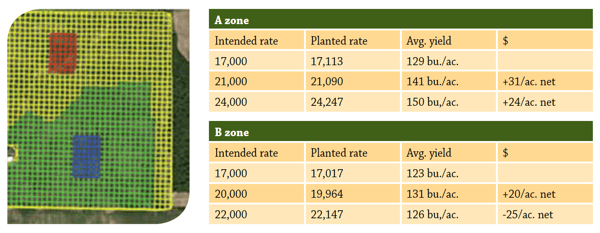
Premier Crop’s new Enhanced Learning Blocks allow users to use the equipment they have already invested in to do randomized and replicated trials. In this dryland Kansas field in 2016, two trials with 3 different planting rates and 5 replications each were conducted. In best area of the field, yields climbed as population climbed. We don’t know how high we should have gone but know that in the A zone (green), 24,000 returned $24 per acre more vs 21,000, including the additional seed investment.

But the results in the B zone (yellow) were much different.

The B zone trial mirrors results from many other 2016 trials – that pushing population too high can not only lead to lower yields but because of higher seed investment, can be very costly.

continuous learning with seeding population with on farm trials

Consider what these results suggest about farming by the best average rate. If the grower plants 20,000 – the best rate for the B zone on the entire field – the grower loses at least $25 per acre on the best half of the field. Obviously, planting 24,000 on the entire field would be even worse economically. Picking 22,000 as the best “average” rate – mid way between 20,000 and 24,000 – would results in losing $18/acre on the A zone and $25/acre on the B zone.

If you think this might be worse case, consider that as you move east in the Corn Belt, both seeding rates and yields are higher. The higher the investment (higher seed costs) and the more return (higher yields) equates to even larger benefits to getting the rate correct. The story with nutrients in the same; the ideal rate changes within the field and economic reward or penalty is dramatic. Remember the example of having one foot in ice water and the other in hot water and the suggestion of being just right on average?

Farming by averages is costing you profits! We can do better than choosing the best average rate.

Moving Beyond Correlation

Throughout Premier Crop’s nearly 20 year history, we’ve perhaps been the most diligent at communicating that what we do – big data analysis – would be considered “observational data analysis” by those in the scientific community.

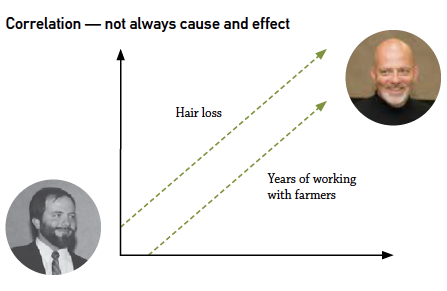
Early on, my slide deck featured this chart – a photo on the left form my earlier years versus today – to explain that observational data analysis can show us relationships and correlations. But, it stops short of proving cause and effect.

observational data analysis

Within crop production and agronomy scientific circles, making decisions using observational data analysis has been viewed as inferior and some would argue it’s an informed guess. It’s only been in the last few years, with the dramatic investment by major ag companies, that millions of yield observations have been validated as valuable in crop production decision-making.

For decades, the foundations of agronomic knowledge have been the results of small randomized replicated plots. That experimental design and the statistical design and the statistical analysis dates back to 1930’s, with Sir Ronald Fisher’s analysis of variance (ANOVA), whom many consider the father of modern statistics. All universities and industry companies have adopted and use replicated plots as the gold standard for conducting trials and proving that a change in treatment actually causes a change in yield.

Premier Crop has now added randomization and replication to our Learning Block concept with an offering we are calling Enhanced Learning Blocks. It allows us to move beyond correlation and experimentally establish causation.

on farm scientific data trials

We are now able to scientifically prove the value of using variable rate technology in a grower’s operation. And the results are dramatic. In several examples, customers with 5 replications of 4 different planting rates we are able to prove that the ideal seeding rate varied over 9,000 seeds per acre, with resulting yield results greater than 40 bushels per acre. That’s a swing of over $30/acre in seed cost and $140/acre in revenue.

The beauty of these experiments is that the technology you’ve already purchased in the cab does all the work – there is no extra work needed for this experiment. You plant, apply and harvest the experiment with the same technology used on your farm. We refer to Enhanced Learning Blocks as “knowledge creation at the speed of farming”!

Three Steps to Combine Farm Agronomics and Economics

We often use the phrase, “Everything agronomic is economic.” What does that really mean?

First, let’s first define agronomics and economics. What is agronomics? That’s everything that we do in the field related to making good management decisions. It’s deciding how much fertilizer to apply and where to put it, planting rates, crop protection, tillage systems and how to incorporate all of this into the farm. Those all go into how we grow our crop. On the economics side, we’re talking about all of the money involved in farming. Farming is a business, and just like any other business, you need to make sure you have cash flow so you have the opportunity to farm again next year, and the year after that. So, how do we focus on agronomics and economics? We do that by analyzing growers’ data. We use that knowledge to help them make decisions on their farm.

Knowing what you’ve done on the farm in the last five, 10, or 20 years can provide valuable knowledge as you plan into the future. However, if you never take that data and don’t use it to make decisions, it’s not doing you any good. It’s important to invest time into collecting your farm data. We work with growers to analyze their collected field data. We add costs to the layers of data including product cost, operations cost, management cost if they have any land-specific cost, and tie that to the yield file so we can see what is making agronomic and economic sense on the farm.

It’s fairly easy to tell where there are higher yields, but it’s a lot harder to know if that yield increase also caused an increase in the pocket book. Did the decision pay for itself? Did you produce enough bushels to offset the cost of production? Every pass across the field matters agronomically, but it also has a cost associated with it. We give you three steps to help combine your farm agronomics and economics below.

1. PLANTING

When you’re preparing to plant, your seed has the highest yield potential it’s ever going to have. Everything we do at Premier Crop is aligned with protecting yield potential, and planting population is a big aspect of this. If you overcrowd the plants, you’re going to make them compete for resources, which will end up reducing your yields. On the flip side, if you have too low of a population, then you’re reducing your yield potential by not having enough in the first place. You can’t produce more bushels of corn if you never plant the seed to begin with.

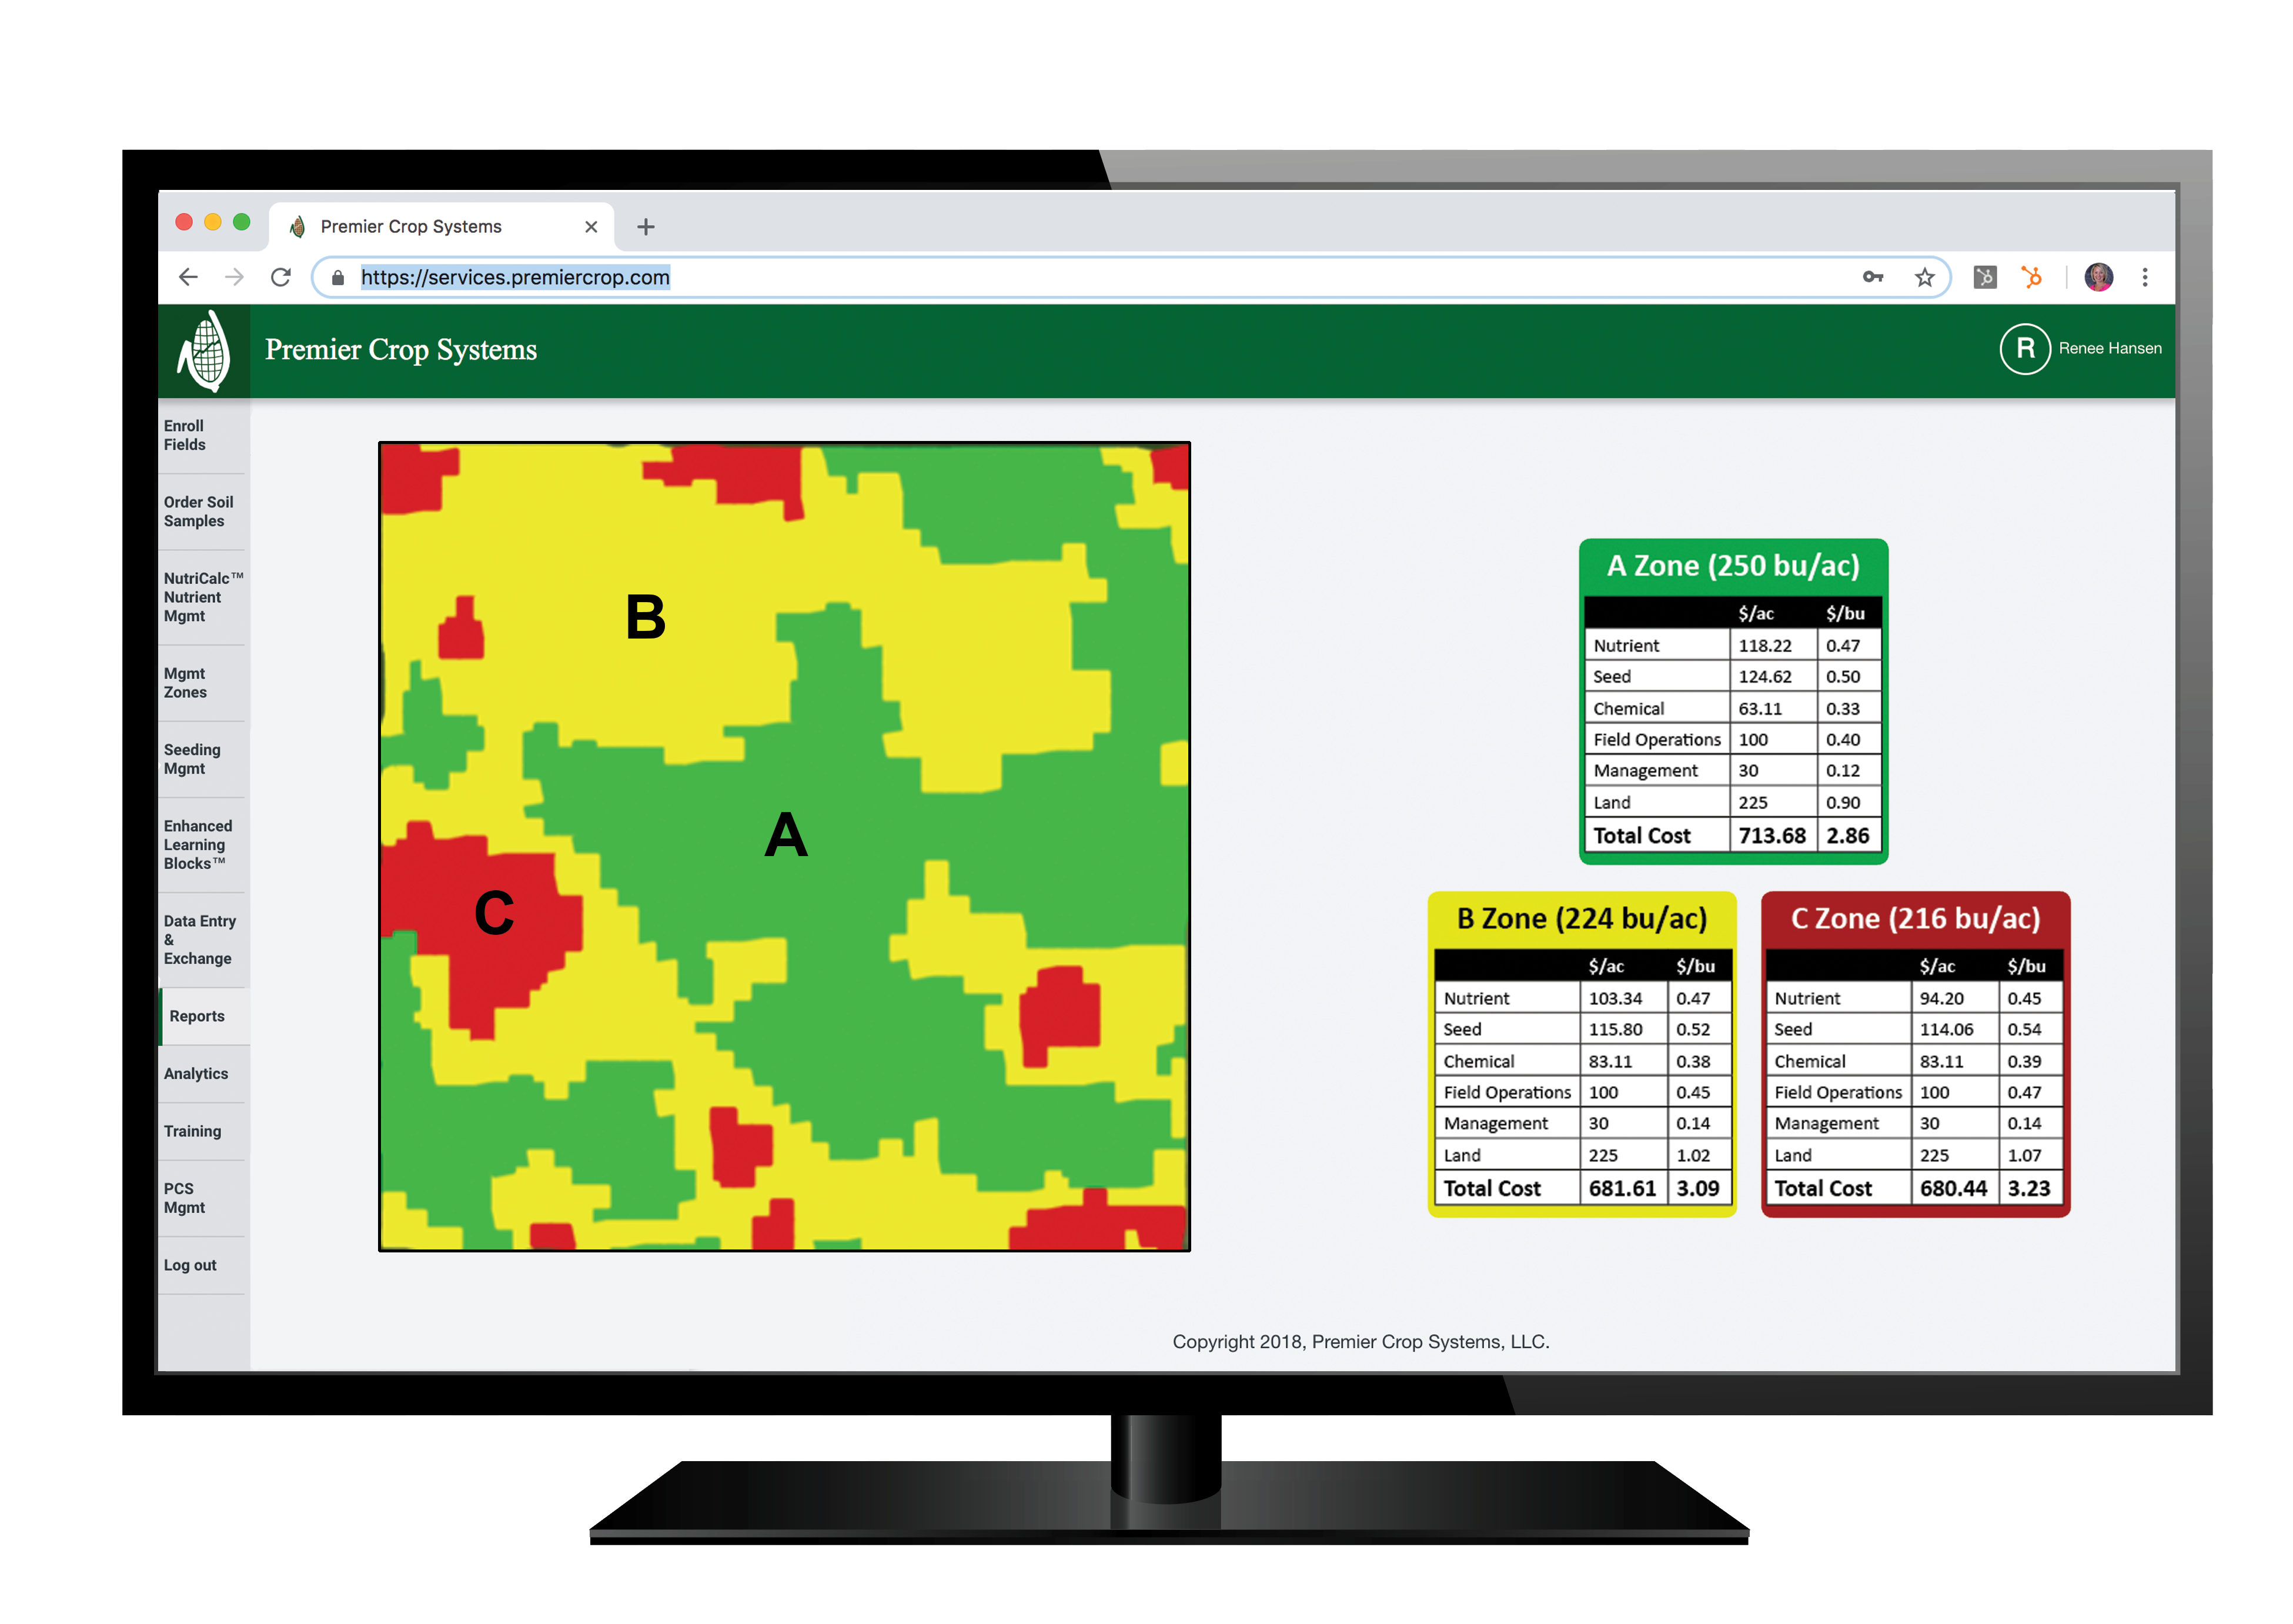
Combining agronomics and economics is about finding the right rate for the right part of the field, which we accomplish with management zones. A management zone is not just a seeding rate like it is with many other precision ag companies. We manage the field and the operation off of the zones. We break fields into high-producing areas, which are A zones, average-producing areas, which are B zones, and lower-producing areas, which are C zones. The B zones are the types of areas that do pretty well year in and year out, but they don’t have the capability to be the highest producing areas of the field. Our C zones could look like a wet spot, an area shaded by trees, or a family of deer could live nearby and eat it all the time. We manage nearly everything based on these zones.
premiercroppbreakevencostperbushel

In the A zones, our high-producing areas, we push planting populations. We plant more seeds in these areas because these parts of the fields have the capability to produce more bushels. In the C zones, we’re going to pull back our population because we know those spots just simply don’t have the yield potential. By labeling it as a C zone and understanding that it is not going to produce as well, we can manage risk by lowering the planting population. This practice will save money on seed costs in this part of the field because by lowering the population, we have reduced seed cost, which helps the bottom line. However, if we can get part of the field from a C zone to a B zone, or from a B zone to an A zone with fertilizer or any management practice, we will go after that to increase our return to land and management, what we call yield efficiency.

2. FERTILIZER

When variable-rate technologies first came out, the discussion was: “It’s going to save you money and reduce your fertilizer usage.” We found that’s not always the case, though. Instead, grower’s are making better decisions with their planting or fertilizer dollars. They are putting those dollars in the areas of the field where it’s needed and where they can get a return on their investment. We are driving farming towards thinking more on the economic side of the business.

In general with farming, if you’re doing a straight rate across the field, you’re essentially treating every acre the same. We know that every acre is not the same because when you’re harvesting, even if you don’t use a yield monitor, you can see variation in the amount of loads you’re taking off. You can tell how good or bad the corn is as you’re driving across the field. So, why would you treat your inputs the same if you’re not taking the same amount off of it at the end of the day? That’s why it’s so important to tie the economics to planting, and fertilizer. That is where the real benefit lies.

Even if you are locked in on your planting populations, placing different checks in a field through different years allows you to gather historical data and be able to check and say: “In this year, if we’re looking at a cold, wet spring, this is the best population to go with.” Even if we don’t use that specific data in the next year, we are still collecting it for future years.

It is also important to factor in your planting population when you’re determining your nitrogen rates. We often use the example: If you invite more plants to dinner, you have to have enough food to feed them. We could apply a straight rate, but we’re going to be overfeeding the poor-production areas and underfeeding the high-production areas. So, if you have a higher population in the A zones, you need to account for the added food they’re going to need. We can also push the nitrogen rates a little higher in the A zones because we have the capability to produce more bushels, not just because of the higher population but just because the ground is better. By pushing that, you’re taking a little bit more risk, but it’s a smart risk.

3. ANALYTICS

To get started looking at a grower’s analytics, we first pull yield monitor data. Then we look at everything the grower has done throughout the year, whether it’s fertilizer, lime, planting, nutrients, or crop protection products. We dig in and see what the economic benefit was. When planting, did we build small test plots into the planting maps for our growers called Learning Blocks. We then use the information from our all of our data within a management zone to see if we have the right rate. Learning Blocks not only show us what produces the highest yield, but it also shows which population provides the greatest return on investment. Once the prescription is in a grower’s monitor, they can just focus on farming. It’s very little thinking on a grower’s part because we’re constantly constantly checking our work.  It is important that we prove what we’re doing is the best option possible.
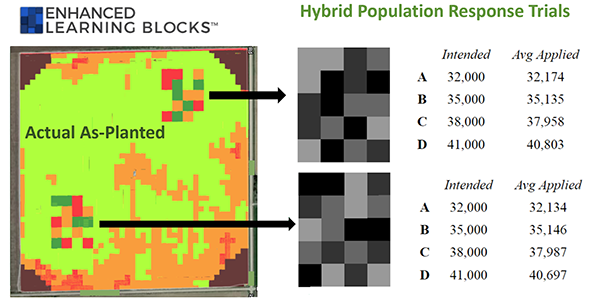
premiercropgrowerseedingtrials

The analytics is where the magic happens. Not many companies look at what happened after harvest. Premier Crop uses our platform to make informed decisions based on what the growers data is proving through on-farm trials, Learning Blocks and Enhanced Learning Blocks to provide statical confidence to help the grower see their profit.


Not every operation has the same goals and not everyone sets out to produce the max amount of bushels. It’s a “do it and check” process. We go out and do something, we check our work, and then we make corrections for the next year. As a grower, you’re always busy. You are going from one thing to the next, and there’s always something to do. Going through the data can be a tedious task that leaves you feeling like your time would’ve been better spent elsewhere. The benefit of working with a Premier Crop Advisor is that we retrieve the data, clean it up, and enter it into the system. A grower just needs to hit “record” when they’re running through the field.

Want to learn how you can work with an Agronomic Advisor to start making agronomic decisions based on your economics? Contact us to schedule a demo today.

Learn more about the farm profitability.

Response to Fungicide: It Varies

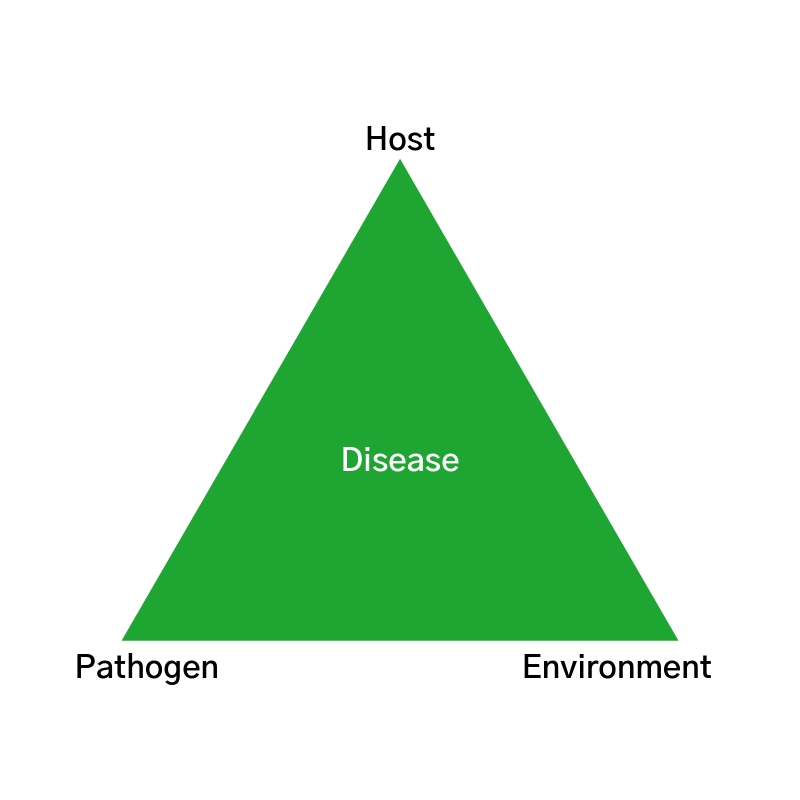
You don’t have to look very hard to find chemical manufacturers’ advertisements claiming a significant positive yield response (15, 20, 25+ bu./ac) to using one of their fungicide products. There are many effective products on the market that provide good control and protection against fungal pathogens, but advertisement claims based on ‘average trial data’ aren’t guarantees for your fields. Three critical components (a host, favorable environment, and pathogen) must come together at the same time for a plant disease to thrive. These three components are commonly referred to as the Plant Disease Triangle. Management or alteration of just one of these components prevents or reduces disease severity.


diseaseHost

It’s important to refer back to the Plant Disease Triangle when gauging the need for fungicide application, as well as past local trial results and current crop economic conditions. How do environmental conditions within the field (soil pH, fertility levels, applied nutrients, etc.) affect the vulnerability of the host (corn or soybean plant) as it relates to disease pressures? Is a pH imbalance affecting nutrient uptake, which in turn makes this specific hybrid more susceptible to fungal disease pressure? Does it make sense, economically, to apply fungicide to lower productivity areas within fields? Variability exists in all fields and managing the yield-limiting factors is what will show a yield response come harvest. Agronomy is complex and agronomy is local. Yield response to fungicide fluctuates within each field based on the interactions of many variables, which are all part of the disease triangle. Conducting on-farm fungicide trials generates more agronomic knowledge related to this complex interaction, which improves decision making for future applications.

Being able to use my family’s farm as a ‘testing ground’ makes working with the solutions Premier Crop provides to our partners even more enjoyable. I am able to experience first-hand what many of our partners and advisors put into practice each and every day. Last year I placed a few fungicide Enhanced Learning Blocks (ELBs) in one of our fields to test the effectiveness of a popular fungicide product. An Enhanced Learning Block is a randomized, replicated trial of different rates, products or application timings. ELBs provide a formal testing environment within a field to determine whether or not the treatment had a statistically significant impact on yield.

Trials were setup to be an on/off scenario – 20 gal/ac and 0 gal/ac each replicated 6 times within the trial area (ELB). Two of the ELBs were placed within the same hybrid – one on heavier soil and the other about 800 feet away in lighter soil on a hill. The product was applied at R1 with a Hagie sprayer. Prior to application we had been receiving ample rainfall, so we anticipated potentially higher fungal disease pressure, however that was not the case.

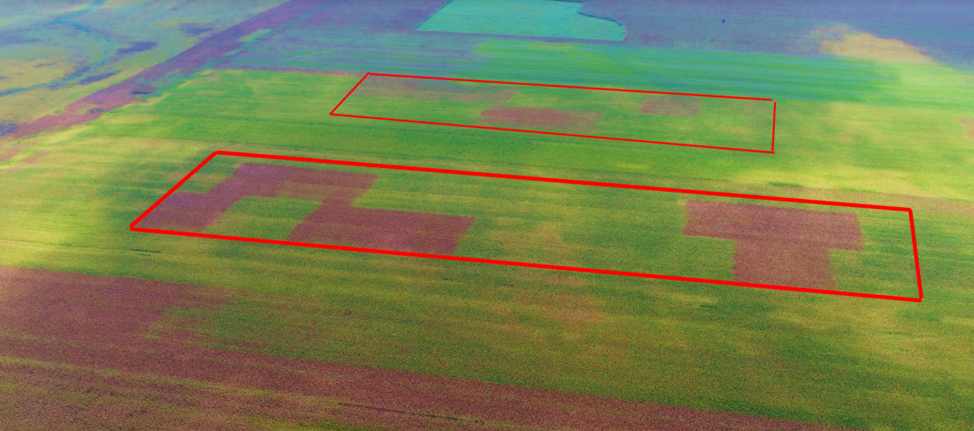
The image below was taken with a drone about one month after application. You can easily see the replicates in the trial area that did not receive any product. Based on the image what do you estimate the yield difference to be between the treated and non-treated rates? What would an imagery solution come up with for a yield difference based off their algorithm calculating yield from NDVI?

fungicide_ELB

As we were harvesting this field we could see the location of the fungicide trials as we worked towards them. While combining in the trials the difference in plant structure was obvious – the tops of the corn plants in the untreated replicates had all broken off. Both the drone image and visual observations at harvest pointed to a significant yield response to fungicide in both trials.

When I received the Enhanced Learning Block trial report I was a bit surprised with the actual results – visual observations are deceiving! One trial had a 1 bu/a yield response and the other was 8 bu/a. I was expecting at least a 15 bushel difference.

#1 – lower ground, heavier soil.

#2 – higher ground, lighter soil.

Why did the trial results end up this way? I have some ideas, but no definite answers. Likely the yield response shown in the trial on lighter soil was due to the treated plants’ improved ability to withstand late-season moisture stress, which wasn’t a yield-limiting factor in the heavier soil environment. What I do know is that a 1 bu/a response didn’t come close to paying for the product and application costs, and an 8 bu/a response was likely a little better than break-even. Understanding when, where, and to what degree these products work will allow for better utilization (spatial application), ultimately increasing ROI.

Are we going to spatially apply our fungicide next year? Probably not. Are we going to continue to conduct on-farm trials and Enhanced Learning Blocks to learn more about when, where, and how well fungicides work? Definitely. With the power of local agronomic knowledge, I don’t think it will be too long before spatial application of fungicide becomes a normal practice in crop production.