Intuition Doesn’t Match Data

I’m a big believer in the practice of split-applying nitrogen – specifically sidedress – applying a portion of the nitrogen after planting. Being able to apply part of the nitrogen closer to plant uptake always made sense to me because the nitrogen is less available for loss before that time. However, oftentimes it is difficult to find the advantage of sidedressing in the data.

It can drive me crazy having access to millions of acres of data and not have the data to confirm something I believe! Or worse yet, show the exact opposite! For example there have only been plenty of years when fall-applied nitrogen appeared to do as well, if not better, than spring- or split-applied.

Here are some of the lessons I’ve learned over the years. First, there can be “selectional bias” in the data. For example, growers select their heavier soils for fall applications for agronomic reasons – ability to hold ammonium nitrogen. Likewise, they might choose their lighter soils for side dressing. Simply comparing yield by nitrogen timing and lead to a wrong conclusion. Looking at nitrogen timing by soil type can be an obvious next step for correcting selectional bias.

A second reason that sidedressing might not show up in analysis as being superior in data analysis is due to the fact that nitrogen applications might not be the yield-limiting factor! If applied nitrogen is not what’s yield-limiting, then timing of application won’t likely matter or show up in data analysis. In much of the high organic matter portions of the U.S. Corn Belt, university researchers estimate that 50% to 70% of the nitrogen that feeds the plant is soil-supplied and not fertilizer-supplied. It’s no wonder there are years when the relationship between applied nitrogen – regardless of timing – and yield is insignificant.

yield limiting nitrogen applications

The last reason is the one I hate – it’s that I could just be wrong. When believing so strongly in a concept, it’s very difficult to consider that you have it wrong. But I’ve been there with sidedress nitrogen applications. From the data, the best explanation is that there are years when, in some areas we don’t get enough rain after the sidedress nitrogen application to move that newly applied nitrogen to the root zone. In those drier years, the top of the soil profile is dried out and the plant is feeding deeper. You’ve all been to a field day where someone uses a backhoe to do a “root dig” to illustrate this point. You may have walked away with a mental note that what is below ground is bigger than what is above.

What do you do when data analysis doesn’t support your own theory? For me the first answer is to keep digging in the data. I’m sill a believer in split-applying nitrogen – including sidedressing a portion – but living through those dry summers would lead me to get the work done early. My second answer is to focus on pounds of applied nitrogen per bushel. Can I produce the same or more with less applied nitrogen by altering timing?

Got Data?

1. What are some of your theories or beliefs that are not showing up in your data? Can you dig any deeper

2. How might you weather-proof your nitrogen program? How might your data help in the process?

Best Average Rate Costs Profits

Long before GPS was part of our acronym vocabulary, my early agriculture career started in eastern Iowa and northern Illinois. On one of those scorching hot July days, as you were driving through the area, every so often the road would be higher than the fields and you could visually capture a birds-eye view of the fields below. You could see parts of the fields, where the corn was rolled up tight as the plants went in to “protection” mode – while other parts of the field look perfectly normal. Images like that help make me an advocate that managing parts of the fields differently would make agronomic and economic sense.

Now those “pictures” can be captured in detail with a drone, a plane, or a satellite and further documented with your yield file. Since 80% of the US corn and soybean crop is rain-fed, we can’t solve the problem of running low on moisture in those drought-prone parts of fields. But we can manage those areas by changing the seeding rate – spreading the plants out a few inches can provide more room for the root mass needed to maximize yield and economic returns per acre.

Premier Crop’s new Enhanced Learning Blocks allow users to use the equipment they have already invested in to do randomized and replicated trials. In this dryland Kansas field in 2016, two trials with 3 different planting rates and 5 replications each were conducted. In best area of the field, yields climbed as population climbed. We don’t know how high we should have gone but know that in the A zone (green), 24,000 returned $24 per acre more vs 21,000, including the additional seed investment.

But the results in the B zone (yellow) were much different.

The B zone trial mirrors results from many other 2016 trials – that pushing population too high can not only lead to lower yields but because of higher seed investment, can be very costly.

continuous learning with seeding population with on farm trials

Consider what these results suggest about farming by the best average rate. If the grower plants 20,000 – the best rate for the B zone on the entire field – the grower loses at least $25 per acre on the best half of the field. Obviously, planting 24,000 on the entire field would be even worse economically. Picking 22,000 as the best “average” rate – mid way between 20,000 and 24,000 – would results in losing $18/acre on the A zone and $25/acre on the B zone.

If you think this might be worse case, consider that as you move east in the Corn Belt, both seeding rates and yields are higher. The higher the investment (higher seed costs) and the more return (higher yields) equates to even larger benefits to getting the rate correct. The story with nutrients in the same; the ideal rate changes within the field and economic reward or penalty is dramatic. Remember the example of having one foot in ice water and the other in hot water and the suggestion of being just right on average?

Farming by averages is costing you profits! We can do better than choosing the best average rate.

Does Variable Rate Anything Pay?

Difficult economic times tend to bring out skepticism or at least a review of current practices. Recently I was asked “Do variable rate applications of any crop input really pay?” To some it might be surprising that 20 plus years after variable rate technology was first brought to the market, there are still so many that haven’t “bought in” to the concept.

It doesn’t surprise me though. As we grow into new markets, it’s very common to find virtually no one is doing any variable rate applications – not lime, not phosphorus or potassium, not nitrogen, not seeding or crop protection products. Reality is, across the country there are by far more flat rate applications of crop inputs than variable rate applications. It’s not really hat hard to figure out why this is the case. Flat rate applications are easy – no files to move, no prescriptions to create and a shorter discussion for an input supplier to get the order.

In some parts of the country, growers that used to variable rate crop input no longer do. When you ask these growers why they quit – frequently the answer is “I didn’t know if it paid.”

does variable rate pay use learning blocks to find out

But all that has changed. Using your yield file, you can now quantify results and answer the did-it-pay question. Since 2005, we’ve been checking our work with our trademark Learning Blocks and we have proved, and continue to prove every year, that variable rate applications frequently pay. It’s not 100% but given the complexity of our modern crop production the results from millions of acres are amazing. In this example, the grower used Learning Blocks as a low-risk way to test whether the nitrogen prescription was correct.

Our experience has been that growers love the Learning Block concept. They love the idea of advisors who are willing to check their work. Still today, that is uncommon. With regard to most variable rate prescriptions sold today there is no validation of the results. Rather, growers are sold a prescription for a crop input and told that a model or algorithm is so sophisticated that it just works. But without a check area of higher or lower treatment to compare to the prescription rate, there isn’t any way to know if it worked.

Back to the Basics

I have never liked the warning “you don’t get a second chance to make a first impression.” It always seems to futile and irreversible. But one example that I encounter frequently relates to how variable rate applications were first positioned by the ag input industry. Years ago, when GPS was first allowing us to measure differences within fields and variable rate controller technology was being pioneered, the value proposition presented to most growers was “this will save you money.”

With the exception of variable rate applications of lime, that first value proposition seldom proved to be true. And because the “save you money” value wan’t obvious to growers, some growers gave up and reverted to straight rate applications of all inputs. At Premier Crop, we seldom talk about saving growers’ money on inputs. We realize that what we might save on one part of a field, we’ll likely spend on another part. It’s not about saving money. It’s about maximizing profit; being more efficient in how we invest all input dollars.

But that exception – variable rate application of lime – can be extremely significant in many areas and it’s worth exploring why it frequently saves so much. At some point in our farming history, most of us have seen this chart illustrating the relationship between soil pH and nutrient availability. Phosphorus (P) is a primary nutrient and a significant annual investment for most growers. Focus specifically on how phosphorus availability is influenced by pH. When I talk about why growers should know and pay attention to pH, I start with “P” availability. Correcting low pH’s helps unlock soil “P” reserves for the growing crop.

nutrient availability by soil phBut there are at least three other reasons variable rate lime applications make sense. In many parts of the country, fields also have high pH areas. Applying a flat rate of two tons of lime on a field that has any high pH soils, makes a bad agronomic situation worse as phosphorus availability is just as adversely affected on high pH’s as it is with low pH’s.

Another reason that is seldom talked about is organic matter mineralization. The bacteria that are needed for mineralization cycle aren’t active in low pH’s. Correcting pH can keep the soil’s natural nitrogen engine working well.

The third reason is an old one made new again. As we start to embrace IPM practices – crop rotations, herbicide rotations, cultural practices, etc. – to deal with weed resistance, soil applied herbicides will be part of the solution. And some of the most effective products have pH interactions, including carryover to other crops in your rotation. How will your advisors make the best recommendation without a pH map of each of your field?

There are many reasons to variable rate apply lime, but you can’t consider them without an accurate geo-referenced soil sample. It’s a great way to get started and the savings in lime cost by only treating the low pH acres will more than pay for the cost of the soil sample!

Discover Agronomic Synergies

Is it possible that 3 and 2 can equal more than 5? That’s the concept of synergy – when the “whole equals more than the sum of the parts”. Within our company, we talk a lot about agronomic synergies. We see it in data analysis and we believe that discovering and capitalizing on agronomic synergies is an exciting part of our future in using data to make better decisions.

Listen to Dr. Scott Murrell, director of International Plant Nutrition Institute, talk about nutrient research. “Most of the studies I read look at plant responses to one nutrient, and of those, nitrogen (N) gets most of the attention. But occasionally, more accurately, rarely, I come across a study that looks at two or more nutrients.” He goes on to cite two studies.

premiercropblog_IPNI_nitrogen_kansaspremiercropblog_IPNI_nitrogen_ohio


Both are great examples of the power of agronomic synergies.

Because nitrogen gets the most attention, our customers have been using their data to refine their N rates from our beginning in 1999. Any deep dive into their data reveals what appears to be the “right” rate that differs dramatically within parts of fields. One of the earliest realizations we had is just how fundamentally “wrong” our historic approaches had been. Remember the old formula – 1.2# of N per bushel of yield goal less credits for manure, legumes, and other sources of applied N.

premiercropblog_totalnitrogenratebyorganicmatter

Using that approach would lead us to put more applied nitrogen on our best and frequently highest organic matter soils because they have the highest yield potential. But our finding years ago, showed that our best soils have more ability to furnish soil-supplied N from mineralization than our lighter soils. The data would show that we actually need more applied N per bushel produced on our lighter soils than our best soils.

But even that statement is a generalization that captures only one (yield by organic matter by applied rate) of the many synergies that are part of the nitrogen puzzle. We’re excited to empower growers and advisors to discover and capture all the other agronomic synergies that are waiting to be unlocked in their fields and their data!!

Our goal is to make 3 and 2 turn into 32 = 9!!!

Learn more about variable rate farming.

Success in VR Seeding

I try very hard to not fall in the trap of “geek” talk. It’s a special challenge, as we are a company full of geeks! Even though we hire a lot of “normal” people, within a year we typically convert them into farming geeks/nerds. They still look normal, but they aren’t. I describe what we do as the collision of agronomy and technology. It’s the technology side that leads us to becoming geeks.

One word I’ve tried so avoid overusing is “spatial” – rhymes with racial – defined as relating to space and the relationship of objects within it. Precision ag tools allow us to map spatial differences within a field; yields and fertility are common examples. For many, maps have been a powerful way to visualize the spatial variability that exists in most fields. For some, these maps confirm that we’ve always known to exist – significant differences within fields. For almost a decade, Premier Crop and our customers have experienced terrific success in creating value for growers with variable-rate seeding prescriptions. Our process is simple. Create management zones by identifying the best part of the field, where you want to be more aggressive (A zones). C zones or other lower letter zones are usually used for lower-yielding areas, where being more conservative with seeding rates might be warranted. B zones end up with the “average” part of the field – neither great nor limited.

premiercropblog_variablerateseeding_managementzone_population-1

Now with millions of acres successfully and profitably variable-rate seeds, one observation worth sharing is that is is very rare to a management zone to run in a straight line from one end of a field to the other. This management zone map is the rule, not the exception.

In our company’s early years, we did plenary of strip trial approaches where treatments and checks ran across the entire field. But we came to understand that most strip trials are running treatments across tremendous spatial variability, which is frequently ignored in the analysis. Averaging the results for treatment strips and ignoring the effect of spatial differences tends to mask what is really happening. Gains in the A zones can be “averaged” down by the results from C and D zones.

For many, analyzing variable-rate planting with strip trials has resulted in conclusions that aren’t positive for the practice. Our results and experiences have been the opposite. Using higher and lower Learning Blocks within management zones and analyzing yield results has led to even faster adoption.

How to Use Management Zones

Management Zones are defined as, similar agronomic areas in a field that are created from a combination of layers. These similar agronomic areas can be used to manage inputs and data to analyze better efficiency and return on investment to your farm.  At Premier Crop we offer a user-friendly way to bring these layers together in one platform and help you make confident decisions from your data.

Create Zones – How you create zones depends how you intend to use the zone once it is created. There are many valuable data layers, the more layers and confidence you have, the better the zone and more useful it will be. If you are new to data management and have not collected many data layers, a few simple layers such as soil test attributes, one to two years of yield data, and even a NDVI image can get you started. As you build data layers such as yield and soil fertility you can start defining management zones to be more accurate. The more history you have the more refined the management zone will be to give you more confidence for variable rate prescriptions such as planting and fertility.

get started with management zones

Using Management Zones –   Management zones have been the catalyst in creating yield synergy across hundreds of thousands of acres in our system. Yield synergy is defined as applying the right rate of multiple products to achieve a higher return in specific parts of the field, rather than applying more or less of one product at one rate on a whole field. Developing the right rates is calculated by incorporating your management zones into all of your prescriptions. Each zone will have a specific calculated rate per product to be applied based on its productivity. If we know that you have a high yield environment, we have proven with our replicated randomized trials, called Enhanced Learning Blocks, that we can increase fertility, population, and crop protection products in these areas to push that environment to a higher yield. We also have experienced in lower producing zones, not only a savings on input costs, but also yield increases due to less plant crowding with lower plant population and better use of fertility management. Now that is a huge win for your bottom line!

create yield profit from management zones

Analysis:  This is where Premier Crop is different because we analyze how your management zones and prescriptions performed. We prove if the products, population and rates were profitable. Management zones can have little value if you don’t have a good platform to analyze them.  Once you build your zones, Premier Crop can take a deep dive to understand how each zone is delivering value across your field and your farm. Our management zone reports can identify what variables are affecting yield and profitability, we prove if the rates worked. Premier Crop generates an easy-to-read report that shows what you did in each zone agronomically and how yield responded. We then break it down to see what the top correlating factors are in each zone to identify what we can continue to improve. Utilizing Premier Crop’s cost/bu analysis per zone helps you understand your field’s true ROI and prove that by increasing or decreasing input dollars in the right areas of the field can make you more margin.

corn cost per bushel by management zones

Management Zones can provide great value to your operation when created, implemented and analyzed correctly. Premier Crop Systems platform is built to meet any grower where they are to create management zones using their data.  Whether you have years of data, or a 60-year-old soil map, we can help you be more profitable. Don’t get stuck using a system that can’t provide analysis of its work or prove your results. Premier Crop Systems is proud to be your partner on your path to higher profits.

Verifying In-Season Applications and Profits

“With alternative things like fungicide, you definitely want to see if that’s paying for itself. Historically, the InSiteCDM program is showing every year that it pays for itself. With that knowledge, it makes you more willing to spend the money to put on a fungicide. You wonder, should I or shouldn’t I do it? But when you look at the data, you’ll know if it works.” – Shaun Wolf, 

do in season applications pay


In a recent podcast episode our guest speaker Pat Mai, from our Partner InSiteCDM, interviewed grower Shaun Wolf who farms in northwest, IA. 

PAT MAI: Pat Mai is an InSite CDM Account Manager for Ag Partners. I am in charge of the western territory of Ag Partners. I mainly do CDM management. I help set up zones. I help make recommendations for seed and fertility, according to those zones. I query data for guys who have questions that are in the program.

SHAUN WOLF: I’m Shaun Wolf. I farm in Northwest Iowa. Last fall, Pat approached me to sign up for the program, and we signed up. It’s the first year and, so far, it’s going well.

PAT MAI: Shaun, what are some of the benefits of recording in-season application?

SHAUN WOLF: Certain products and practices perform better than others. If you have any crop injury, you have everything documented in your records. It helps me remember, all season long, what has been done come fall. Everything you’ve done all season long is documented and easy to access.

PAT MAI: What do you think of the use of precision ag as a service?

SHAUN WOLF: It helps me determine how much I can put into my inputs while getting the best return on investments. They have a program to take all your production data in one area and tailor a program suited for you, instead of taking broad data from around the country and trying to apply it to your farm.

PAT MAI: You get some local answers instead of out-of-state stuff. Well, Shaun, how does farm analytics help you identify problem areas and improve them?

SHAUN WOLF: They help break down your operation farm by farm. They help find problem areas and resolve issues. If you have consistent low-yielding areas, they help determine the cause and hopefully improve it. If you can’t improve it, you can put that area in a CRP or lower your populations to get your best return on it.

PAT MAI: Or you can take your above average ground and push that harder to improve that. It doesn’t necessarily have to be your worst ground. We’ve been doing some ELBs (Enhanced Learning Blocks) and running some NexGen recommendations for nitrogen. Where do you think that can take us in the future?

SHAUN WOLF: You can measure how hard to push populations in your A zones and how far you can drop your population in your poor zones before you see a yield reduction. It’s just trying to maximize each acre and get the full potential out of it.

PAT MAI: With these new hybrids coming out, we can learn where the right population is for each zone, with your ELBs.

SHAUN WOLF: Right. And you can place certain hybrids in different areas to perform better.

PAT MAI: How do you think agricultural technology can make your farm more efficient?

SHAUN WOLF: It reduces the chance of skips in the field. Pat showed me he hasn’t skipped when he’s planting. There’s less time spent in the field, which saves fuel and labor fatigue. You can produce more while using less inputs and improving your yields. It just all around makes your operation more efficient.

PAT MAI: What have you learned from precision ag and how has it benefited your farm profit?

SHAUN WOLF: This is the first year for the InSite program. It’s looking to increase yields by pushing populations in your better areas and border populations to get the best return on investment there. You can save a little seed in the poor areas, increase your fertilizer in your better areas and just learn how to maximize.

PAT MAI: How do you work with your advisor to develop a crop plan?

SHAUN WOLF: First, we give all our yield history to create zones. And then from that, we create our planting population maps, rate maps and fertilizer recs.

PAT MAI: Yeah, I took your zones, made them and brought them back to you. Then you tweaked them and told me if I was right or wrong.

SHAUN WOLF: Well, as the farmer, we know our ground better than, let’s say, Pat. He just comes and sees what’s on the computer. But we’re out farming the ground every year. So we know the farms. We might have a better understanding of what’s doing what, if it’s a wet spot or a sandy area.

PAT MAI: It could have been a hybrid failure one year or green snap.

SHAUN WOLF: Yep. So, yield data doesn’t necessarily tell you everything. It gives you a broad idea, but it may not be accurate every year, if you had an issue. And that’s what helps. Instead of just saying, here’s your recs and good luck, we can work with them and tailor it to what you think is best.

PAT MAI: We don’t have to waste one year of trial and error learning the ground. Since his grandpa’s been farming and his dad and now him, there are 70 years of knowledge there. Let’s utilize it.

SHAUN WOLF: When Pat and Clint approached me, it just made sense. We’ve had all this yield data compiled and nowhere to go with it. With data, if you don’t have a place to utilize it and put it to work for you, there’s really no point in having it. Doing a soil test, we’re operating our fertilizer, but we haven’t yet railroaded too much with our planting. But I think this will really take it to the next level. Especially with this farm economy the way it is, you need to be as efficient as possible. Then also with our cost tracking, worked out farm by farm, you get a better understanding of where you’re at for break-even to get the best return on investment. You can’t afford to be losing money where things are now.

PAT MAI: We ran some cost tracking modeling on a couple of his fields to see if it was beneficial to keep the rotation or switch to a corn-on-corn rotation. Just with the pricing and marketing of it, that’s an added benefit to help make those decisions before you actually get it into the ground.

SHAUN WOLF: At the time, it probably was wise to do corn-on-corn. But then, obviously, this COVID-19 came and things changed again. It’s an ever-changing market. I do all our own spraying and, so when I’m spraying herbicide and fungicide, it’s all documented: day, time, temperature, wind speed. I really didn’t do anything with it. I just had it for my record keeping. Obviously, the fungicide and herbicide will probably overlay with our harvest maps and see if there was a response. If we didn’t leave some strips, maybe we compare herbicide-wise. If there’s a crop injury, we have it documented. If things didn’t perform like they were supposed to, you have it documented. With your alternative things like fungicide, you definitely want to see if that’s paying for itself. Obviously, every season’s going to be different but, historically, the InSite CDM program is showing every year that it pays for itself. So, with that knowledge, it makes you more willing to spend the money to put a fungicide on. You wonder, should I do it or shouldn’t do it? But then you pass it up and lose out on yield.

PAT MAI: And you’re trying other types of fungicides or other trials with other companies that were recording. We can do validation reports on it to help verify that it’s working. If you’re splitting a 40-acre field and doing half and half, or doing certain seed treatments or graphite on seed, it helps keep that all straight and documented to actually see if it’s working and paying.

SHAUN WOLF: Yeah, I’m doing a Compass Minerals trial. They have a seed treatment. It’s basically a talc you throw in the planter. Nothing real crazy about it. You just treat it as you normally would for your talc or graphite. And then, in-season with the herbicide pass, there’s a foliar treatment to put in. And then, late-season, we put a fungicide on the corn ground. Another foliar treatment is put on, and it’s all on the same acres.

PAT MAI: We’re running it through CDM, and we can kick out a validate report. And it’ll break it up by soil type, fertility levels, which hybrid it is. I mean, it gives you a base of data underneath to see if it is that stuff or what’s actually helping it. With the plan, we’ll just watch what we did this year, what we learned from it and if we like it. And then, going forward, we really won’t know a whole lot until harvest rolls around and we see the results, or the answers, of what we did this year before we can go ahead and make a plan for 2021. We’ll look at the group data and see if what happened on his farms is an anomaly. If everyone had just as good of luck with certain hybrids, speed the process up instead of planting the same hybrid for three years and seeing if that’s the right one for us. So, we can look at everybody else’s data, also, and either not plant it again or try it again. To make a plan, we have to see how this year goes first.

SHAUN WOLF: You basically looked at your yields, and it helped determine if, next year, we’re not going to plant this hybrid because it didn’t do well. Or, next year, we’re going to plant more of this hybrid because it did do better. But, as far as changing our program, it really didn’t do anything because it couldn’t put the data in and change it for you. And so that’s why we were really more interested in signing up, to just have one place to put your data and get some results and be able to change things. I’ve known Pat for a long time, and he already knows the history of our farm. So, that helped a lot. Last fall, I wanted recs made and I think, within 24 hours, Pat had them to me. It was quick, with good answers. Pat’s always there, and if he doesn’t have the answer, he’ll try and find it. So, it’s been nice to have somebody to lean on and get the answers, instead of just guessing.

PAT MAI: You got to see a presentation of everybody’s data then, for 2019, which brought back a lot more questions for me and helped query a lot of data he was thinking about.

SHAUN WOLF: We’ve been backing off our bean populations, just from data we’ve seen, and it helped confirm that we’re doing the right thing. So, that gave us peace of mind that we’re doing the right thing there. It takes the guessing out of it. That’s why I like the program. It’s basically telling you what to do, instead of shooting from the hip. It takes the guessing out of it.

PAT MAI: It gives you more concrete evidence of why we’re making these decisions. It’s not just me pulling it out of the sky, thinking you should just try this. I can give him a good answer with data to prove it to him. And it helps him sleep at night, just knowing that there is something backing it, not just willy-nilly.

SHAUN WOLF: You feel a lot better having it and not worrying about it.

PAT MAI: Thank you for taking the time for this podcast. Are there any other closing remarks? We appreciate your business.

SHAUN WOLF: I appreciate you. If I have a question, you’re there with an answer. And as we go forward, we’ll rock this operation.

Why Use Variable Rate Prescriptions?

What truly is the purpose of a variable rate prescription? Wikipedia puts it as “the application of a material, such that the rate of application is based on the precise location, or qualities of the area that the material is being applied to.” Fairly complicated right? At Premier Crop we like to describe it as using your technology that your equipment already has to reallocate your inputs to a part of the field where your yield potential and return on investment are higher. Ever since variable rate application methods were introduced in the 1990s and on into the 2000s there have been a number of farmers who have strayed away from using variable rate technology because it “just doesn’t pay”. I can understand this mentality because there has never been a precision agriculture software that ties the agronomics to the economics. Was the increase in yield that we saw in that area of the field where more seed/fertilizer was applied enough to offset the cost of the inputs and provide a greater return? This is the type of question that led many to be non-believers in variable rate prescriptions.

If you’re like me and live in a rural area where you have a septic system to get rid of waste from your house by using a lateral field you probably wonder why you see thick green stripes of grass in your yard that you have to mow twice a week right next to brown and burned up grass that you have to mow every other week in the dead heat of the summer. This is a fairly elementary example, but it applies to what we do at Premier Crop Systems very well, but on a much smaller scale.

use variable rate for a reason to profit

So, what is it about these thick green stripes that make them look and perform this way? Is it the higher availability of moisture? Or maybe it could be organic matter or other nutrients in the soil? It is tough to tell for sure without a proper soil test in this area but there is one thing we know for sure. There are one or more underlying factors that are making this particular part of the yard perform this way. It is really easy to tell that if you were wanting to make money on how much your yard produced, your input dollars are best spent on these thick green stripes where you have a greater ROI. This same concept applies to your own fields. You see it every year in the combine. There are parts of your fields that consistently year after year outperform the field average and on the other end of the spectrum there are parts of the field that consistently produce well below the field average. This shows that variability in your fields is real, so how are you going to manage this variability? We do this by using variable rate prescriptions to drive down your breakeven cost/bushel at the sub-field level. Below you will see an example of a field that had variable rate fertilizer and planting applied to it. As you can see, we invested $33.24/acre more into the A zone (thick green stripe area of your yard) of the field versus the C zone (brown and burned up area of your yard) of the field but were still able to lower our breakeven cost/bushel by $0.37/bushel.

premiercrop_yieldandnutrientcosts2

Now imagine if you took the same amount of fertilizer and seeds applied to the B zone and applied it to the A and C zones. What would happen is you would be under applying inputs to your A zone where you have a higher yield potential and over applying to the C zone where the yield potential is not as great. In this scenario, with a flat rate application your cost/bushel in each zone would be substantially larger. I don’t know about you, but if I was a farmer myself, I would love to lower my breakeven cost/bushel by $0.37 across every one of my acres.

If you are struggling with the concept of variable rate, simply look out your window at your yard and you can get a good grasp on why you should use variable rate prescriptions to invest more or less input dollars in different areas of your fields. At Premier Crop we close the loop on variable rate applications by tying the agronomics with the economics. We prove that it pays and can ultimately have a positive impact on your bottom line.

Six Frustrations with Precision ag

“Growers tell me they are frustrated with precision ag, they’ve invested in the technology. I tell them, ‘You just want to put the pieces of the puzzle together to see exactly what the picture is.’ And they are relieved when Premier Crop can help.”

– Katie McWhirter, Director of Training and Development


RENEE HANSEN: Today, we’re talking with Katie McWhirter, our Manager of Training and Development. Katie is chatting with us about the frustrations of precision ag.  Katie, tell us a little bit about your background and a little more about you and your role at Premier Crop?

KATIE MCWHIRTER: I was born on your typical farm in southeast Iowa, livestock and row crop. My father’s just now retiring, but funny as he is, he is in his late sixties, and in 2013, he invested in electric drives to be able to variable-rate seed. He variable-rates his fertilizer. He does all that, which is so not what people think of that generation, embracing technology like that, but he knew that, working with me, he’d be able to make use of that equipment that he was investing in. Then, on the flip side, I have a brother who was, I guess for lack of better words, gifted or brought into the row crop world. He’s actually in the livestock industry and doesn’t have that technology, but we started talking one day, and he said: ‘I think I can use my data to do better. It’s not that good.’ So, talking with him, does he have the latest and greatest? No. But, again, his data is everywhere, and it’s just meeting him where he’s at to say, okay, I realize you don’t have this technology or this technology, but we can still use what you have to make a better decision. Even as recent as about an hour ago, I’m entering in some of his costs and his inputs to really make him see that there is variability within his operation even at a field level, which means profitability is variable at that field level. So, I’m excited to watch his journey as he gets more into this space.

20210405_170325

FRUSTRATION #1: CONNECTIVITY

RENEE HANSEN: So, Katie, what would you say? We were talking before we hit record on this podcast, how do you come up with a list of five to 10 things that growers don’t like or are frustrated about with ag technology?

KATIE MCWHIRTER: Well, those frustrations definitely vary in the different hats that I wear. Probably the biggest frustration is that these technologies, if you’re talking about in or on the equipment, would be that they don’t communicate together, especially if they’re not a solid color, meaning they’re not all the same brand of equipment. That is a frustration for growers. I would say, also, a very big frustration, and funny as I’ve been out here in the last couple weeks, growers don’t think that they could, I wouldn’t say, benefit from our services, but they’re very worried because they don’t think their data is good. So, it’s two combines, it’s three combines, it’s not calibrated. How can you change some of these frustrations? What we can do, is take that data, and as long as it’s capturing that variability and we have an end measurement, whether that’s going to be bushels or yield, we can post-calibrate or make that data usable within our system. I think even the simplest technologies really can benefit from what we do.

I think one of the things I’ve learned is that we really have to ask questions to these growers to find out, when they talk about ag technology, no different than what I did with you, to find out what exactly they’re frustrated with. If they’re frustrated with data, what do they mean by that? I mean, is it they’re frustrated because they’ve got two or three combines or two or three planters and it’s not all brought together? Is it because they don’t feel like they’re getting a complete picture? I met with a grower yesterday who said: ‘The soil sampling is here. We’ve got these spreadsheets on our computer. Their data’s all over the place.’ I smiled, and I said: ‘You just want to put the pieces of the puzzle together to see exactly what the picture is.’ They’re like: ‘Yes, that’s what we want because we’ve invested in it. We know that each of those separately has been bringing us value, but it’s also bringing us frustration as we know we should be bringing them all together to make an even better decision.’

FRUSTRATION #2: DATA ISN’T GOOD ENOUGH

RENEE HANSEN: What was some of his biggest hesitation? I know you mentioned that he felt his data wasn’t good enough but elaborate on that a little bit more. Tell me more about that.

KATIE MCWHIRTER: Well, the yield monitor doesn’t have a card in it, so we haven’t been collecting yield data. So, I mean, the basics of what we’ve always said is a must. It’s really what we’re rooted in, but with our new planning tools, I immediately was like: ‘Okay, but there’s so much more we can do even by putting together, at the field level, his yield goals and his expected revenue and his variable-rated nutrients because he’s been grid sampling.’ Even though he doesn’t have what we, even a month ago, thought was an essential piece of what we had to have to be able to work with a grower, he’s going to test me on this one because he’ll get a yield monitor. That’s the agreement by fall, but I believe we can still provide him value being early enough and being able to identify his yield efficiency scores, his planned yield efficiency scores in each field, to be able to potentially identify profit robbers and how we could try to lessen that on his operation as a whole. Yeah, he definitely was hesitant until I showed him. I’m like: ‘Here’s what I need.’ And he immediately says to me, he’s pointing at the paper, and he’s like: ‘I’ve got this. I’ve got this. I’ve got this.’ I’m like: ‘Yeah, you’ve got the pieces. Let’s get them put together.’

RENEE HANSEN: Yeah, putting it together all in one system, and you also mentioned connection and connectivity. I mean, that seems to be everything’s everywhere. So, you also tell me, what are you doing to help him solve that and get all the information into one spot? I mean, you are doing some of the work for him.

KATIE MCWHIRTER: Right. So, I get the pleasure of contacting the people on his agronomy team. I think, before, some people might’ve seen us as the competition or a threat, and what I’ve said to both his seed supplier and his crop protection and fertilizer salesperson is I’m not here to step on your toes. I don’t sell those things. What I’m doing is I’m trying to help him be more profitable. That’s been fun to talk with his team, and, in fact, as soon as I start putting these pieces together, I want to meet with his team and show them what we’re trying to do for him in order to make him a more profitable farmer.

inthecabyieldmonitor

FRUSTRATION #3: DIFFERENT COLORS OF EQUIPMENT

RENEE HANSEN: Yeah, and what about the color of equipment with numerous different colors of equipment? Or the farmer, the grower, isn’t applying some of their inputs. Somebody else is doing it for them. How do we go about getting some of that information?

KATIE MCWHIRTER: Oh, definitely. Again, I met with another grower yesterday, and as we’re talking, sometimes they think all this information has to be captured somewhere or captured on a monitor. It has to be captured somewhere, but there are so many different pieces of information that we keep track of. I think that is a really big misconception, what data is. Some people, I’ve laughed, they think it’s a singular thing. For us, it’s a plural. I mean, so much data can be collected not necessarily on a monitor. So, putting that all together in one system, be able to look at it, to get a clear picture as far as what’s correlating yield or, more importantly, what’s driving profitability or, better yet, holding the entire operation back from being more profitable.

FRUSTRATION #4: IS A PRECISION AG SERVICE PROFITABLE 

RENEE HANSEN: Yeah, you’re talking about some of the things that they can start inputting and putting the pieces of the puzzle together. So, what’s the output? What do they get? What are we giving a grower? How is it going to benefit him?

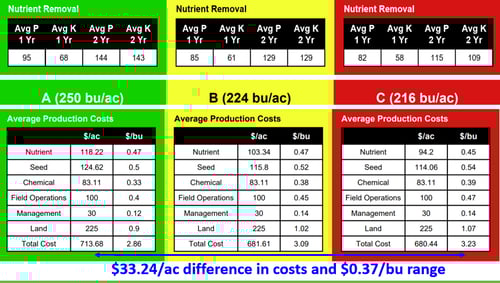
KATIE MCWHIRTER: What it gives the grower is a clear picture of their operation as far as profitability, that return to land and management. The numbers don’t lie. I mean, I’ve always said the numbers do not lie. Take the emotion out of it, but that’s not where it stops. Essentially, it’s a continuous cycle. Don’t give me a pretty map, and that’s great, right? Don’t give me that. I need you to be able to, and our growers need us to be able to, without any bias, to say: ‘Here’s what we could do with it.’ Ultimately, it’s going to be the grower’s decision, and that’s what I was telling the grower yesterday. We’re never going to do anything that you don’t want to do, but we will challenge you as far as this is what we’re seeing in the data, and if you’re wanting to improve, it really looks like this is an area that we could focus on.

FRUSTRATION #5: FEAR OF CHANGING EVERYTHING AT ONCE

RENEE HANSEN: Yeah, something that you mentioned, Katie, was it’s a continuous cycle and how it’s never ending. You’re constantly learning. So, even at year one, there is so much that we can learn about. So, tell me, what does a grower learn at year one?

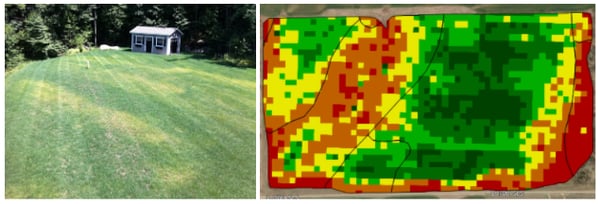
KATIE MCWHIRTER: Which is funny because, when I got back into working directly with growers, that was one of the questions that they asked me when we were first sitting down: ‘What do you think we’re going to learn this year?’ As I was getting all this data from him, and I’m like: ‘I don’t even want to take a guess.’ I have a suspicion, but I don’t want to say it out loud, but I think it was just their biggest ‘aha’ was I’ve never looked at my data like this before. I’ve seen it on the typical red, yellow, orange, three-shades-of-green map. Maybe I’ve done a little bit of comparison in some of these other platforms before, but never have I looked at it this way before. Whether that was in charts or in our data visualization tools and then, ultimately, to tie those costs back to it. Some of the things they thought, they were right, and some things they were kind of surprised, which has led to decisions. When I started with them in August, I mean, I told them I was not going to push them to anything that they didn’t want to do technology-wise. All of a sudden, we’re sitting down for our planning meeting in December. I’m like: ‘Oh my goodness. Four months ago, this is not where we were.’ I didn’t think this is where we were going, and now we’re jumping in the deep end of the pool. I don’t want you to do this and be uncomfortable. I want you very comfortable with the changes that you’re suggesting we make. That’s been fun, though, to lead people through because we all know that change is hard, and it’s very hard to get outside of our comfort zone. So, I actually start my sales training, my leadership training course, with: ‘Here’s your comfort zone, and outside of it, that’s where the magic happens.’ That’s so, so true with farmers.

premiercropyielddata_farmer

FRUSTRATION #6: DATA IS OVERWHELMING

RENEE HANSEN: I really think, and I see it too, just within our own family operation too, that sometimes you can get so comfortable diving into something new, they want to, a grower wants to get into something new, but it’s like, where do you start? How do you get started? It’s having a service, something that Premier Crop offers, something that you offer, just helping them, starting to input the information, contacting the people to get the information, knowing who to contact. So, right now in 2021, we’re at the beginning of March. Why would a grower need to get involved in something like this? Why should they wait?

KATIE MCWHIRTER: I don’t think they should wait. I think it could seem very overwhelming and don’t know where to start. It just takes that conversation to get them going. Really, I say, that’s why it’s so wonderful that we have the great group of advisors that we have to guide them through this process. We all like to be guided. We all like to know what’s next. I don’t care if it’s the program at church, the bulletin to what’s next. Or when you get on an airplane overseas, and it’s saying: ‘Here’s what’s going to happen. Then, this.’ That just puts everybody to ease and guide them along. Our advisors, it’s like we farm with them. I mean, I know I wasn’t going to go back and farm, but that love of agriculture and helping farmers, that’s our group of advisers. That’s their characteristics, their qualities. They genuinely want to help because it’s like they’re farming.

RENEE HANSEN: Thanks for listening to the Premier Podcast, where everything agronomic is economic. Please subscribe, rate and review this podcast so we can continue to provide the best precision ag and analytic results for you. To learn more about Premier Crop, visit our blog at premiercrop.com.

Learn more about the power of precision ag.
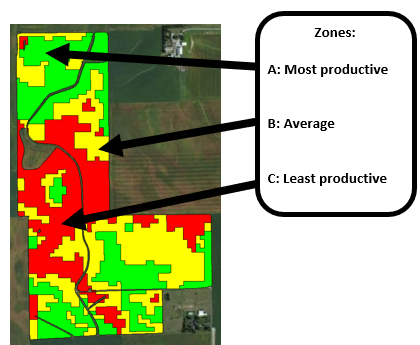
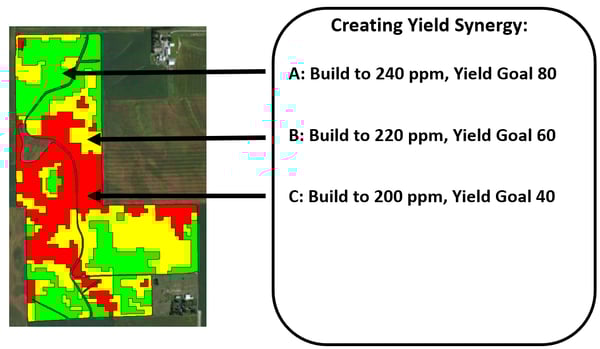
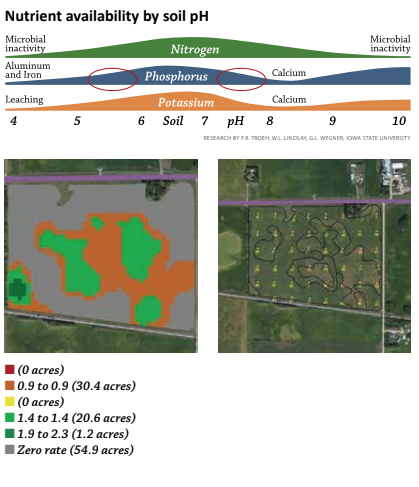