Creating a Farm Plan Matters

“Squeezing every possible bushel and dollar out of every acre is critical. You have to create a farm plan to manage areas of your fields. It will produce a dramatically different productivity potential than those who don’t create a plan.”

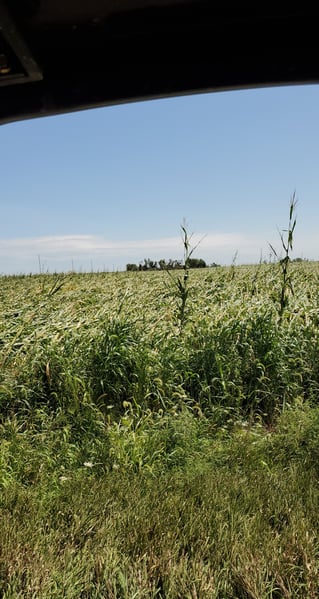
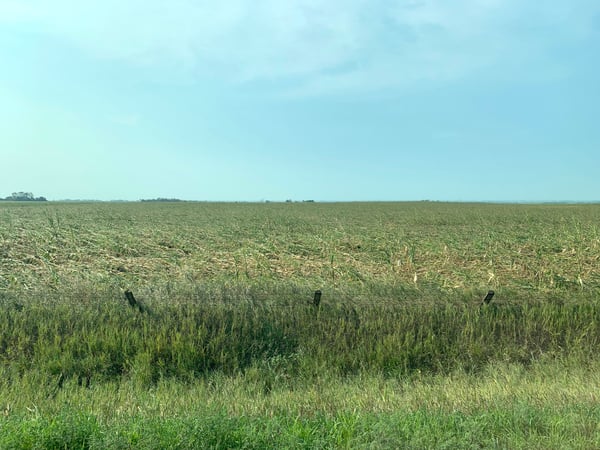
DARREN FEHR: On a little more somber note, we’re coming off of a week that has seen some record devastation, some real problems. And first of all, first and foremost, on behalf of Premier Crop and all of us, I’m really, really sorry to see all of our farm friends and family go through this. Our hearts, minds and prayers go out to all those who have had such significant loss. Four dead: three in Iowa, one in Illinois. There were, 200,000 people without power for more than seven days, which is really, really difficult. I’ve heard something like 10 to 15 million acres damaged or written off completely. Some really serious devastation, and, even more than that, we have a grain storage problem with thousands of on-farm storage bins damaged or ruined completely. So, we have a fairly significant weather issue, and it kind of sets up the topic for today on creating a farm plan. And this is a question that we get often from either prospects or customers: why should I spend so much time planning when I can’t control the weather? Let’s just talk a little bit about that, about what goes into the resulting yield efficiency. How should we think about farm planning in light of the fact that, yes, we do not control the weather and we cannot predict the weather? So, what advice, Dan, do you have for our listeners?

Farm plan to mitigate weather

DAN FRIEBERG: Sometimes, it’s best to tell a story or to paint a visual picture in people’s minds. This is one I have used over the years, and, as farm size gets larger, you may need to change the numbers. A lot of times, this is a dialogue with growers, and the question comes up, and what happens is they’re just so frustrated by an event like what happened. You have green snap, you have a wind event, you have hail, you have drought. There’s just this frustration, and I know that’s where it comes from and I understand the helplessness. I ask farmers and have them paint this picture: in your local area, in your local market, there are 160 acres that are coming up for sale. That’s 160 acres that is really uniform. It’s all one soil type. It’s been farmed for the last 30 years by the same operator. It’s been rotated as 160 acres for 30 years. In this case, it’s either been corn or soybean. Okay. So, it’s coming up for sale, and the auctioneer sells it, initially, as a 160-acre track, but then, sometimes, they will divide the track. They offer it as two 80s, and, sure enough, when they split it up and offer it as two 80s, it goes for a much higher price as two 80s than it did for the 160.

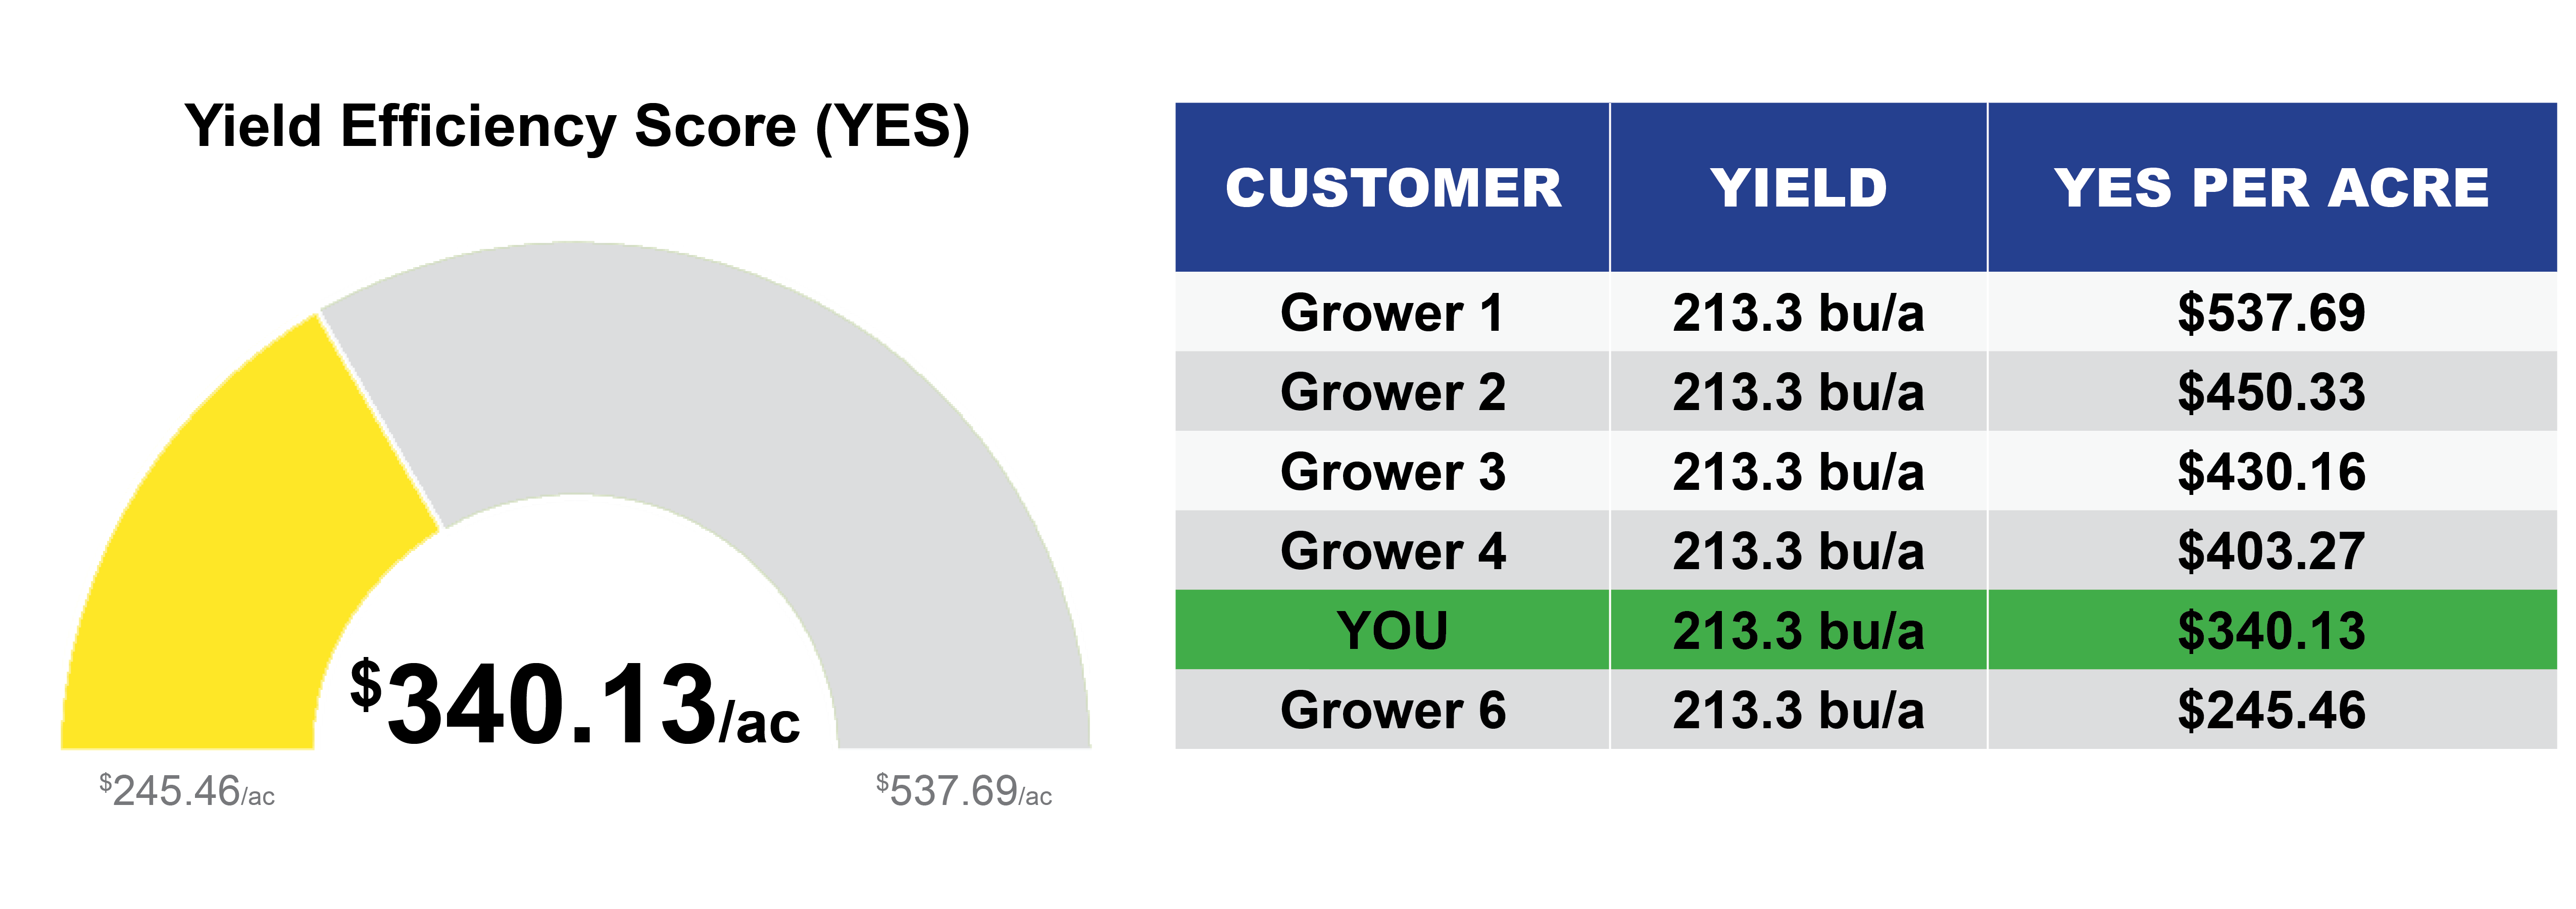
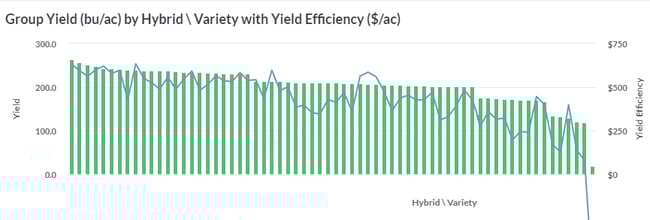
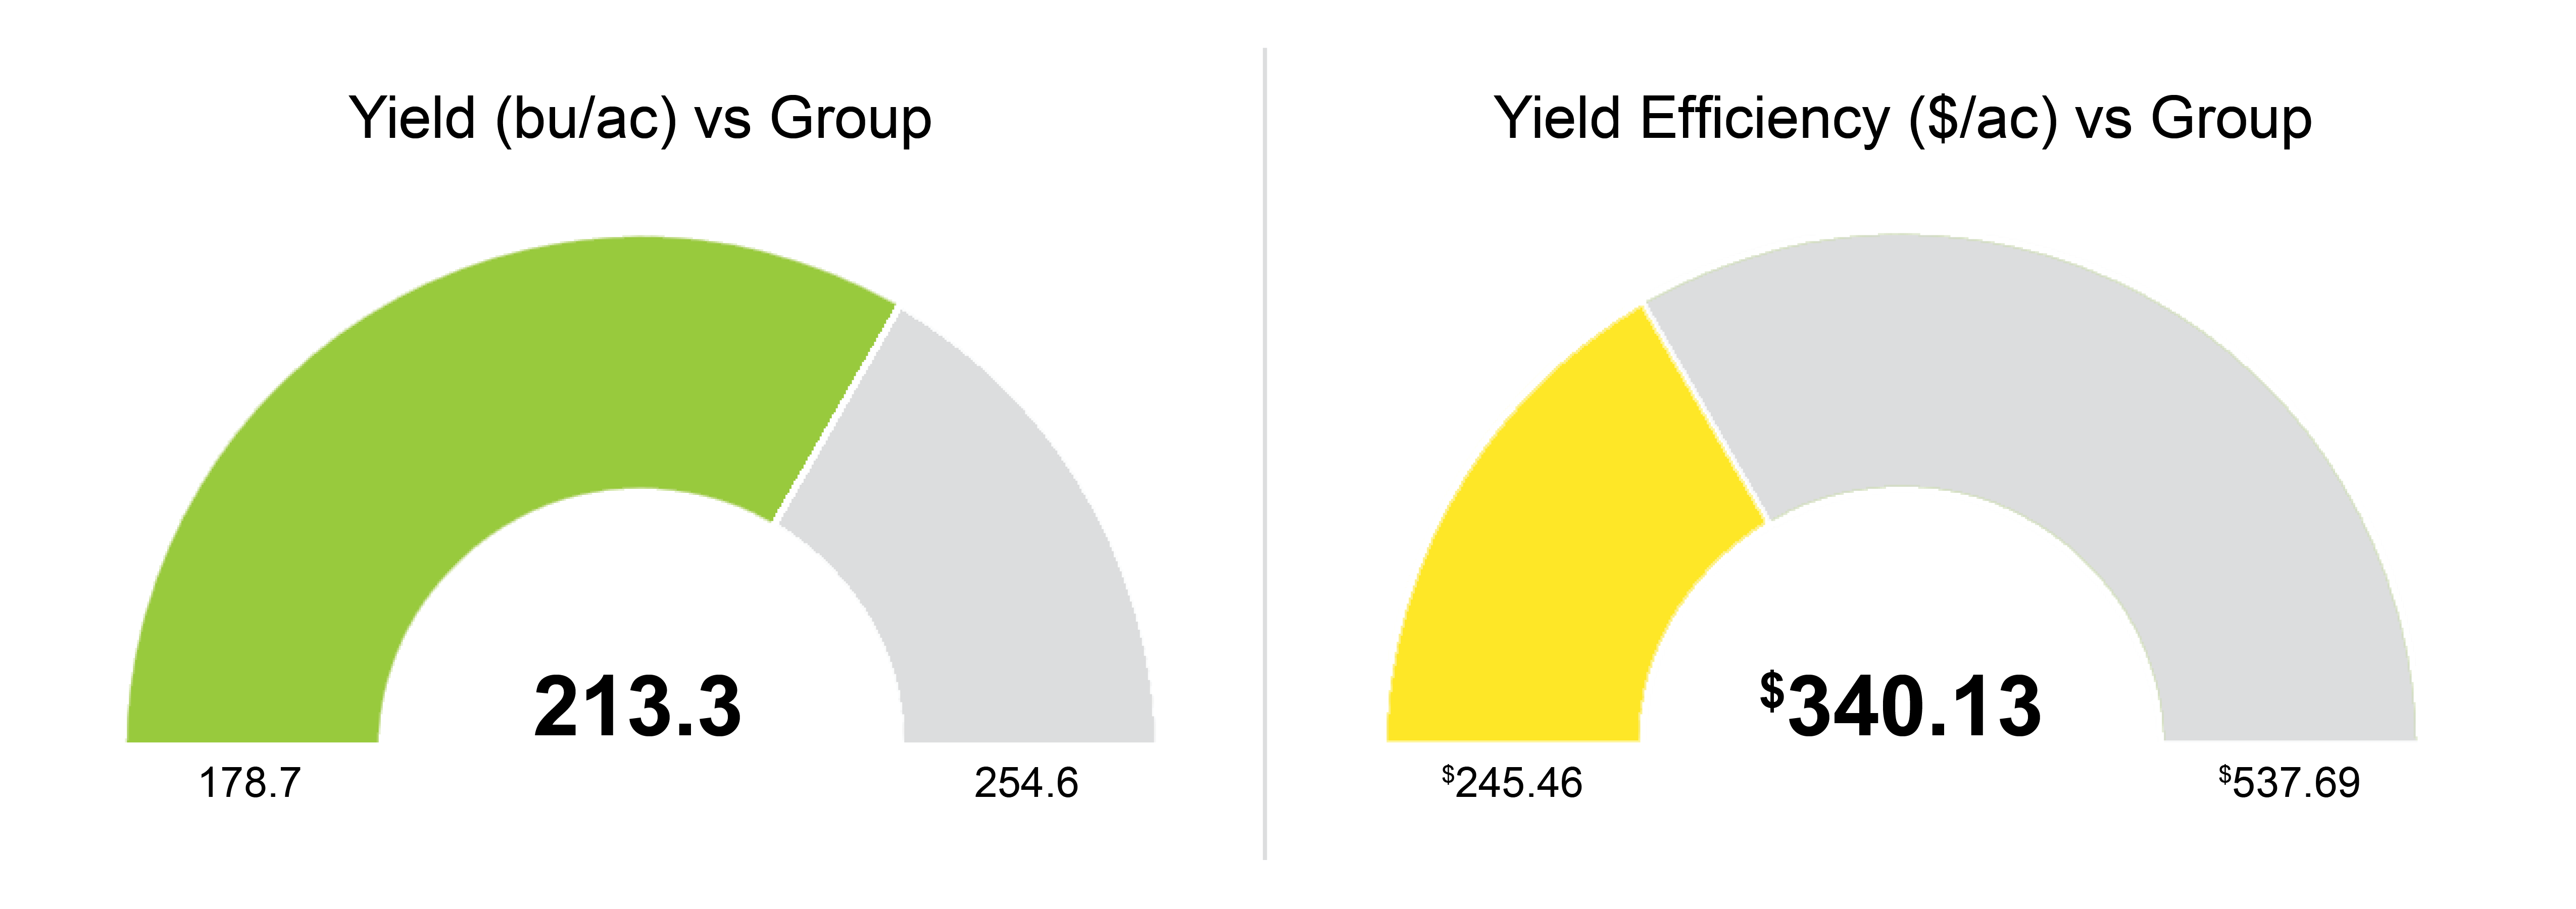
I ask the growers that I’m talking to: how much yield difference, or you could say how much yield efficiency difference, could there be between the two 80s? What I’ve done is I’ve basically said: this is uniform. It’s been farmed the same, and, because it’s a 160 acre field, those two growers are going to experience the exact same weather events. So, I ask them how much yield difference could there be? In the case of corn, it’s a 30 or 40-bushel difference, so think about that. If there could be 30 or 40-bushel differences, you’re talking more than a $150-an-acre swing in yield efficiency. The whole point of that exercise is, in everybody’s heads, they know that management matters. No matter what the weather, the details that go into farming really do matter. The management decisions that each of those growers makes, that’s where all the profit is. Details matter. Management matters. That’s what we’re all about. Farm Management matters, and having a farm plan matters no matter what the situation is.

DARREN FEHR: We’ve seen that time and time again, where our customers are constantly in the top 10 percent of the performance in their counties, for example, where, typically, you’d see some similar climatic conditions. Where management is intensified, or where we get this behavior of professional  farming, you have the ability to make a difference. How do we approach farm planning, knowing that we can’t control the weather? What should we plan for, in terms of environment? If we talk about genetics and environment and management, there’s a management piece as a component, which we do a lot to help with, in terms of managing right-rate technology. But how should we approach weather in terms of: Am I planning for a dry year? Am I planning for a wet year? Am I planning for a 15-year average? What do you say about what should be the lens?

DAN FRIEBERG: So much of planning and, really, so much of the way people farm is about managing risk. A lot of the decisions are risk management. It tends to be very individual. Some people’s tolerance for risk is much greater. And how that plays out agronomically is, if your tolerance for risk is greater, you might be more aggressive in the way you plan and the decisions you make. And if your tolerance for risk is less, that could just be the financial constraints you’re under. When you’re under financial constraints, sometimes, you have to be a little bit more conservative. For example: hybrid selection. If you’re more conservative, you might deliberately choose hybrids that have a lot of flex. By choosing flex, it allows you to deal with the diversity of weather that you might experience. It would let you plant at a lower population. So, in a dry year, you have a lower population. You’re better able to handle the moisture stress. And in a wet year, if it’s wet, you have a little bit more potential for the hybrid to flex versus you know, when you make that choice, you could be choosing to give up the top end. There may be a racehorse that is capable of hitting the very highest yield for your area, and you may have passed on that, but you passed on it because you’re managing risk in a more conservative way versus somebody who’s maybe more aggressive. They might go the opposite, and they go out and pick the very highest-yielding numbers and plant them on a percent of their acres, just because they’re allowed to be more aggressive.

DARREN FEHR: I want to dig into soil fertility a little. You’ve been a soil fertility expert for many, many years.

DAN FRIEBERG: I’m kind of more of a practitioner, just somebody that’s had the luxury. I’ve had the luxury of seeing lots and lots of data.

DARREN FEHR: You have had the luxury of experimenting with other people’s farms and seeing terrific results of all experimentation, which is fantastic.

DAN FRIEBERG: It has been fun. That is what’s really fun about all this. You see all this going on in the data, but then you’re able to actually put down a trial or an experiment and follow through and see the results. So, it’s really been fun that way.

How to create a farm plan to help with profitability

DARREN FEHR: Which is such a big reason why we’re so passionate about what we do. It’s because we see the results and the reality of it, but, on a soil fertility level, we’ve seen it time and time again. We’ve gone through weather events, whether it’s drought or flooding, and where we have established really strong long-term soil fertility principles, we have seen it time and time again. Our customers go through that easier or with better performance than others. Why?

DAN FRIEBERG: I think what you’re speaking to is when the weather turns against us, and that could be dry because we’ve got areas that have drier weather. So, when the weather turns against us, I think that’s when the reward for having a farm plan and managed fertility really pays, whatever that weather event is. I think we see more response to having that long-term fertility management in stress years than we do great years. I mean, when everything’s perfect weather-wise, you still see it in data, but I don’t think it’s quite as dramatic as it is in a stress year.

DARREN FEHR: A farm plan is almost like an unseen insurance policy, to some extent. It’s not going to save you, but it’s certainly not going to let you get as severe as others.

DAN FRIEBERG: It is. That’s exactly what it is.

DARREN FEHR: I think that’s the premise of this farm planning piece, that we can’t save our way to prosperity. We know that. This game isn’t about cutting costs. It’s about managing costs. And when we talk about farm planning, we’re talking about managing costs, managing resources in a way that we’re allocating them to the areas that can return the greatest. And we’re managing risk in areas where we know that productivity has historically been low.

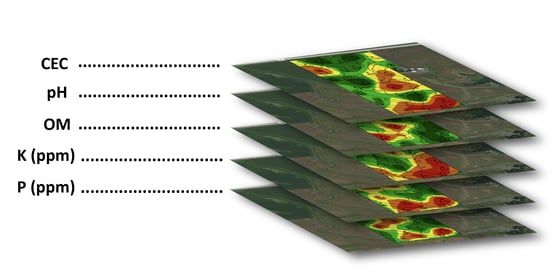
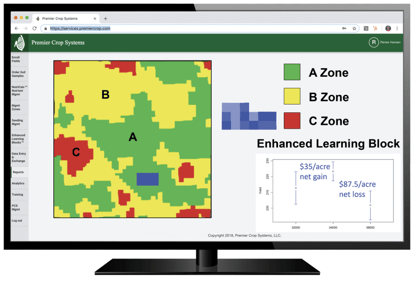
DAN FRIEBERG: Sometimes, I get challenged because of what we do, like you’re programming the field on how to behave. You are literally telling the field how to behave. Well, yeah, we’re doing it, but it’s based on data. It’s based on how the field has behaved, and then we constantly challenge ourselves. We put check blocks inside learning blocks inside prescriptions, just constantly to validate if we’re missing something, to make sure we don’t make a mistake in how we program the field. To me, this weather piece of planning has everything to do with it. There’s a lot of growers who are sitting on a mountain of historic yield data, and they haven’t necessarily used it very effectively. And to me, that’s a great starting place. It’s just a great way to get started and to use your historic yield data, to identify. It’s part of setting realistic yield expectations because it starts to let you know what’s the best it’s ever done. It’s just having realistic yield expectations for every part of it. There are areas that people farm that are never going to produce at the highest level. Then, it’s just about managing way more conservatively in those areas.

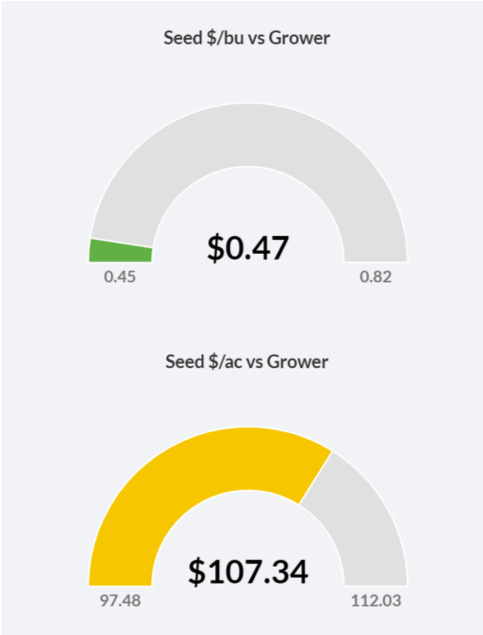
DARREN FEHR: You made a comment to me several years back: sometimes, it’s not even what you buy. It’s where you put it and how much you put on. I believe that the products that you use matter. I believe that we should plan before we buy.

DAN FRIEBERG: Everything works somewhere. Nothing works everywhere.

DARREN FEHR: Right on.

DAN FRIEBERG: Farmers are just bombarded by all kinds of new products: yield enhancers or efficiency this or that. It’s just constant. It’s microbials and stimulants and seed treatment. They all work in some place. Otherwise, they wouldn’t have found their way to the market, but they don’t work everywhere. I’ll guarantee you that. There’s something else that’s more yield limiting than whatever they’re fixing. So, figuring out what works where and at what rate is just the magic that we’re all chasing.

DARREN FEHR: One last point: Farm planning spatially versus at a field level. Pros and cons?

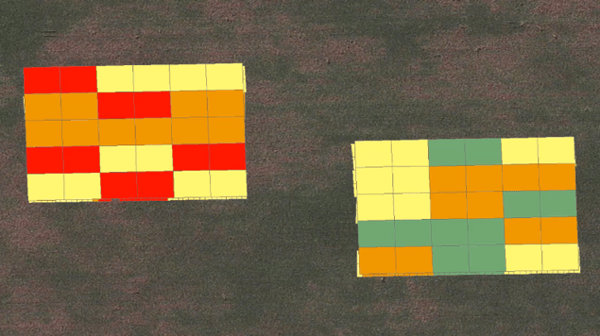
DAN FRIEBERG: Darren, there are operations that treat thousands of acres the same. They literally do everything exactly the same on every acre. So, going to a field level is a great start for them. It’s finally starting to acknowledge that there are differences within fields. That’s a great start, but, for us, it’s way deeper than that. Squeezing every possible bushel and dollar out of every acre is just critical. We think where this obviously leads is managing and creating a farm plan within fields, within areas of fields that have dramatically different productivity potential.

DARREN FEHR: Yeah, and just for our listeners’ perspective, we were literally managing every 20 by 30-foot area inside of every field and looking at them uniquely, looking at them as it could be different. And if it is, we would do something different in that small area of that field.

DAN FRIEBERG: It’s all within the equipment restraints. We’re realists. We kind of know the constraints of the equipment as it goes across the field and what it’s capable of executing on.

DARREN FEHR: When we think about applying our right-rate technology to farm planning versus field-level planning, how much money is at stake? Is it worth it? Is the hill worth the climb?

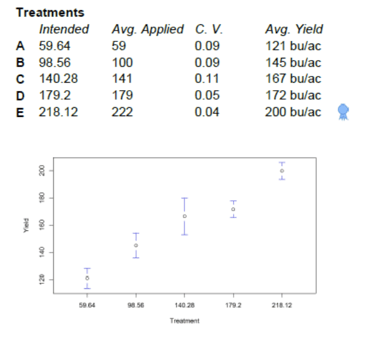
DAN FRIEBERG: It sure is. It’s not hard, in data, to find 100-dollar-an-acre swings. You think about where we’re at today. 100 dollars an acre is just gigantic. It’s easy to find individual decisions that amount to 100-dollar-an-acre swings. There are hundreds of dollars an acre differences.

DARREN FEHR: It’s a huge deal, and farm planning without proving the result doesn’t really do us any good because we can’t really tell how effective our farm plan is. Something that we do very well is prove that the prescription pays or prove that the farm plan pays.

DAN FRIEBERG: Just that constant analyzing what you did, making sure. We analyze, and then we turn that into advice, and that advice could be anything related to how you make management decisions or agronomic decisions. That advice turns into action. The action, many times, is driving differences in how we treat pieces of fields. It’s just a continuous cycle. It’s all about shared learning and continuous improvement.

DARREN FEHR: We’ll keep talking about creating a farm plan and yield efficiency in our upcoming podcasts. Dan, thanks for being here. I hope you have a fantastic birthday. For anybody who wants more information on farm planning and proving your plan pays, you can get a hold of us at www.premiercrop.com. Thanks for being with us today.

Farm Finance Featured on the Farm 4 Profit Podcast

“We have growers who tell us that we’re helping them with their economics, which helps convince their lender to give them the full operating line.”
Dan Frieberg

On this episode of the Premier Podcast, Dan Frieberg interviews the Farm 4 Profit show. Make sure to subscribe to their show at farm4profit.com. We hope you enjoy the conversation:

TANNER WINTERHOF: All right, welcome back to another Farm 4 Profit episode. This is Tanner Winterhof.

DAVID WHITAKER: And this is David Whitaker.

TANNER WINTERHOF: Dave, we got a little advice from a couple of peers as we put this podcast together that it would be helpful if we identified ourselves at the beginning of each episode. So, for a new listener, I’m Tanner. This is the voice of Tanner, and I’m a banker in central Iowa.

DAVID WHITAKER: And I’m David, and I am a farmland sales auctioneer and a real estate agent in central Iowa, as well.

TANNER WINTERHOF: So, thank you, new listeners, for joining us. We really appreciate you checking in. We’ve got a little bit of an interesting time this year. We started out with the coronavirus. We had some weather events. We’ve got inland hurricanes. We’ve got regular hurricanes. We’ve got droughts. Everything’s all storming together, but we’re going to focus on something a little bit more exciting today. We’re going to jump right into what’s working in ag. Don’t you think, Dave?

DAVID WHITAKER: I think so. We’ll just call it hashtag 2020.

TANNER WINTERHOF: That’s all we got.

Farm 4 profit podcast focus on farm finance

DAVID WHITAKER: That’s what we’ll call it. We have a guest today. Who is our guest, Tanner?

TANNER WINTERHOF: We’ve got Dan Frieberg, and he is here to share with us a little bit about what’s working for ag in his company. A really neat background. He grew up on a farm in Iowa, graduated from Iowa State University. His career includes wholesale fertilizer sales, retail management. He also served as the CEO of the Iowa Fertilizer and Chemical Association, later the Agribusiness Association of Iowa, and other business consulting. One of his favorite beverages, if not the favorite beverage of Dan, can you believe this, is Diet Pepsi.

DAVID WHITAKER: There you go.

TANNER WINTERHOF: But what does this have to do with farming? What do you think?

DAVID WHITAKER: I tell you it has a lot to do with farming. So, Dan, tell us. I’m glad to see you’re an Iowa State grad. I’m glad to see you’re from Iowa. Anything we missed there, other than a good hair day and the Diet Pepsi thing?

DAN FRIEBERG: I think you got it nailed.

DAVID WHITAKER: Okay, great. Well, welcome Dan. Do you live currently in Iowa, still?

DAN FRIEBERG: Yep, just south of Des Moines.

DAVID WHITAKER: I got ya. And so, tell me a little bit about your company. What exactly do you do?

DAN FRIEBERG: We take agronomic data, help growers with agronomic data that they’re collecting to provide analytics and economics with farm finance. Then, that analytics turns into advice and an action plan for the following year. Most of what we do ends up with a variable-rate prescription that goes in a piece of equipment, whether it’s the grower’s equipment or it could be a retailer’s equipment.

DAVID WHITAKER: So, you’re basically working with the farm data. “Farm Data is the currency of the internet” is what I always tell Tanner. And you are taking that farm data, and then you are helping the farmer probably spend less money by doing variable rate throughout the field or making tough decisions to plant or not plant or certain things. That’s what I’m gathering. Is that correct?

DAN FRIEBERG: I don’t think we ever save growers money. I think that’s one of the mistakes that a lot of people made in precision ag in the early years. We’re 20-some years into this, and a lot of the early messaging was around saving growers money. And I think that’s an unfulfilled promise. In the case of variable-rate lime, it is something that we do that saves the grower money on liming costs. But, most of the time, I think what we do is, rather than positioning it as saving the grower money, it’s about investing within parts of fields to get a higher return. So, instead of treating the whole field as though it’s the same, it’s about identifying areas that are capable of producing more and more efficiently. And then in other areas, it could be that that’s where you save them money because it just doesn’t make sense to continue to invest.

TANNER WINTERHOF: I grabbed it right off the website that Premier Crop was established in 1999. And what it says right there is this: “They enable the growers to think deeper about their data.” So, what I grabbed from that is using that variable-rate technology. The way to make that pay is not necessarily saving money but maybe reallocating those input dollars to site-specific areas, to where you could probably get a better return on your investment than where they might’ve just been blanketly broadcasted.

DAN FRIEBERG: Yep, I think that’s exactly right. I think maybe the other thing that we do differently is we have the ability to combine agronomics and economics. Right now, it’s really difficult to make money in a lot of areas. If we’re spending more in one part of the field, we’re able to actually tie the cost, the added costs that we’re investing in that part of the field, to the analysis. So, at the end of the year, we’re able to really deliver what we’re branding as a yield efficiency score, which is just dollar-per-acre return to land and management. For us, it’s about what’s been missing. We think there’s too much focus on just agronomics and not economics. I think right now, especially growers, they appreciate the focus on economics to help with farm finance. We like to say everything agronomic is economic.

farm finance and profits

DAVID WHITAKER: Gotcha. So, that’s a new term for me, the yield efficiency score that you have. Tell me a little bit more. Is it 100 is the best and zero is the worst, or how does your scoring system work?

DAN FRIEBERG: No, it’s really just dollar-per-acre return to land and management.

DAVID WHITAKER: Okay.

DAN FRIEBERG: It’s yield, and yield is tracked, obviously, with the yield monitor, a calibrated yield monitor. So, it’s yield at a benchmark selling price that the grower gets to set minus what they spent on nutrients, seed, crop protection and field operations. It’s kind of what’s left over. When a grower sees a yield efficiency score of $400, and they know they got $275 in land cost, then they immediately understand what’s left, the return to them for farm management.

Premier Crop Yield efficiency score

TANNER WINTERHOF: So, if we’ve got a listener here who hasn’t been using variable-rate technology before as part of their operation, is that a large hurdle to overcome? Or do they pretty much have the technology on most of these farms to be able to implement that?

DAN FRIEBERG: Tanner, I think if $7 corn did anything for us, it was that there was a lot of investment in new technology in the cab. When we had that run-up in prices and in profitability, growers put a lot and they invested heavily in upgrading planters. In the process of what happened during that time period, there’s a lot of technology in the cab, but there’s a lot of growers who aren’t necessarily using farm data to the full advantage. They have the technology. They have the ability to do it. They haven’t started because they don’t know how, and they’re looking for solutions.

DAVID WHITAKER: You said $7 corn. A lot of people updated their equipment there. But, for our newbie farmer that’s out there, or even somebody that’s been doing it, if they’re in an older combine, whatever it may be, and they decide they want to upgrade and be able to use your systems, is there a minimum-like entry? Something that they’re going to need for farm equipment?

DAN FRIEBERG: For us, we use the yield monitor as a way of measuring, measuring whether what we did was the right thing.

DAVID WHITAKER: Do they have to have a WAAS GPS or a certain sub-inch or anything there?

DAN FRIEBERG: No, just a GPS, a yield monitor with a GPS receiver.

DAVID WHITAKER: Okay, fair enough.

TANNER WINTERHOF: Pretty simple to get in there. So, Premier Crop Systems really allows that farmer to really get the investment that they put into that technology and put it to work. You guys can really work with them to use the existing equipment that they have to their full potential. One of the other things that I had come across when I was reading is it really keeps that farmer from farming on averages. You really come down and do check blocks and break that field out into, I call them, profit zones, but maybe you have a different term. Could you explain what you do when you break a farm down?

DAN FRIEBERG: Yeah, a lot of times that is what we do. We just try to identify, whether it’s management zones. We’re bringing a new version of that, which is performance zones, but it’s really trying to identify like-agronomic environments or unique agronomic environments within fields. It’s very much not treating it all like it’s the same. Tanner, within every field, growers will tell you there’s a sweet spot.

TANNER WINTERHOF: Yeah.

DAN FRIEBERG: Every grower who’s had a yield monitor has seen 80-90 bushel beans. They’ve seen greater than 100 bushel beans, and they just wish they could figure out what it was about that spot that made it so great. And that’s kind of what we try to help them do, identify those really high-yielding sweet spots, and a lot of times those are the ones that will respond the most to additional input investment. And then, conversely, there are areas that just don’t yield as consistently, and we try to solve the problem of whatever it is. We try to use farm data to help coach them on whatever those areas are. You’re in Huxley, and there’s a lot of potholes. There’s that north-central Iowa area. There are low areas. In wet years, they drown out. In dry years, they’re the highest yielding. They tend to be organic matter rich and nutrient rich because of all the years that they didn’t produce a crop. So, they’ll do great. They’ll do great in a dry year, but a lot of times we don’t invest near as much in inputs in those areas.

TANNER WINTERHOF: Yeah, take advantage of the resources that we have there.

DAN FRIEBERG: Tanner, the time is right, but it is tight on the farm. It’s really difficult to make money. That’s why farm finance and combining agronomics and economics is so important.

TANNER WINTERHOF: Yeah, it is.

DAN FRIEBERG: We have growers who tell us that some of this economic stuff we’re helping them with is what’s helping them convince their lender to give them the full operating line. So, we’re all about helping growers step up their game, and we know how difficult it is on everybody’s part.

TANNER WINTERHOF: It is.

DAN FRIEBERG: You guys don’t remember. I lived through the farm crisis of the 80s, and I was helping growers get financing. It was a dark and ugly time.

TANNER WINTERHOF: One of the things that I’ve noticed in the financing industry is that we have had more people utilizing creative financing methods, combining the dealer financing on their seed, getting some chem finance through their supplier, rather than getting their full operating through the bank. And part of that is our fault. We do get a little bit more conservative if we don’t have accurate records. So, I could see where Premier Crop Systems is valuable. And the fact that you can show me that, “Hey, we’ve got a plan. If mother nature cooperates halfway, we’re going to be able to put this plan to work and get us at least a crop that we can sell.”

DAN FRIEBERG: You guys know it because you’re interacting with growers. It’s a really high-stress time. When you see the farm suicide rate spiking, it’s reminiscent of just all the stress that’s going on with a lot of operations.

TANNER WINTERHOF: So, have you been advising any of your clients on what to do after the crop insurance adjuster shows up? Are you able to kind of help with a profitability calculation based upon what they’re learning after the derecho?

DAN FRIEBERG: Yeah, I mean it’s going to be difficult, like Corey will tell you. It’s going to be really difficult to get great data when you’re harvesting down corn. It really makes it difficult to have as much confidence in the data. It’s a struggle that way. Tanner, we’re right in the middle of it already because we’re starting to get ready for fall fertilizer prescriptions. If you’re not harvesting a crop, you’ve got nutrients that are in that crop that are going to get returned. So, you’re factoring that into your nutrient investment for next year, and so people are going to spend less on nutrients probably. But you’re trying to make sure you don’t short yourself in an area where you really need fertilizer manure to make it pay. It’s already started.

TANNER WINTERHOF: I’ve already heard guys talking that they might not be able to do as much corn on corn as they wanted to for fear of a volunteer coming up. Yeah, a lot of things are up in the air. I just got off the phone with a commodities broker who stated he’s got clients that just don’t know what to do. They’re in a limbo, waiting for the adjuster to show up, waiting for crops to dry down, waiting to find out what their options are.

DAVID WHITAKER: It’s an emotional roller coaster.

TANNER WINTERHOF: Yeah, any type of advice that they can get from a trusted advisor will go a long way.

DAVID WHITAKER: Yeah, it makes for an interesting year.

TANNER WINTERHOF: Well, Dan, I really thank you for joining us. I’m going to summarize real quick, and then let me know if we missed anything or if you want to share anything else. But we’ve got Dan Frieberg with Premier Crop Systems on the phone today, helping us out with our “What’s Working in Ag” segment. The company, started in 1999, enables growers to think deeper and utilize their data to make better agronomic decisions from that detailed data itself. They put the technology investments that you’ve already got on your farm to work for you. They want to make sure that you don’t think about farming on the average. Get down to a profit zone by profit zone analyst and management style, and then make sure that if you have a farm that is set up to where variable rate can pay, that it is not necessarily, Dave, the concept of saving you money. It’s more allocating those resources into a better part of the field that might make you more on the profit side. How did I do, Dan?

DAN FRIEBERG: You did perfect.

RENEE HANSEN: Thanks for listening to the Premier Podcast, where everything agronomic is economic. Please subscribe, rate and review this podcast so we can continue to provide the best precision ag and analytic results for you. And to learn more about Premier Crop, visit our blog at premiercrop.com.

Using Data for Hybrid and Variety Seed Selection

“Part of the value of what they get in the Premier Crop program is being able to see beyond their own operations. A lot of times, hybrid and variety is the very first thing they look for.”

– Dan Frieberg


DAN FRIEBERG: I always think, from a grower’s perspective, that the first analysis that you do is your own. It’s what your own results were from that crop year. What worked and what didn’t? It’s understanding analytics by hybrid or variety across their operation. The reason that it’s really great at a grower level is that, sometimes, a hybrid or variety in data shows up having done really poorly at a grower level, but the grower knows where it was planted. They have the benefit of knowing that the reason that number did badly, or looks bad, was because I planted it on my three worst fields. It may have been that they picked the number intentionally that had more defensive characteristics because those are really difficult fields. So, I think just looking at how your numbers did on your own operation is maybe a starting place.

TONY LICHT: Maybe to build off of that, Dan, from there, once I do the analysis on my own operation, then I want to think about: “How did it do for others around me in a like environment, somewhere pretty close to me?” Because if it happened to do poorly for me, but I find out it did well for others, where did it do well for others? How can I correct that?

use data to select seed hybrid

DAN FRIEBERG: Amen. Every grower in the system has the option of whether they want to be part of seeing anonymously beyond their own operation. Today, they all want that. Part of the value of what they get in the program is being able to see beyond their own operations. A lot of times, hybrid and variety is the very first thing they look for. They want to see beyond what their own experience was.

TONY LICHT: And depending on the number of hybrids or varieties they’re planting, sometimes if it’s planted on a small amount of acres, they completely forget about it. I mean, you think about the larger-acre hybrids, and it’s like: “Oh, I forgot about those new ones I planted. How did they shake up against the rest of my line?”

RENEE HANSEN: I mean, you’re talking about expanding beyond the operation, in a sense benchmarking against other areas or like areas. Can you explain or elaborate a little bit more about how Premier Crop utilizes the hybrid and variety selection with data? What does that potentially look like? Or what is the conversation with the grower?

DAN FRIEBERG: Renee, it’s kind of unlimited sorts. Initially, a lot of people might focus on soil types. If they have dominant soil types, it might be just hybrid and variety performance on different soil types. In some markets, for example, pH can be a huge driver on soybeans. High-pH areas or low-pH areas can have a huge swing, and varieties respond differently in those environments. Those would be two examples of how people get started, but they probably don’t stop there. They look at things like planting date or harvest date. So, if you’re a large operation, what inevitably happens is you end up with some fields that you know are going to be harvested last. So, for those numbers, Renee, they might drill down on late-harvest data. They’re trying to pick numbers that they know will stand and hold the ear late into harvest because some field has got to be harvested last, and a lot of growers literally plan. They plan their harvest by the way they plan their planting. There are certain fields that are always going to get planted first. In the case of harvest, there are certain fields that are going to be taken out first. It might be the ones that are closest to the bin site. They want to get the bins. They want to get the dryer going, and so there are certain fields that will come out early. A lot of times, those fields that come out early will probably get more of a racehorse number that doesn’t have to stand. It’s the highest yield potential because they know they’re going to get it before they get very far into harvest.

profitability by hybrid or variety

TONY LICHT: As-applied fertility can also be another environment they may want to look at, as well. How did I treat this group of corn hybrids differently on as-applied nitrogen, maybe split treatment or in-season treatment, versus just “all in the fall” kind of a concept? Are there differences amongst the hybrids and varieties now? How did they react to the environment they were in, whether it be as-applied fertility or soil test fertility?

DAN FRIEBERG: What we do is just adding another source of analysis to what a grower considers. A lot of times, their decision is if something did exceptional for them, they’re probably going to plant it again, obviously. They’ll look beyond their own operation to see and make sure it wasn’t a fluke or see how it held up in other environments. One of the advantages we have is that we can tend to see the hybrid and variety performance in different growing environments in the same year, meaning that you might’ve been in a really dry area, but you can go look and see how it did in a normal area. Or you happen to be unfortunate and you got hit by the wind, and so, sometimes, you want to jump out of your area because your own data isn’t as meaningful, just because you had something that happened that didn’t make your data quite as useful.

TONY LICHT: I was just going to say that’s a great point. Case in point: the wide area this year that got hit by the derecho. Those folks don’t lose data for a year. They still have the ability to build on data, albeit from a little bit further than their real local geography. It might be from 20 miles away in an area that was not hit. It could still be considered a like-agronomic environment.

DAN FRIEBERG: There are really big dollar swings because we’re measuring the economics and the agronomics. The reason people focus on it a lot is, at the end of the year, there are just really big dollar swings on a per-acre basis. It could easily be a 100 dollar-per-acre swing in return to land and management or what we call yield efficiency. You can just see really large swings. When you start analyzing that way, from my perspective, it probably leads to having a strategy where you call more aggressively. I grew up on a livestock farm and the term “cull,” “culling the herd.” In the livestock industry, you’re just constantly eliminating the low producers. When you’re making genetic selection, you’re eliminating the bottom 20 percent or whatever. In the case of hybrid and variety selection, I think, sometimes, we need to be more aggressive about calling some of the poor performers out if we’re really focused on trying to drive the highest returns.

Yield Efficiency Score

RENEE HANSEN: You both were talking about data. Can you elaborate a little bit more on the data features that Premier Crop measures hybrid variety with?

TONY LICHT: Everybody always thinks of just yield by hybrid and variety, but there are a lot of other attributes that come along with that hybrid: relative maturity on the chemical resistance or the seed disease resistance, as far as rootworm traits, non-rootworm traits. All those things come along with it. So, the conversation goes beyond not just a yield by hybrid, but maybe there was a specific trait that really helped drive yield, or a certain plant date helped drive yield. What are the trends I can see across my farm from a given year, and then also across a series of years, as well?

DAN FRIEBERG: Over the years, you’ve lived through some of the trait issues, just where we had areas where the rootworm trait wasn’t holding up. We ended up going through several years where needing a rootworm insecticide was a big part of the strategy and a big return for growers.

TONY LICHT: Absolutely. As a grower, do I need to do a double approach here? Not just the trait, but seed-applied insecticide, and where? And what can I expect from those people that have been utilizing that? What has the success rate been for them, to determine immediately, like: “Okay, well, here’s kind of a return on investment I can expect to get back out of this.”

DAN FRIEBERG: The trait thing probably also comes up as people shift in herbicide strategies. Renee, people would use the data to try to quantify differences in herbicide if they’re considering Liberty or if they’re needing to rotate strategies from any kind of a pest management or weed management strategy. That’s another piece where they drill down in data a lot, just to try to find the best performing genetics, as they’re switching strategies.

RENEE HANSEN: So, what would you say is the benefit to having all of this data to a grower who is utilizing Premier Crop Systems versus somebody who isn’t?

DAN FRIEBERG: It’s even the growers we work with, Renee. We are one part of how they make decisions in the seed world because, a lot of times, they have seed sellers who they really trust. They have long-time relationships in local communities with seed advisors. So, a lot of times, the seed advisor is there, too, and most growers will want to plant 20 percent of their acreage to something that’s new because every year there are new genetics coming out. Unless it’s been planted commercially, we don’t have any data on the new numbers. A lot of times, that’s what happens. Their local seed advisor or seed seller is positioning what they know about the new genetics from plots and what they’ve seen in small quantities as it got planted in the pre-commercial years.

TONY LICHT: A team can definitely help that grower out. We’ve always said that agronomy is local. So, that local knowledge with that seed advisor, combined with a lot of data points from a given area, can just help amplify the value proposition for the grower in getting the right seed on the right acres.

RENEE HANSEN: Yeah, and since we have a lot of data in our system, we clearly have seen. Over the years, with all of the data in our system, have you seen trends? And what are they?

TONY LICHT: There have definitely been trends in certain geographies of a stronger yield correlation by later maturing hybrid. But within that, there are all these “gotchas,” where there are a few early-season hybrids that perform within those environments very, very well — whether it be later maturing hybrids going further north or earlier maturing hybrids going south. So, definitely looking at not just a multi-year, but looking within and across those different years individually, trying to pull out those trends of what hybrids can be moved around either north to south to accommodate diversifying a grower’s portfolio.

DAN FRIEBERG: In the early years, you could literally see in the data. Sometimes, when companies had trouble with trait insertion, the non-traited versus the traited, you could actually see a yield decrease. I mean, companies are getting way better at that. I don’t think it’s as big an issue as it might’ve been in the early years.

TONY LICHT: When new traits come to the market, growers will definitely want to ask the question: “How do the new traits compare to my existing operation? Or how much more do they bring to the table for me?”

DAN FRIEBERG: Growers drill down on that really quick because what tends to happen is new traits come at a price. Usually, the company is wanting a premium for them. They’re trying to weigh that. Is that extra seed investment worth it? Am I actually getting a higher return?

RENEE HANSEN: Can you talk a little bit about yield efficiency — and Dan, you did elaborate on it a little bit — and how developing and making a selection for your hybrid or variety, how that can attribute to your yield efficiency score?

DAN FRIEBERG: Yield efficiency is just the dollar-per-acre return to land and management, meaning, after you’ve paid for the seed and nutrients and crop protection and field operations, what’s left. From a seed perspective, Renee, it comes down to: “What was the price point? How much did I have to pay for the seed?” And then, probably, the next piece is: “How could I manage the seed?” There are some numbers that just have a lot of flex, meaning they’ll flex ear size as based on population. So, in a highly variable field, that might be a great strategy, just something that will really change. In other words, you can plant at a lower population, and if it’s a good year, you won’t take a yield hit. Versus a fixed-ear number, they’re really responsive to populations. It’s just even a bigger factor. Some numbers just require more. In order to produce at the top end, in general, you need more. You need more plants, but some numbers seem to be able to flex more than others. So, that goes into yield efficiency because if you can plant a number at a lower rate and still achieve the same yield, you could potentially add 10 or 15 dollars an acre in return.

TONY LICHT: To build off of just reallocating your rate around the field, as planters become more sophisticated, we can reallocate which hybrids go on which part of the field, assigning hybrids to zones or soil types and at different rates, as well. We’ve got a different cost point of the hybrid and a different rate to maximize the ROI.

DAN FRIEBERG: We have a lot of growers in the system that are doing multi-hybrid or multi-variety planting. Do you think that’ll continue to grow? Where do you see the trend on it?

TONY LICHT: We continue to be in a discovery phase with that, of trying to figure out the best placement of hybrids, the different rates of hybrids, like those treatment blocks behind you in your background, Dan. ELBs accelerating the learning of rate and also placement of hybrids helps us versus single-rate testing year over year. We definitely continue to try and find the bottom of the soybean population, but the issue with that is, all of a sudden, it becomes an unemotional decision. That’s at times looking at data points in January, February, March, but all of a sudden, sometimes, it becomes a little bit of an emotional decision in season. If I feel confident in the data in January that I can drill down a seeding-rate population to 120 or 110 or 100 thousand, and, all of a sudden, I might get cold feet in April. If it happens to be a really great spring, and we can get out and plant early and do everything we want to do early, all of a sudden, it may be an uncomfortable situation of: “Boy, I don’t know if I have enough. I don’t know if I have enough information on planting this lower rate this early. Maybe for safekeeping, I should just turn the population back up just a little bit.” So, it’s trying to balance the emotional decision versus the data decision back in the couple previous months to really drive and find the bottom of where we can go on populations. It’s just the same way in corn, in soybeans and corn. As far as wheat, how much we want to sow. I think everybody kind of knows where the optimal rates are, but where are the extreme rates, the highs and the lows that really maximize that yield efficiency?

seed yield efficiency

DAN FRIEBERG: I get copied in on a lot of the trial results. I’ve seen some 80,000 seed drops on soybeans that just did exceptional, and they were learning blocks or replicated trials. It really gets your attention because if you start trimming 50,000 seeds, and you get a higher yield, it really drives the dollars really fast.

TONY LICHT: Seed treatments and soybeans have really, really helped us drill down, I think, our populations, as well. We’re better protecting that seed to ensure that every one of them matters more to get up and out of the ground in a timely fashion.

RENEE HANSEN: Yeah, ultimately, driving up that yield efficiency score, helping growers profit more. Thank you guys for joining us today. So great to see you, so great to have you, and we’ll be back again. Thanks for listening to the Premier Podcast, where everything agronomic is economic.

What Does a Year End Meeting Look Like with a Premier Crop Partner?

“We use SciMax Solutions, a Premier Crop partner,
to push everything we can
in order to get the best ROI
and try to do the best job that we can.”
– Mike Myers, Waukee, IA

PETER BIXEL: I’m Peter Bixel, SciMax Team Leader, and today we’re working with two of our clients, down here close to Des Moines, Iowa: Dale Meyer and Michael Myers. And I’ve been looking at their information, reviewing 2020 data this year and planning for 2021.

MIKE MYERS: I’ve been working with Peter and SciMax for, I think, around seven years, something like that. Time flies. I work with SciMax to help push us to the next level. It’s a really good precision ag database that they have, and adding VRT into our operation was a big part of that, using our yield data and going into our management zones and pushing the best acres as far as we can. We haven’t pushed them as far as we can yet, and that’s the goal for the future. It’s to push everything we can in order to get the best ROI and try to do the best job that we can.

DALE MEYER: Before that, we were doing zone management for fertility by soil type. I mean, there was soil sampling, but it was, more or less, by the lay of the land and soil type. With the local co-op, we went to larger five-to-seven acre grids. They would spread it by areas, more or less, not necessarily by GPS but by a map.

Farm data for ROI

MIKE MYERS: Our precision ag and farm data was pretty rustic, overall. You just kind of guess where you were in the field. The biggest thing that helped us change was implementing yield data. As soon as we started picking that up, we needed something to do with it. Otherwise, what’s the point of getting it? Peter did a talk with Latham that made a lot of sense to us, that we could compile the yield data with our fertility, soil sampling, soil types, etc. And the biggest thing that he’s helped us with is to realize where we’re lacking, where we’re putting too much fertilizer on. I mean, it’s not a coincidence that our best yields have been over the past few years using SciMax’s precision ag tools. Now, you have to have the weather to do that, but without SciMax’s help, we wouldn’t have averaged 240 as a farm average last year on corn. It probably would have been 210, 220, like your average farmer in the area would have been. But with us doing the extra things and managing better with their help, we were able to get more return. More or less, we’re not at the beginning of this, but we’re starting to take the steps that’ll start pushing us even higher, I think. It’s not something in that we implemented everything right away, but we’re implementing some things more and more every year. We’re trying to build our soils on fertility-level more this year than we have in the past. And looking at the farm data he gave us today, I mean, if we continue the trend of what the farm data is saying, then that should pay off. Peter’s a really good guy to work with, too. There are other people that offer precision ag or something like it, but Peter’s the thing that kind of puts that all together, as far as SciMax marrying with Premier Crop and then bringing that to us. If he was a different person, I don’t know if we’d still be with them or not. I don’t know, but he’s keeping us for sure.

DALE MEYER: I think it’s safe to say that the majority of the farmers of my generation operated on a status quo thing up to a point. Then, the yield monitors came in to where we could see: “Oh, wow. I never realized that the wet spot was affected so much by the excess water.” So, a lot of tiling has happened because of that, and then, also, the fertility side with different soil types. In parts of the field that are high yielding, we were pulling a lot more nutrients off than we thought. I guess, maybe, we just didn’t even think. Precision ag kind of sharpened everything because you didn’t really know the advent of the yield monitor, as well as grid sampling and other things. Hybrids have improved, there’s no question about that, but, all in all, we’re doing a better job. We’re doing a better job of planting, as far as placement, depth and spacing, but particularly depth, or emergence at the same time. It’s easy for the seed companies to take a lot of credit, and they deserve a lot of credit, but the farm equipment’s and farm data management changed this picture a lot, too.

PETER BIXEL: Well, I think, studying the hybrids and placing them where they need to go makes a big difference, too. Before, maybe, if you were my partner, you just buy: “Yep, these three are good.” The dealer sold them to him. Where did you plant them? “It didn’t matter. You just plant them wherever you want.” No, there is a difference. You know that, Michael.

MIKE MYERS: Yeah, I guess for me, as far as all this, it’s all that I mentioned a little bit. Getting yield maps gives you a picture of what happened that year, and then making that into managing the zones, that shows us what has happened over many years. I mean we have a memory, but we don’t have a the farm data memory where we can go back and say: “Okay, this area of the field did this, and, on average, it’s kind of been a B area. Or it’s a C area or an A.” We can break that down, and then we can also look at the fact, and I mentioned it too, as far as fertilizer, where: “Okay, what did the field make? Did it do 200? Okay, we’ll put a flat rate of crop removal of 200 across the whole field.” Well, that’s not the truth. The truth is that the poor areas did 160, the medium areas did 200 and the high areas did 240. I mean, it varies, right? But that’s kind of the idea. I, over the past several years, have really been putting a lot of thought to the fact that I would really like to see what our yields would be today if we would’ve started doing precision ag and variable-rate fertilizer five years ago because what we’ve been doing is taking off 240-bushel corn on a good area and putting 200 bushels of nutrients back on. So, we’re stealing away from our good areas and adding to our poor areas. In those poor areas, you’re never going to yield what the good areas are going to do. So, we can better utilize our money as far as our investment into fertilizer, and then that should pay dividends in ROI and harvest time, too. That’s one of the biggest things, I would say.

PETER BIXEL: Their retailer in the past wasn’t able to really do the field history either, so now they’ve made a big change and adjusted things. Including adding strip-till.


CREATING NEW MANAGEMENT PRACTICES FROM FARM DATA

PETER BIXEL: We’ve come up with tissue sample ranges by stage for corn and soybeans on each nutrient. So, this is that line, and then, basically, it’s just the group average zone, all we did overall here. You’ll get yours with this graph, and then we’ll always plot their individual data on here. It’s kind of interesting. I mean, we’re pretty close to the limit. We tracked pretty close on nitrogen. Really, we weren’t that far off comparatively.

MIKE MYERS: I’d like to see the guys that did the KTS. Can we group that data and look at it?

PETER BIXEL: Yeah.

MIKE MYERS: Our application was right at V5, V6. So, we gained more stalk, but where is manganese?

PETER BIXEL: Right here. (pointing to the field map on the computer)

MIKE MYERS: My manganese went through the roof, like right in there. I put it in with the KTS. Then I put that Versa Max, and that’s got manganese in it, and I took my manganese levels from like 80 to 100 clear up into 140s, and they stuck around until probably V10. I graphed it all out myself. Let me grab it. I think I got a pamphlet right here.

Using precision ag to look at tissue sample data

TISSUE SAMPLING

PETER BIXEL: Well, we’re trying to define trends for just seeing what the plants are telling us. It’s no different than a blood test, which you could say: “Well, that’s overkill.” Yeah, but the plants, the weather and everything change so much every stage, depending on the growing season. Like there in the middle of May, we didn’t hardly gain any GDUs for like two or three weeks because it was just cloudy and cool. Then, we took off, and we were growing like two stages from V4 to V6 in five days. The nutrients change by that stage. It’s kind of a way to gauge where the plants are at. Michael’s been pulling two different farms, and you pull in an A zone and just kind of track and see what they’re telling us. Not everybody, but the majority of us, will go, and apply what we feel the plant needs. Then, like he’s looking now to see: “Okay, if we applied zinc and manganese right before this tissue sample, and we applied it and we came back a week later, did we see the uptake?” Did the plant tell us they got it? Like my zinc and manganese, I think it took like about two weeks, two sampling times, for it to really uptake. For my potassium, I’ve got to look back. I can’t remember this off the top of my head. I think it took about three weeks because potassium is mobile. It takes water to get it down the soil. We didn’t have a whole lot of moisture, obviously, but Michael and I Y-dropped to put it next to the row so it would hopefully get in faster.

MIKE MYERS: Yeah, I just remember on the home farm, on the treatment out here, that the manganese just went through the roof. So, I know I can raise those loads.

PETER BIXEL: Manganese has been one that we’ve kind of struggled with, especially later on, but this year. I think some of it was due to the dryness, too. We didn’t have as much water as the last two years. So, it wasn’t flushing it through this profile. We were able to keep reasonable. The black line is where we want to be at, and you can see that. You got the polynomial or you got just the average of the polynomial for our group, and so we were able to stay a little bit better on that. The other thing, to me, that was pretty interesting was how boron’s been. If you look at the past years, we’ve been just horrible. We just tanked on boron. We would never come back up to where we’d like to be at but this year. Some of this, too, I believe, is we’re getting a lot more guys that are throwing boron in with their fungicide. Not everything, but some of that’s been helping bring those levels, I feel as a group, at least, up. We stayed pretty good, and the reason I think we stayed good on boron is that it’s mobile. We didn’t have rain. We didn’t continuously keep flushing that deeper and deeper in the profile. I think we’ll talk and see what everybody thinks next week. We can quit at like V10, V12, just because nobody’s been significantly doing anything different after that point.

PETER BIXEL: I know it would have because look at what you did last year. So, Michael and Dale, they’ve been doing some different stuff last year. It definitely showed, I think, good stuff for all your treatment, boron and zinc already, and things like that. I guess it kind of tells me they weren’t, I wouldn’t say, normal conditions. They had more rain than you but not normal. I guess that just tells me that we’re still going to keep playing, but we also learned our normal standard practices. It’s probably still a benefit if you’ve got that one limiting factor, whatever that is. It’s potassium in their case. He said it was like 130 to 140 parts per million. Spend the money on it. Get the foundation built. Then, you can start to worry about wider operation or extra phosphorus.

MIKE MYERS: It just goes back to that. Every time we plant a seed, it’s got its maximum potential, and as the season goes on, that lowers, lowers and lowers. Well, with potassium, and I’ve thought about this a decent amount, it’s more important than about every of the other major ones earlier. Maybe phosphorus is there, too, but as far as potassium, most of its uptake is V6 to 12-ish. Phosphorus, sulfur and, obviously, nitrogen are all after that. So, which of the four biggest nutrients is going to pull our potential down the most in that first, until V8? Well, it’s probably potassium. So, if we don’t have potassium there, that potential is already capped.

PETER BIXEL: Correct. You can put on as much nitrogen as you want if you think it’s efficient, like you said. After that fact, it doesn’t matter because K has got to be there to move it up in the plant. When you grid sampled and then started doing the strip, I think it’s good, especially with what we’re doing and trying to build the 250 and stuff that we’re doing on the farms and using the management zones. I’m trying to continue to build that. On your beans this year, with new soil sample data, which is not the best year in yields and stuff like that, you were at 144 parts per million of potassium, and you went to 176. Pretty steady increase and a direct correlation. We saw that, yeah, you went from 27 bushels to 57, a 30-bushel acre advantage.

MIKE MYERS: On just a 30 parts per million difference.

PETER BIXEL: Correct. So, I think as we sample some other farms — I don’t think everything got sampled. I can’t remember the majority of stuff, but as we get the new stuff on the rest of the farms, it’ll be interesting to see. That was something I pointed out where, like you said, potassium, and we see this with a lot of clients, at 22 to 26. Not really a huge correlation.

CORN ON CORN FARM DATA

MIKE MYERS: I was really impressed with how I did this fall corn on corn over here, and we vertical tilled at first. Well, we did that, so we could put anhydrous on.

PETER BIXEL: How deep did you do the vertical till?

DALE MEYER: Through May, three to four inches.

PETER BIXEL: How deep was the strip-till in?

MIKE MYERS: About four to five. It can go six, just depends.

PETER BIXEL: That’s why I don’t think our lows aren’t as low. Maybe that’s some of the genetics or fertility, things like that, too.

MIKE MYERS: We’ve mentioned we have more potential on all of our corn going into July, except our corn-on-corn. It’s awful. Yeah, there’s a pond right there.

PETER BIXEL: Our corn-on-corn, for the group, averaged 165. Our first-year corn was 190. So, that tells you that we haven’t seen that big of a spread between those two for a lot of years.

DALE MEYER: We’ve not had this consistent-looking crop at harvest time on corn-on-corn ever, that I can remember.

MIKE MYERS: As far as spacing and the beans being there.

DALE MEYER: We had a good growing season, but that all started when it came up.

PETER BIXEL: Well, we didn’t have a lot of wet feet in great conditions, like you said, to come out on soil. You only had nine inches. With the weather Premier grabs, nine inches of rain is all I had. This area is definitely the lowest.

MIKE MYERS: Probably over half of that came before July 1st.

PETER BIXEL: It came before June. He keeps track of some calendars. He’d have every rainfall.

DALE MEYER: The people that run the auction over here at Guthrie Center, what did he tell him?

MIKE MYERS: He was worse yet. What was it?

DALE MEYER: They only had a couple of inches all summer.

MIKE MYERS: We had about an inch, an inch and a quarter in July, and then about the same in June. They didn’t even get an inch in either of them.


Make sure to listen to the Premier Podcast, where everything agronomic is economic. Please subscribe, rate and review this podcast so we can continue to provide the best precision ag and analytic results for you. And to learn more about Premier Crop, visit our blog at premiercrop.com.

Improving Farm Efficiency with Nutrient Planning

Our approach to nutrient planning is based on the fact that we want to allow our advisors, partners, and growers to get ahead when it comes to planning for the next crop season. Some advisors are having this conversation early, even before growers start combining in the fall. As we dial our focus on helping growers create a plan before the growing season begins, we look at several things. Using a spatial soil sample as one of the foundation pieces is a large part of what we do. A spatial soil sample could be a grid sample where the field is divided into smaller sizes, giving you a number of samples within a field, two-and-a-half-acre grids are common in most areas. In other areas where the field is divided into zones, zone sampling can be driven by soils, historic imagery, or EC conductivity. Instead of capturing one sample for an entire field, they’re capturing more intense, site-specific samples. Layering all these samples into one computerized system and letting data science derive the factors for you helps, rather than trying to figure it out on your own in those frustrating excel sheets.

Soil Layers-01

We understand that with all nutrients, a combination of soil-supplied nutrients and the soil foundation feeds the crop. This means there are nutrients in the soil that are released to balance what the soil supplies to the crop versus what a farmer applies with manure or commercial fertilizer. But we don’t stop with only the soil sample and management zones. Another piece of what we do is use yield files to capture the actual nutrient removal rates. A farmer is capturing yield data every second they go across the field and we are able to calculate the phosphorus and potassium removal off the yield file. Not many other companies do this, because it can be difficult to export the yield file from the growers system. We believe this is the differentiating factor that leads to better yield efficiency and maximizing profits.

We then divide fields by productivity level because we believe we’re able to define some areas of the field that respond to more nutrients. We generally have a different equation for each productivity area within a field. Other companies will go to the grower with three different equations priced out with nutrients and have the grower choose just one. We believe this shouldn’t be a “one size fits all” approach, though. A grower shouldn’t have to choose aggressive versus conservative for the whole field. Having more complex equations is a big part of what we do, and this is why we believe you can treat parts of the field aggressively and parts of the field more conservatively. It makes sense to us that some areas of the field just respond more to nutrients than other areas of the field, and we want to take advantage of that. Again, this is another example of how we use our data science to calculate all the layers of data to create a customized prescription for your field. We are also able to test right rate technology using our Enhanced Learning Blocks®, using statical confidence to prove the best rates in the field.

data science farm trials

When you think about the rate of nutrients that should be applied, how do you make your final decision? You know that agronomy is local, meaning it is important when giving site-specific recommendations, to pay attention to every field, specifically each different productivity area within each field. This makes it important to create unique prescriptions by putting trials in growers’ fields. It really doesn’t get more local than using your own fields. These trials are scientific trials within each part of each grower’s fields, using analytics and data science to inform our recommendations. Each trial has replications of different rates in different areas of a grower’s field to statically understand where in a field the best rates win.

The goal is to produce yields efficiently and profit as much as possible. When we go into areas where a grower hasn’t been soil sampling or doing variable rate nutrient applications, we typically find that the lowest fertility areas are the highest yielding. These low fertility areas come to be because the high-yield areas have mined down the nutrients from the field being treated uniformly. Growers will tell us, “I put the same blend on every acre, and I’ve done it for the last 10 years.” However, the problem is that they haven’t been removing nutrients as uniformly as they’ve been applying them. Those consistently high-yield areas have pulled down nutrients, and the consistently low-yield areas have allowed nutrients to build up in the soil. We capture that when soil sampling, which can be a foundational piece. We also find the areas that are consistently higher yielding are hard to keep up with. The more that certain nutrients are applied, the better the yield. We never try to even out the field and make it one color on a soil test map. The question we ask ourselves is, “How do we generate more dollar return for every dollar we invest within those areas of the field?” If we never catch up soil test-wise, it means we keep producing better and better yields as efficiently as possible.  It’s not uncommon for us to see 80 to 100 dollar-an-acre swings by single nutrients.

Screen Shot 2021-01-28 at 2.11.44 PMNutrient Planning-01-3

When growers realize there are that many dollars in play, it leads them to want to do better. We’re constantly surprised at how much yield response we’re seeing by being ultra-aggressive and applying a high rate. We’re just beginning to understand and to tap into what’s possible.

If you’re interested in taking a step towards highly analytical planning for the crop year, contact us today. For more information about nutrient planning, check out our precision ag conversations on the Premier Podcast.

Why You Need a Farm Plan

It takes a great deal of effort to plan appropriately for the upcoming crop season. It isn’t easy to be successful, and it definitely takes some time. There’s an old saying that says, “You plan your work, and then you work your plan.”

TO BE SUCCESSFUL, IT’S ALL ABOUT GETTING ORGANIZED AHEAD OF TIME. 

One of the big benefits of being a great planner is directly related to buying opportunities. This sets you up to determine when to buy certain products during the year. The plan is not just what’s going to happen agronomically to set you up for the next crop year but, also to factor your budget, and your cash flow for those buying opportunities.

When I work directly with farmers, I always ask the same question: do you plan before you buy, or do you buy before you plan? An overwhelming number of growers say they buy first. There’s this pressure of getting in early and taking advantage of the early program discounts. They speak for and commit to a product, and then do some detailed planning with the products after they’ve purchased them. Some people think crop protection is an area that is difficult to plan. I don’t believe that’s true. It’s really easy to develop a crop protection plan. You need to do some evaluation of what worked and where you have escapes. 80-90% of your crop protection could be planned a year ahead of time because you know what weeds escaped. You can plan to tackle them next year, as you go into crop rotations.

Weed resistance doesn’t happen overnight, so growers can get a feel for that fairly quickly. We went through a decade where we didn’t have weed resistance, which made crop protection planning much easier than it is now. We only had to think about how many ounces of glyphosate we were going to use. It’s really changed since then, but most of it can still be planned. Having a great plan lets you take advantage of prepay opportunities, or the right pricing opportunities.

How do you prepare to plan? What data is relevant, as you think about planning your next crop year? What’s the relevant amount of data that I need to start planning?

In our case, we manage fields based on different productivity opportunities within the field. We create specific zones where you can be more aggressive or less aggressive. It’s important to have some kind of a spatial soil sample where you’re capturing pH changes and organic matter changes. Nutrient changes throughout the field are a significant piece of soil tests. A certain percent of the acres are getting re-sampled every year, so that information is constantly being updated.

grower in soybean field

One of the myths many growers believe is that planning is a single event. But this is not what we’ve seen from farmers who are effective planners. It is truly a multistep process. The best way to explain it is to use an example.

When you talk about planning with farmers, one thing they’ll say is: “It’s all weather dependent, and I can’t plan. Nobody can predict the weather, and I can’t plan because I don’t know what the weather is going to be.”

I’ve found that people can generally plan around weather. Think of it in terms of nitrogen management. With nitrogen management, there are a lot of weather components involved, but many growers plan their nitrogen program to have handoffs during the year. Timeliness of field operations is a large part of this. Growers in heavier soils want to do some nitrogen application early because it takes the workload off. They’ll do some nitrogen around planting time in order to have something immediately available to the young plant. At different places, you’re handing the crop off to different types of nitrogen applications.

2020 was a great mineralization spring where everything warmed up. We had adequate moisture and everything took off. Most likely there was planned side dress that didn’t happen because it wasn’t needed. As a grower, you need to avoid being reactive. There’s a certain mentality around: “I’m going to take a picture of the field through an image, and identify through the image the areas that need something.”

By the time the crop tells you it needs something, it’s too late. You’ve already lost yield. If an image tells you that the crop is denitrified, it’s not that you shouldn’t address those denitrified areas, but you’ve already lost yield. Our goal is to never let the plant have a bad day. That’s what high yields are all about. From start to finish, you want to execute a plan where the plant never has a bad day. That’s how you maximize yield and yield efficiency.

For me, success rides in the details. As part of that detail, we need to get out of the mindset of treating entire fields as though they’re the same. There is so much variability within fields. If we’re going to drive higher return to land and management and a higher dollar return, we need to focus on where and how much we invest, how we treat parts of fields differently, and how we treat fields differently from one another. They’re not all the same. Managing that variability is where the big dollar returns come in. We have single decisions that are high dollar-an-acre net swings for growers.

yield efficiency by management zone


YOU CAN’T MAKE “COMPLEX” SIMPLE, BUT YOU SURE CAN MAKE IT EASIER. 

Growers feel more in control when they have a plan. When you feel more in control, you have more peace of mind. Right now, I think we can all agree that the world seems pretty out of control. Last year we found out how much our food production system is a “just-in-time” delivery system. There’s a lot of “just-in-time” everything, and that’s all detailed planning and logistics. It’s an amazing system, but right now, having a better plan in really tight financial times just gives you more control and more peace of mind. It’s amazing how over the years I’ve witnessed growers plan seed around the destination of the grain. They plan what to plant based on where the grain is going to end up. They have fields they know are going to be the last to be harvested, so they are picking hybrids that have terrific standability and retention, and can stand until very late in the fall. They have fields that are coming out early to fill the grain dryer, or they’re chasing an early ethanol bid on some fields. Everything is planned for details that are typically very “plannable”, but it all comes down to thinking ahead. We have growers who plan manure applications two or three years ahead of time. They’ll contract with a turkey litter company very early on. They know that every few years they’re going to get access to a certain amount of litter or manure, so they plan that far in advance. It’s impressive how these growers plan rotations around this. The ability to manage details and use data to drive confident decision making is a skill that takes great attention. Our planning tools allow you to see an overall summary to give you a high level snapshot of your seed, nutrients, crop protection and operations.

Many growers are sitting on a bunch of historic yield data. At Premier Crop, we can put that to use immediately. Many growers haven’t made decisions off of what they have, so they like the idea of being able to take advantage of the data they’ve been collecting for so long. We generally grab the current planting data and applied fertility data right away because we’re focused on getting a benchmark year started immediately. That way we can establish a baseline year and judge and mark ourselves by how much we improve yields and yield efficiency. It’s never too late to get started putting your data to use. Making use of what you already have is a great starting point.

Get in touch with a Premier Crop Advisor here to get started making data driven decisions today.

Measuring Success With On-Farm Planning

As a grower, you’ve most likely asked yourself, “How do I improve my operation’s performance?” Defining success is an important first step towards improving performance on your operation. However, the definition of success has evolved over time.

In general, growers understand that in order to drive higher profitability, they need to drive higher yields. Higher yields are key because row-crop farming is a high fixed-cost business. Before you plant a crop, most of your machinery investment is locked in. Land cost, whether you own it or rent it, is by far the biggest fixed cost. Whether you produce 100-bushel corn or 200-bushel corn, or 50-bushel wheat or 80-bushel wheat, it doesn’t matter. You’re still left with many fixed costs. Producing more bushels is the only way to drive your cost down. Because of this, yield has become the surrogate for profitability.

We know better, though. We know that all yield isn’t created equal. Farming isn’t all about yield, it’s about how efficiently we produce it. It’s how many dollars we’re able to return to land and management.

I was speaking with a friend who is a professor in agriculture. He told me, “Real-world agronomy isn’t rocket science. It’s way more complex than rocket science.” His point is, we put someone on the moon with what would be the equivalent of a PC, or a laptop now. Real-world agronomy is super complex because it’s this interaction of all kinds of different biological factors, including the weather, soils, fertility, seeds, and genetics.

The reason we make the agronomic decisions we do is because we understand there’s an economic impact to them. We argue that agronomic-economic complexity is very spatial, meaning it’s changing within fields. There are parts of fields that are begging to be managed at a higher level, while there are some parts of fields telling us we need to quit wasting money there.

We have this division happening between different ag technology start-ups. We have precision ag, which is more agronomy focused, and we have farm management information systems, which are arguably more economic focused. Growers are having to choose between 1. Am I going to focus on subfield agronomy? Or 2. Am I going to focus on field-level economics? Of course, our answer is that you don’t have to choose. That’s what we’re about; combining those pieces together. Our solution is not one or the other, it’s both.

At Premier Crop, we’ve been doing this a long time, and I’m convinced the reason every grower doesn’t do what we do is because of the precision aspect. No one else has shown the grower year after year that this type of management pays. If we advocate or advise the grower to spend more money in the best part of the field, at the end of the year, we’re not having a “trust me” it works conversation. We’re providing the dollars-and-cents analysis to show that they saw a higher return. A lot of times, they’re spending 30 to 50 dollars an acre more on inputs in the best part of the field, but also generating an additional 80-dollar return to land and management beyond that input spend.

GROWER YIELD EFFICIENCY ($/AC) VS GROUP

Screen Shot 2020-11-18 at 1.58.15 PM

There is no doubt we need to continue to push higher yields. The times right now demand that growers scrutinize every dollar spent to get a higher return. It’s imperative that we be keen on how we spend every input and every input dollar to get that higher return. You may cut costs in some parts of fields, but we can’t always promise that you’re not going to spend whatever you save. Sometimes you’re going to spend extra in the best part of the field. The point is, we have the ability to prove and deliver a report card on every field that says it paid better than if we had flat-rated it and pretended it was all the same.

breakevencostperbushel

We talk about having 400 layers of data at a subfield level, and people just think we’re crazy for handling the complexity of all those data layers. There are so many things that change within fields, though, so what matters varies within different parts of the field. In our case, we have a lot of spatial soil sampling. Instead of just doing one sample that represents the entire field, we’re capturing differences such as organic matter, pH, and fertility. There could be a couple dozen layers captured that way. We capture as-applied fertility, which is more complex than people think because there are growers who would apply nitrogen in five different ways. We capture rate, source and cost, so those are all sortable data layers that can be analyzed. We have around 15 layers from the planting file:  population, density, seeds, and hybrid and variety are just a few. There are hundreds of layers that aren’t necessarily captured on a monitor, but they still really matter. Manure is a great example of this. There are still many manure applications that have a huge impact, both agronomically and economically, and they’re not always captured on a monitor. There’s also input capturing the real cost associated with all this. It’s quite a bit of detail, but do this because it’s the most meaningful.

Things you measure tend to improve. So, if you don’t measure it, does it have any chance of improving? It goes back to being intentional and having a goal. That’s what we do with growers we’re working with. Every year, there’s a goal-setting discussion about how we are going to measure success. Some growers want to drive yield efficiency. They want to drive higher returns, so that they can hire some help and their family life can improve. They can have more time with the family because they’re able to afford hired labor. Others want to expand their operation. Everybody’s got slightly different goals, but usually, it comes down to the fact that they’re business people, and they want to generate more returns or hold their operating capital in check.

The reality is, the definition of success is different for everyone, but profitability matters. Having a business, whether it’s farming or anything else, everybody’s trying to make some money. Measuring the right parts to drive operational growth and profitable growth is so important.

Get in touch with a Premier Crop Advisor here to get started making data driven decisions today.

Six Frustrations with Precision ag

“Growers tell me they are frustrated with precision ag, they’ve invested in the technology. I tell them, ‘You just want to put the pieces of the puzzle together to see exactly what the picture is.’ And they are relieved when Premier Crop can help.”

– Katie McWhirter, Director of Training and Development


RENEE HANSEN: Today, we’re talking with Katie McWhirter, our Manager of Training and Development. Katie is chatting with us about the frustrations of precision ag.  Katie, tell us a little bit about your background and a little more about you and your role at Premier Crop?

KATIE MCWHIRTER: I was born on your typical farm in southeast Iowa, livestock and row crop. My father’s just now retiring, but funny as he is, he is in his late sixties, and in 2013, he invested in electric drives to be able to variable-rate seed. He variable-rates his fertilizer. He does all that, which is so not what people think of that generation, embracing technology like that, but he knew that, working with me, he’d be able to make use of that equipment that he was investing in. Then, on the flip side, I have a brother who was, I guess for lack of better words, gifted or brought into the row crop world. He’s actually in the livestock industry and doesn’t have that technology, but we started talking one day, and he said: ‘I think I can use my data to do better. It’s not that good.’ So, talking with him, does he have the latest and greatest? No. But, again, his data is everywhere, and it’s just meeting him where he’s at to say, okay, I realize you don’t have this technology or this technology, but we can still use what you have to make a better decision. Even as recent as about an hour ago, I’m entering in some of his costs and his inputs to really make him see that there is variability within his operation even at a field level, which means profitability is variable at that field level. So, I’m excited to watch his journey as he gets more into this space.

20210405_170325

FRUSTRATION #1: CONNECTIVITY

RENEE HANSEN: So, Katie, what would you say? We were talking before we hit record on this podcast, how do you come up with a list of five to 10 things that growers don’t like or are frustrated about with ag technology?

KATIE MCWHIRTER: Well, those frustrations definitely vary in the different hats that I wear. Probably the biggest frustration is that these technologies, if you’re talking about in or on the equipment, would be that they don’t communicate together, especially if they’re not a solid color, meaning they’re not all the same brand of equipment. That is a frustration for growers. I would say, also, a very big frustration, and funny as I’ve been out here in the last couple weeks, growers don’t think that they could, I wouldn’t say, benefit from our services, but they’re very worried because they don’t think their data is good. So, it’s two combines, it’s three combines, it’s not calibrated. How can you change some of these frustrations? What we can do, is take that data, and as long as it’s capturing that variability and we have an end measurement, whether that’s going to be bushels or yield, we can post-calibrate or make that data usable within our system. I think even the simplest technologies really can benefit from what we do.

I think one of the things I’ve learned is that we really have to ask questions to these growers to find out, when they talk about ag technology, no different than what I did with you, to find out what exactly they’re frustrated with. If they’re frustrated with data, what do they mean by that? I mean, is it they’re frustrated because they’ve got two or three combines or two or three planters and it’s not all brought together? Is it because they don’t feel like they’re getting a complete picture? I met with a grower yesterday who said: ‘The soil sampling is here. We’ve got these spreadsheets on our computer. Their data’s all over the place.’ I smiled, and I said: ‘You just want to put the pieces of the puzzle together to see exactly what the picture is.’ They’re like: ‘Yes, that’s what we want because we’ve invested in it. We know that each of those separately has been bringing us value, but it’s also bringing us frustration as we know we should be bringing them all together to make an even better decision.’

FRUSTRATION #2: DATA ISN’T GOOD ENOUGH

RENEE HANSEN: What was some of his biggest hesitation? I know you mentioned that he felt his data wasn’t good enough but elaborate on that a little bit more. Tell me more about that.

KATIE MCWHIRTER: Well, the yield monitor doesn’t have a card in it, so we haven’t been collecting yield data. So, I mean, the basics of what we’ve always said is a must. It’s really what we’re rooted in, but with our new planning tools, I immediately was like: ‘Okay, but there’s so much more we can do even by putting together, at the field level, his yield goals and his expected revenue and his variable-rated nutrients because he’s been grid sampling.’ Even though he doesn’t have what we, even a month ago, thought was an essential piece of what we had to have to be able to work with a grower, he’s going to test me on this one because he’ll get a yield monitor. That’s the agreement by fall, but I believe we can still provide him value being early enough and being able to identify his yield efficiency scores, his planned yield efficiency scores in each field, to be able to potentially identify profit robbers and how we could try to lessen that on his operation as a whole. Yeah, he definitely was hesitant until I showed him. I’m like: ‘Here’s what I need.’ And he immediately says to me, he’s pointing at the paper, and he’s like: ‘I’ve got this. I’ve got this. I’ve got this.’ I’m like: ‘Yeah, you’ve got the pieces. Let’s get them put together.’

RENEE HANSEN: Yeah, putting it together all in one system, and you also mentioned connection and connectivity. I mean, that seems to be everything’s everywhere. So, you also tell me, what are you doing to help him solve that and get all the information into one spot? I mean, you are doing some of the work for him.

KATIE MCWHIRTER: Right. So, I get the pleasure of contacting the people on his agronomy team. I think, before, some people might’ve seen us as the competition or a threat, and what I’ve said to both his seed supplier and his crop protection and fertilizer salesperson is I’m not here to step on your toes. I don’t sell those things. What I’m doing is I’m trying to help him be more profitable. That’s been fun to talk with his team, and, in fact, as soon as I start putting these pieces together, I want to meet with his team and show them what we’re trying to do for him in order to make him a more profitable farmer.

inthecabyieldmonitor

FRUSTRATION #3: DIFFERENT COLORS OF EQUIPMENT

RENEE HANSEN: Yeah, and what about the color of equipment with numerous different colors of equipment? Or the farmer, the grower, isn’t applying some of their inputs. Somebody else is doing it for them. How do we go about getting some of that information?

KATIE MCWHIRTER: Oh, definitely. Again, I met with another grower yesterday, and as we’re talking, sometimes they think all this information has to be captured somewhere or captured on a monitor. It has to be captured somewhere, but there are so many different pieces of information that we keep track of. I think that is a really big misconception, what data is. Some people, I’ve laughed, they think it’s a singular thing. For us, it’s a plural. I mean, so much data can be collected not necessarily on a monitor. So, putting that all together in one system, be able to look at it, to get a clear picture as far as what’s correlating yield or, more importantly, what’s driving profitability or, better yet, holding the entire operation back from being more profitable.

FRUSTRATION #4: IS A PRECISION AG SERVICE PROFITABLE 

RENEE HANSEN: Yeah, you’re talking about some of the things that they can start inputting and putting the pieces of the puzzle together. So, what’s the output? What do they get? What are we giving a grower? How is it going to benefit him?

KATIE MCWHIRTER: What it gives the grower is a clear picture of their operation as far as profitability, that return to land and management. The numbers don’t lie. I mean, I’ve always said the numbers do not lie. Take the emotion out of it, but that’s not where it stops. Essentially, it’s a continuous cycle. Don’t give me a pretty map, and that’s great, right? Don’t give me that. I need you to be able to, and our growers need us to be able to, without any bias, to say: ‘Here’s what we could do with it.’ Ultimately, it’s going to be the grower’s decision, and that’s what I was telling the grower yesterday. We’re never going to do anything that you don’t want to do, but we will challenge you as far as this is what we’re seeing in the data, and if you’re wanting to improve, it really looks like this is an area that we could focus on.

FRUSTRATION #5: FEAR OF CHANGING EVERYTHING AT ONCE

RENEE HANSEN: Yeah, something that you mentioned, Katie, was it’s a continuous cycle and how it’s never ending. You’re constantly learning. So, even at year one, there is so much that we can learn about. So, tell me, what does a grower learn at year one?

KATIE MCWHIRTER: Which is funny because, when I got back into working directly with growers, that was one of the questions that they asked me when we were first sitting down: ‘What do you think we’re going to learn this year?’ As I was getting all this data from him, and I’m like: ‘I don’t even want to take a guess.’ I have a suspicion, but I don’t want to say it out loud, but I think it was just their biggest ‘aha’ was I’ve never looked at my data like this before. I’ve seen it on the typical red, yellow, orange, three-shades-of-green map. Maybe I’ve done a little bit of comparison in some of these other platforms before, but never have I looked at it this way before. Whether that was in charts or in our data visualization tools and then, ultimately, to tie those costs back to it. Some of the things they thought, they were right, and some things they were kind of surprised, which has led to decisions. When I started with them in August, I mean, I told them I was not going to push them to anything that they didn’t want to do technology-wise. All of a sudden, we’re sitting down for our planning meeting in December. I’m like: ‘Oh my goodness. Four months ago, this is not where we were.’ I didn’t think this is where we were going, and now we’re jumping in the deep end of the pool. I don’t want you to do this and be uncomfortable. I want you very comfortable with the changes that you’re suggesting we make. That’s been fun, though, to lead people through because we all know that change is hard, and it’s very hard to get outside of our comfort zone. So, I actually start my sales training, my leadership training course, with: ‘Here’s your comfort zone, and outside of it, that’s where the magic happens.’ That’s so, so true with farmers.

premiercropyielddata_farmer

FRUSTRATION #6: DATA IS OVERWHELMING

RENEE HANSEN: I really think, and I see it too, just within our own family operation too, that sometimes you can get so comfortable diving into something new, they want to, a grower wants to get into something new, but it’s like, where do you start? How do you get started? It’s having a service, something that Premier Crop offers, something that you offer, just helping them, starting to input the information, contacting the people to get the information, knowing who to contact. So, right now in 2021, we’re at the beginning of March. Why would a grower need to get involved in something like this? Why should they wait?

KATIE MCWHIRTER: I don’t think they should wait. I think it could seem very overwhelming and don’t know where to start. It just takes that conversation to get them going. Really, I say, that’s why it’s so wonderful that we have the great group of advisors that we have to guide them through this process. We all like to be guided. We all like to know what’s next. I don’t care if it’s the program at church, the bulletin to what’s next. Or when you get on an airplane overseas, and it’s saying: ‘Here’s what’s going to happen. Then, this.’ That just puts everybody to ease and guide them along. Our advisors, it’s like we farm with them. I mean, I know I wasn’t going to go back and farm, but that love of agriculture and helping farmers, that’s our group of advisers. That’s their characteristics, their qualities. They genuinely want to help because it’s like they’re farming.

RENEE HANSEN: Thanks for listening to the Premier Podcast, where everything agronomic is economic. Please subscribe, rate and review this podcast so we can continue to provide the best precision ag and analytic results for you. To learn more about Premier Crop, visit our blog at premiercrop.com.

Learn more about the power of precision ag.

Unlock Insights to Your Farming Operation

“Data is valuable, but data in the hands of the right people with the right context is really, really valuable.” – T.J. Masker


RENEE HANSEN: You are listening to the Premier Podcast, where everything agronomic is economic. Today, we are talking with T.J. Masker, Senior Product Manager at Tractor Zoom, headquartered in Urbandale, Iowa. They are focused on helping bring price transparency to farm equipment and valuations for farmers, bankers, equipment dealers and insurance companies. T.J. has a lot of experience and knowledge in the precision ag space, and today, I asked him questions on how to unlock new insights to your farming operation using precision ag. Hey, T.J., welcome to the Premier Podcast. Just wanted to talk to you a little bit about unlocking some of the new insights to a farming operation, and I know you have a lot of experience. So, can you tell us a little bit about your background?

T.J. MASKER: Yeah, I grew up on a small family farm in southwest Iowa and did the traditional thing. Went to Iowa State, got an ag business degree, but for the last, well, about 11 years of my career, I’ve been working directly with farmers, helping them manage and understand their data better. So, whether that be agronomic data like soil tests, machine data that we get around like fuel usage or, in my current role helping farmers really value farm equipment, as that’s becoming the second highest cost on the balance sheet. What we’re really trying to understand is how we can make better decisions from that data. But the common theme is that ever since I went to Iowa State and graduated college, I’ve been passionate about helping farmers with data to make better decisions.

RENEE HANSEN: Yeah, you’ve had a lot of experience with data since you’ve been working in the field. So, can you tell me that? What is your experience with other precision ag systems, and what makes data so important?

T.J. MASKER: Yeah, I remember this, probably, like it was yesterday. I was covering a territory in south-central Iowa for one of the major seed brands. And I had farmers who kept asking me, like: ‘What can we do with this data? How do we start to think about how we utilize it more?’ This was almost eight years ago, and I literally Googled, like, ‘farm data’ something or another, and it led me, ironically enough, to Premier Crop and filled out the ‘contact us’ button. Then, I think it was Tony or Ben or somebody who reached out to me about: ‘Hey, we’d love to talk to you, understand where you’re coming from.’ And that ultimately led me to working with Premier Crop about seven-and-a-half years ago and doing direct advising with farmers in central Iowa. And many of those farms that I worked with back in the day, I’m still really close with today as I’m trying to solve new and unique problems, but I think, at that time, I had zero experience with precision ag. So, I had to learn how to set up the monitors, what Ag Leader SMS was, what software was to make better decisions. It was also my job to go out and recruit farms and help their operation. So, I think, over that time, I had to learn a tremendous amount about precision ag, what it was capable of. But, ultimately, I think for me, what it came down to is there’s so much value in this data and what we can get out of it if we’re measuring things correctly. And I think one of the things I experienced, even with the farms that have been collecting data for 15 years, was that, man, if we get this data structured in a way, it’s going to allow us to unlock so much potential. And whether that be if you’re using Climate FieldView or using John Deere Ops Center or using Granular, where I was at. It doesn’t matter unless the data is structured in a way that you can get the results out of it. And that, to me, was always the biggest ‘light bulb moment’ for a lot of the farmers.

RENEE HANSEN: Yeah, so since you’ve had the experience working with multiple different systems, what makes a specific platform better than another?

T.J. MASKER: When I talk to farmers about it, it’s really measuring the ROI, I think. Dan, I probably coined his phrase too, but if every agronomic decision is an economic decision, and we think about things that way, it fundamentally changes why we might do something. So, I think about systems that are able to actually provide that value to you as a farmer, and there’s not a ton of them out there. But we also need those systems that allow us to move data more easily. So, that’s why Climate, John Deere Ops Center, Ag Leader AgFiniti is another great example. Those tools help us get the data from the farm into the trusted advisor or the partner’s hands really quickly to make better decisions. That is valuable. I can tell you that there’s a reason why those tools are so heavily used because it solves a pain point. What I like to think about is: that’s one step. The next step is taking all this data and turning it into a better plan for next year. So, if I was at Granular, the way I described this problem is like: ‘I need to understand what we did and then how we did to understand what we need to do differently next year.’ So, if you focus on farmers collecting all this data on what they did, let’s get the scorecard for how they did at the end of the year. So, tools like Premier Crop. You think about all the things you can do with the query tool to answer questions from your data. Then, the real power is like: ‘All right. Using all this data, I now know with a high level of confidence going into next year that I’m going to have the best possible plan I can have.’ Mother Nature and God willing, things are going to fall into place. Well, let’s use everything we’ve learned to come up with the best possible plan, and we’ll adjust in season, right? Planting could get delayed by two weeks, so we might have to adjust seeding rates. All those things come into play, but let’s start with the best possible plan. And I think that starts with collecting and analyzing really great data throughout the previous growing season or previous seasons if you will, if you think about how many years of data a farm might have.

iStock-653836730

RENEE HANSEN: Yeah, I think you said something in there, like competence, where a grower just really needs to have that competence within the data. They’re collecting so much of it anyway. So, getting a grower started, it seems really overwhelming sometimes, just to get started with data because of the systems that you mentioned. They have Climate. They’re using John Deere Ops. Then, to add another system to their whole platform can seem really overwhelming.

T.J. MASKER: What’s funny is I’ve done customer discovery the last seven-plus years in my different product roles, and if you talk to every farmer, they’ll tell you they just want one system to manage everything. And the reality is that’s not possible. I think what we need to do as an industry to be better is to make things connected more easily, and you’re starting to see that. And the easier we can make it to connect different parts of the puzzle to the key people that need it, that is where you really drive value for the farmer. Because if you think about all the trusted people that the farmer is working for, you’ve got agronomists. You’ve got an equipment dealer. You’ve got a seed rep. You’ve got a banker. You’ve got probably a commodity broker advisor, potentially. So, you start to see all of these people that are helping the farmer with all the information that they have. It becomes really powerful if you can connect all those dots, and I think, for a while, we as an ag industry or a tech industry didn’t do a good job of this. I think everyone was trying to build a complete way to solve every problem. And now you’re starting to see that change quite a bit, and I believe it’s for the better because the more connected these things are, and the less you can alleviate a lot of the pain of getting data from one spot to another, the better off everyone’s going to be.

RENEE HANSEN: In one of our previous podcasts, we talked about how you need to connect all the pieces of the puzzle, and it sounds exactly what you’re talking about. You just need to connect everything together. It’s one big puzzle, and when you finally get it together, it starts to work like it’s more of a system. Growers have all this information. They have these systems. They have monitors. They have the tractors, like you said, that they’re heavily invested in. So, why would they invest in a service that helps them manage their data, that helps them make better decisions? Why should they do that?

T.J. MASKER: Yeah, I think this is really important, and I think understanding who you’re partnering with is really important too, from a farmer perspective. So, I think you’re going to see a lot of the bigger ag companies continue to invest in this space for good reason, right? They know there’s a tremendous amount of value in this data. What I also think is extremely valuable is what that independent advisor can mean to your farm. For example, I was out at one of the farms I used to work with on Friday, and we talked a lot about this. If you think about 7-8 years ago, where they were at, they were trying to manage it in house. They were writing their own fertilizer recommendations. They were collecting all their data. And now, fundamentally, they’re approaching things differently, and every year they’re trying to chip away at this thing. So, a great example is when I started working with them 7½-8 years ago. We talked a lot about: ‘Wow, you guys can grow really great soybeans. What if we grew more soybeans, for example?’ It was funny to talk with them on Friday. And as they approach planting season this year, they’re going to start one planter on corn and one planter on soybeans at the same time because the data has shown them that if they get in earlier on soybeans and get those soybeans in, there is X-yield gain from that. And that wouldn’t have been the case seven-and-a-half years ago. What data allows us to do is to test little things, and the way I always approached it with farmers was like: ‘Give it three years.’ We have the data that tells us that this decision is likely to produce a positive outcome. If we try it, we can’t just try it for one year. We have to commit to trying it for three because odds are, over those three years, we’re going to see that return. So, I think that’s where the power of having a system or a service to manage that is critically important. And I think you’re starting to see a few others come up in this space, as well, because they probably realize a little bit of the model of that trusted advisor is the most powerful model. And it’s because, fundamentally — again, I think Dan will probably laugh — but agronomy is local. What works for the Des Moines Lobe might not work as well where I’m from in southwest Iowa. It might not work as well for my buddy that farms in eastern Iowa. Data’s valuable, but data in the hands of the right people with the right context is really, really valuable. I think a lot of farmers are frustrated with managing that data. So, how do you find somebody that can help you and kind of provide that ROI? And, at the end of the day, they have to prove their worth, right? Fundamentally, they have to prove their worth, but I think they’d be surprised what they would see from partnering with somebody like that.

RENEE HANSEN: Yeah, definitely. Like what you said, there is definitely a shift that you’re starting to see with farmers, that they are wanting to see more of their data and utilize more of their data, where in the past, there was a lot of resistance and maybe because the market was too flooded. So, what would you tell a farmer who has resistance to working with a precision ag service?

T.J. MASKER: Once, I think I called on a farm for three straight months that was resistant to this, and it wasn’t because they didn’t see the value. It was that this was a piece of their operation that was so important to them that they’d been trying to figure out. And I think one of the things is when you have a group that’s been around for, let’s say, 15-20 years, there’s a lot of value in that versus I might be a little bit more skeptical of somebody that’s only been around a year or two because there’s that track record there. So, what I would think about looking at is who has a track record? Do they have farmers that are willing to talk to them about why they decided to partner with this person? Because, at the end of the day, we know there’s value in the data, but maybe there’s an opportunity for a farmer to share their story with another farmer that’s a little bit resistant and tell them: ‘Hey, I was exactly where you were at seven years ago, and now the way we do things seven years later is fundamentally different.’ So, I would just be open to having that conversation with others that are finding success in this area and help them along in their journey.

RENEE HANSEN: Well, sometimes, you get in a pattern where you are very comfortable with what you’ve been doing the past years, and you’ve been successful. You’ve been profitable, but there comes a point where there’s a tipping point where your margins are starting to get a lot thinner, and a grower needs to maybe change some practices. And that data can tell you exactly what practices to change.

T.J. MASKER: Yeah, it definitely can. I mean, all these things come flooding back to my head, but you think about some of the marginal areas of your farm that just don’t produce much. We did the math 5-6 years ago, and it said: ‘Hey, if we don’t apply dry fertilizer on these spots, we can save an average of $5 an acre across all the acres.’ And the reason why we weren’t going to apply there is: one, we didn’t expect the return, and two, guess what? When we analyzed the soil test results by those areas, they were, a lot of times, the highest soil test values, which, if you back away from it, makes a ton of sense. Because if you’re applying the same rate of fertilizer across the field, and the good parts are taking off more, you’re going to see these lower-yielding spots, for example, have higher soil tests. So, you start to tell that story, and all of a sudden, you’re like: ‘Wow, just by doing that one thing, I’ve saved $5 an acre across all my acres.’ I don’t know what fertilizer prices are at today. Normally, I’d have a better pulse on it, but it might be higher. It might be $6-$7. I don’t know. But you start to approach things from that standpoint and manage each field like it’s its own kind of factory. I know there’s that analogy out there, but it really does make sense when you start to look at it at that level.

RENEE HANSEN: And a lot of companies are talking about data science and machine learning, and they’re trendy words. I don’t want farmers to get afraid of companies starting to use this because if they are resistant to using precision ag, they’re going to think: ‘Oh, well, now they’re just turning this into something that’s more automated.’ So, what do you think companies mean, and what should a farmer know about data science and machine learning within the precision ag space?

T.J. MASKER: Yeah, so companies are investing a lot of money into data science, and it’s an ability to take a lot of the data we have and try to learn really quickly. Versus a traditional method would be: ‘I’m going to evaluate this year’s crop. Then, I’m going to go around and, then, implement three practices that I learned from this year’s crop.’ Versus: ‘Hey, could we speed this up through data science and machine learning and try to learn from 15 crops and apply that knowledge to one year?’ What I will tell you is that most farms that I’ve worked with, and I still believe this to be the case today, is that they want to learn from the data on their own farm, but that also means that they can leverage data science on their own farm. So, the way I would think about it is to think about trials that you’re running. How are you setting them up? Because that truly is data science in its very, very simplistic form, but that’s what it is. We’re trying to test and validate things and use the data. Another trend, like with machine learning, is you’re going to hear more and more about ‘combine automation,’ which is real. I think I was listening to a podcast the other week about how they go out to a farm and demonstrate this to a farmer. Because most people would say: ‘Hey, I know I can adjust the settings on my combine better than any computer can.’ So, one of the things they do is they completely purposely set the settings wrong on the combine for one pass, push the button and watch it adjust. And they watch the farmers’ eyes light up with how quickly and how accurate those adjustments are, and I’ll tell you the tech side of things. As I’ve been talking to farmers specifically about equipment, the tech side of things is tying more and more into that equipment-buying decision. So, what technology are you using? Who’s the provider, whether it be John Deere or Case, or what’s the system that’s going to manage it? And they’re starting to talk more about making decisions for new combines based on automation, which is machine learning which taught that. I think you saw some announcements from John Deere in the last two weeks with the See & Spray technology with the acquisition of Blue River. So, this stuff is going to keep coming, and it’s going to come pretty fast. But at the end of the day, it’s just like a trial on the farm, where seeing is believing. And I think once you see this technology in the hands of different people, you’re going to see people adopt it at different rates, but I’m pretty bullish on the ‘combine automation’ stuff just because of what I’ve seen and what it can do. And I know, from direct feedback from 50-plus farmers over the last four weeks, that is something that they’re looking at.

RENEE HANSEN: Yeah, it’s pretty incredible, the advancements that they’re making within the technology, just with the tractors, the combines. But, then, also kind of going back to that data, too, and data science, where if a grower is anywhat interested in their data, having to layer all of that in a spreadsheet of Excel and having your brain trying to figure it out, it’s just too difficult. Let the computer do the mathematics for you. I mean, that’s the whole purpose of the data science. It’s learning through your data. So, I’m just kind of reiterating what you were saying, T.J. You’ve shared a couple of stories. You shared that you talked with 50 farmers within the last four weeks. What are some of the most successful stories that you have from a farmer using precision ag?

T.J. MASKER: Yeah, I remember this was kind of the fun one and like the best case study that I have. It was that we started working on a problem, and the same thing applies to product management if I’m trying to solve a problem for a farmer. But it’s like: ‘What’s the goal here?’ And it’s like: ‘The goal was to increase soybean yields for this specific farm.’ They couldn’t get above 45 bushels. So, we started to break down the problem and study the group data that we had, to say, okay, well, we haven’t ‘limed’ in five years. Maybe that’s something we could do. Another thing that the farm hadn’t done in five years was try a different seed brand or variety. So, that’s another thing we could do. Another thing they typically did was only fertilized ahead of the corn crop. Okay. So, let’s split up that application. So, we literally picked a field and said: ‘We’re going to kitchen sink it, and we’re going to try everything we can. And we’re going to make sure we have trials set up within the field.’ I think we ended up hitting 75 or 80 bushels per acre, which was almost double what their average was. Now, granted, Mother Nature cooperated and rained when it needed to rain. But the point was we were able to say fungicide meant ‘this.’ A different variety meant ‘this.’ Using lime, dry fertilizer on this part of the field meant ‘this.’ And we literally laddered it up to that number. To me, we can spend a lot of money on inputs and resources, but doing that, and actually just calling it the ‘kitchen sink’ but having our checks in place, fundamentally changed how that farmer grew soybeans moving forward. And we were able to increase the average over a lot of acres, 15 bushels. But if we didn’t identify what the core issue was and start to think about how we strategically implement different tests, we would have never gotten there. And I laugh because the same thing exists in product development, where you’re trying to build things for farmers. It’s like: ‘What’s the problem we’re trying to solve? How do we prove value, and how do we incrementally get there?’ So, whether it’s agronomy or software development or building the next widget for a John Deere tractor, it’s all the same when you break it down. It’s how you solve problems and measure it to make improvements.

RENEE HANSEN: Well, that’s a great success story, and the fact that, just in one year, how much they can learn and then take it to the rest of their operation over the next 3-5-10 years. And the profit that you’re getting out of that service is tremendous. I mean, it’s definitely worth the cost of the service.

T.J. MASKER: Absolutely.

RENEE HANSEN: You mentioned a little bit about where precision ag is going in the future, but where do you think precision ag is in the software space? So, we talked a little bit about automation with tractors and combines, but what about in the software space? Where do you think precision ag is going?

T.J. MASKER: I think it’s going to continue to get ‘smarter,’ which is kind of an annoying tagline, but it’s going to get smarter about how much you’re applying what rate on what date. A lot of this, we’re getting so good at understanding the impact, and we have enough data to understand it. I also think I’m pretty confident — we saw it in a past experience. I see it in the current one. The value of the mobile device and whatever you have with you is going to continue to dominate this space from a software perspective. You think about: ‘I can pull up Climate or the Ops Center on my phone and have an answer really quickly. I want to show my landlord how the field yielded in a second.’ Farmers are going to continue, in my opinion, to demand that the tools they’re using be accessible from anywhere. And so, precision ag, yes, there’s the technology in the cab. Yes, that’s important. But I would argue that this device — the phone, the tablet — probably more so the phone than anything is going to continue to be such a critical piece. It’s how farmers run their business, and they expect to have things on their phone. So, I would think if I’m working with a provider, that is going to be one of my number-one needs, and it’s also going to drive a lot of engagement for that farm, as well, which is critical for any tool you’re trying to use because a farmer’s going to get value out of a lot of things. But having that answer really handy with them whenever they need it is very, very valuable.

iStock-489255170 - edited-1

RENEE HANSEN: Yeah, getting your data any time, anywhere, I think, is kind of a little tagline that we use, even with one of our mobile apps that we have within Premier Crop. But I think I agree with you that farmers want it. They want to pull it up, and they want to see it. They need to show it, whether that be the banker or the landlord themselves. So, they’re looking at the field, getting ready to plant, getting ready to harvest. All of the above.

T.J. MASKER: Yeah, and it has to be easy to use, which is such a challenge, right? Because if you talk to the 50 farmers that I’ve talked to, you’re trying to pull out the nuggets that are similar between all of them, but there are always unique use cases. But I think as long as you’re solving for the 90%, you’re going to be well on your way to help the farm make better decisions, which is ultimately everything that we’re about and trying to do.

RENEE HANSEN: Great. Well, thanks, T.J. Thanks so much for joining us today. Really enjoyed all of your knowledge and your experience and sharing on the Premier Podcast.

T.J. MASKER: Awesome. Thank you.

RENEE HANSEN: Thanks for listening to the Premier Podcast, where everything agronomic is economic. Please subscribe, rate and review this podcast so we can continue to provide the best precision ag and analytic results for you. And to learn more about Premier Crop, visit our blog at premiercrop.com/blog.

Learn more about farm profitability.

Nitrogen Strategies for your Fields

“It convinces growers to spread those nitrogen pounds out over the course of the season or minimally making more than one application, and they see improved efficiency. We’re talking about less pounds of nitrogen to produce a bushel of corn, and we generally see higher yields at the same time. So, it becomes a win-win.” – Mike Manning

RENEE HANSEN: Hey, Mike, welcome to the Premier Podcast. Today, we’re going to talk about helping a grower have a nitrogen strategy. So, first, I know you’ve been on the podcast before, but can you just quickly introduce yourself and tell us what you do at Premier Crop?

MIKE MANNING: Hi, Renee. Good to catch up again. Mike Manning, Premier Crop Systems. I’m our Nebraska Account Manager and Agronomic Information Advisor. I support some of our retail partners in a few different areas and work directly with a good set of growers across the state of Nebraska.

RENEE HANSEN: Thanks for that intro, Mike. Also, I know there are a lot of people who follow you out on the Twitter world, and you’re known as who on Twitter?

MIKE MANNING: DataManning. You can find me on Twitter @DataManning.

RENEE HANSEN: Perfect. Great. Well, thanks for that introduction. So, let’s go into this nitrogen strategy and why we believe that a grower and why you believe and work with growers who should have a nitrogen strategy. Let’s just take it from the first step of planning and having a plan and a strategy when it comes to nitrogen.

MIKE MANNING: Well, you hit it right on the head. First, we have to have a plan about how we’re going to go about applying our nitrogen or what our season-long plan is for nitrogen management. The simple answer is there is no one-size-fits-all solution, especially when it comes to nitrogen management. It needs to fit into your rotation. It needs to fit into your logistics, your available labor, how you’re going to manage different cultural practices and other tools that you have at your disposal, whether that’s equipment limitations, irritation or rainfall limitations, yield potential. All these dynamics play together. One I’ve left out there would be topography and soil types. Also very important. A lot of nitrogen plans probably have fallen under that cultural practice of what a specific area has been accustomed to doing. Some examples of that might be 100% of total expected nitrogen needs applied in the fall with anhydrous ammonia or spring-applied anhydrous ammonia. I’d say, really over the last 20 years, you’ve seen more of a move towards split application of nitrogen. There’s a fair amount of research that’s come behind that’s, I would say, pretty widely accepted in the industry now that split application of nitrogen is much more common than it ever used to be.

With what I work with in Nebraska, it’s almost universal. I know that’s not the case in some of the rainfed states and different management systems and on different soil types. I wouldn’t even say growers that are limited to owning their own equipment. Even one split application, maybe anywhere from 50 to 75% of their nitrogen upfront in the spring pre-plant or early post-plant and, then, a single side-dress application. Probably, more commonly, what I see for that nitrogen delivery method is some form of upfront pre-plant. Pretty common to come back with a weed and feed pass, where we have 32 or 28% nitrogen, potentially some Thio-Sul mixed in with an early post-planter, early post-emergence application. Then, perhaps another trip back across the field with a coulter bar at about V5. In the great state of Nebraska, with our irrigation, we tend to put it on season-long. We’d like to fertilize through our pivots, generally, at about 50% of our total N needs.

RENEE HANSEN: So, Mike, you’re talking, I mean, you’re going right into application timing. How does somebody plan for their application timing? Obviously, in Nebraska, they do have the capability to do that because they are working with a pivot, but for the rest of those who don’t have some kind of irrigation system, how do you plan for those different application timings? What are you looking at to make that plan? Are you using data from the past? Can you do it year one after you use the data, or do you need to be in a system for numerous years to develop a bigger plan, a bigger strategy?

MIKE MANNING: You’ve asked some multifaceted questions there. So, let’s kind of break that down one by one. Let’s just go. Let’s say we’re making the decision to go between a single application, like we historically have, and two applications. We’re going to split some portion of our total nitrogen pounds. The best way I explain it to growers is that our corn crop has a season-long nitrogen requirement. The closer that we can supply our synthetic nitrogen to that growing crop, or to the crop as it’s growing through the course of the season, the better efficiency we’re going to have. There are definitely places in Iowa and Illinois with very high organic matter, very strong holding capacity and some very nice flat-level fields. Dan Frieberg shared it many times in the past. Well, we kind of call it our surrogate data. Why are we seeing, in the group data, these 100% nitrogen fall-applied ammonia always showing up as the highest yielding in the database? Well, we were making those applications to some of our best fields that we could go place all that nitrogen at that time, in the fall, how to be available. And there are prime acres to begin with. The acres that were receiving a split application, or had some other balance of nitrogen pounds throughout the season, were those rolling hills mixtures of sand and clay and just more marginal acres that needed to be managed with a different stroke anyway.

Probably one of the biggest things I see, as it convinces growers to spread those nitrogen pounds out over the course of the season or minimally making more than one application, they see improved efficiency. And by improved efficiency, talking about pounds of nitrogen to produce a bushel of corn, and we generally see higher yields at the same time. So, it becomes a win-win. To what I think was one of your second questions: how many years of data do we need to have, or how do we arrive at our total nitrogen requirement? Again, we can kind of break that apart in a couple of different pieces. For somebody that is making a single application, I would say just take a couple of fields and plant a split application. Again, how does that fit into your labor and logistics workflow? For growers that own their own equipment with the sprayer, it’s pretty easy to convert. Not too much more difficult to incorporate a weed and feed side-dress nitrogen going on with your post herbicide. For guys that hire it out, that hire their spraying out, it might make sense for them to acquire a coulter bar and go make an application in season. Or at least go rent one and try it. Take a handful of fields and just try it for a couple of years. Now, if you have 6% organic matter on perfectly flat earth, you’ll probably completely disagree with me. If you farm anything other than that, I would put my money on split applications just about every time.

RENEE HANSEN: The split application is really becoming more popular. You mentioned that in the beginning of this podcast, that you’ve definitely seen the trend move the line more towards split applications. So, you did mention this also about nitrogen efficiency based off of the field. So, can you talk about why having a plan, a nitrogen strategy, how that makes you more efficient with your nitrogen to gain more yield?

MIKE MANNING: Combination of factors. I’d say, bottom line, it does. A split application helps us be more efficient, but if we’re measuring the results off of our farm, we can actually see what those real efficiency values are. With Premier Crop, we talk about zone management a lot, managing fields by zones. Zone management makes sense. Just for my standard disclaimer on that, we’re not talking about zone soil sampling. We still have a grid soil sample underneath of that. One of our favorite methods for arriving at Management Zones is principally looking at historic yield data. For the most part, the best area of the field has always been the best area of the field. The poorest area of the field has always been the poorest area of the field. Using other pieces of spatial data to maybe augment that, whether that’s grid sample data, EC, EM data, soil survey maps, where applicable. We can use that to help augment and guide zones.

So, now we think of our traditional Premier Crop ABC management zone approach. We start seeing efficiencies. You start breaking that out year over year, especially in those corn years. If I see consistent efficiency of, say, 0.75-0.8 pounds of synthetic nitrogen per bushel produced in my A zone, maybe 0.9 or 1.0 in my B zone and maybe anywhere from 1 to 1.2 pounds of nitrogen in my C zone, I see that consistency. We can confirm our zones. A, we know our zones are behaving how we believe they ought to be behaving. B, we’ve dialed in management, probably with a variable-rate seeding approach, as well. And C, now we can start incorporating these nitrogen efficiencies that we’re observing within the field. That becomes, well, A becomes an efficiency driver. And, all of a sudden, let me do some quick math. If I’m producing 280 bushels in my A zone, but my efficiency is at 0.7 pounds of nitrogen, I really only needed 196-200 pounds of synthetic nitrogen in that A zone. In that C zone, that’s at 1.1, and it’s producing 225. I probably needed 240-250 pounds of nitrogen in that C zone. At the end of the day, it’s spatial management. As things change in the field, we’re adapting our management to it and, then, marrying economics and efficiency back to it. Now, it also ties right into sustainability. We’re being a lot more — we’re just being smarter with how we’re applying fertilizers on our fields.

RENEE HANSEN: Mike, that was going to be my next question to you, and I think you already answered it. When it comes to nitrogen and efficiency, it couples the economics, so profitability for the farm and sustainability to the land.

MIKE MANNING: Absolutely. It’s agronomics, economics and the sustainability piece. Agronomically, we’re producing good bushels. Economically, we’re doing it very efficiently. Sustainability-wise, we are being good stewards of the land and being good stewards of our fertilizer resources.

RENEE HANSEN: Lastly, can you talk a little bit about what Premier Crop is doing with what we call Enhanced Learning Blocks and possibly what you can do with a nitrogen strategy?

MIKE MANNING: Sure. So, Enhanced Learning Blocks, I’m pretty passionate about Enhanced Learning Blocks. I’ve been using them widely since 2016. I haven’t done a ton with nitrogen, but there’s certainly an opportunity to do that. So, an Enhanced Learning Block we’re taking builds off the traditional Learning Block concept.

Screen Shot 2021-04-20 at 4.44.41 PM

Let’s take a two or three-acre block in a known area of the field, and let’s change our rate. Let’s go up or down. Well, enhanced learning blocks enabled us to introduce both randomization and replication. So, instead of testing a single rate in a two or three-acre block, let’s test three or four different rates and then replicate it five times. So, now, in the case of nitrogen, if I was, say, on a side-dress application, I was coming in with 30 gallons of 32%. Let’s pull up 28.005. So, if I was at 30 gallons there, I’m looking at about 90 pounds of nitrogen. Within that enhanced learning block, maybe it’s about four acres in size now. Let’s test rates at 20 gallons, 25, 30 and 35. Or 25, 30, 35 and 40. This system — we build it into the prescription system — enables that application to execute in the field. Then, we can have statistically valid nitrogen response results to review at the end of the season, and that becomes very powerful. What is the right rate? Obviously, one trial one year from one field is not going to answer the question for your entire farm, but it starts you down that path of learning. In many cases where I use Enhanced Learning Blocks with my growers, we have multiple blocks where you have anywhere from one to five blocks per field, and we replicate that on just about every field they farm. So, they’re building a research quality data set off of their own farm with their precision equipment. I’ll leave it at that. Nitrogen management and how nitrogen behaves in the soil, in the environment, and how it performs agriculturally, agronomically for us, is probably one of the most complex aspects of agronomy. Again, just to reiterate, there is no one-size-fits-all solution, but it is about tailoring and optimizing things that best suit your farm.

RENEE HANSEN: And that’s why having a nitrogen strategy and building that with an agronomic information advisor like you, Mike, is really helpful because you have the knowledge. You see the data, and you can help the grower learn, year over year, how to best get the best profitability and sustainability on their land.

MIKE MANNING: Absolutely.

RENEE HANSEN: Thanks for listening to the Premier Podcast, where everything agronomic is economic. Please subscribe, rate and review this podcast so we can continue to provide the best precision ag and analytic results for you. And to learn more about Premier Crop, visit our blog at premiercrop.com/blog.

Learn more about soil health.