Can “Unhealthy” Soils Consistently Produce Exceptional Yields?

In the early 1970s, I was fortunate to work for a farming operation that was serious about soil conservation. Serving on State Soil Conservation boards, building terraces, implementing no-till, when planters and weed control options were crude by today’s standards – they were soil stewards. Because of their mentorship, I’ve always taken soil conservation seriously.

In the 1980s, I found myself defending the use of commercial fertilizers. Those that attacked their use liked to describe them as “chemical fertilizers”. If you remember the Periodic Table of Elements in your first chemistry class – you know nutrients are chemicals. Phosphorus and potassium are minerals that mined from the earth, and nitrogen is made from the air (which is 78% nitrogen). Nitrogen fertilizer is a chemical and combining hydrogen from natural gas, with nitrogen from the air, to produce nitrogen fertilizer, was a significant scientific achievement. We have to be judicious in how we apply Nitrogen from all sources, but since it takes energy to create nitrogen fertilizer, it warrants additional attention.

What I understood then as I do now, is that we need integrated approaches to crop management to be both economically and environmentally sustainable. How we manage weeds, insects, nutrients – including organic nutrients, tillage, residue and crop rotations have serious consequences both for the environment and growers’ balance sheets.

One of the thoughts that’s been rumbling around in my head relates to soil health. In some circles, soil health tends to end up in a discussion about farming practices – almost a checklist of do’s and don’ts. Other approaches try to quantify soil health with a test. I tend to like the test concept because it starts to allow us to make comparisons from field to field, within fields, benchmark over time and eventually be able to quantify changes.

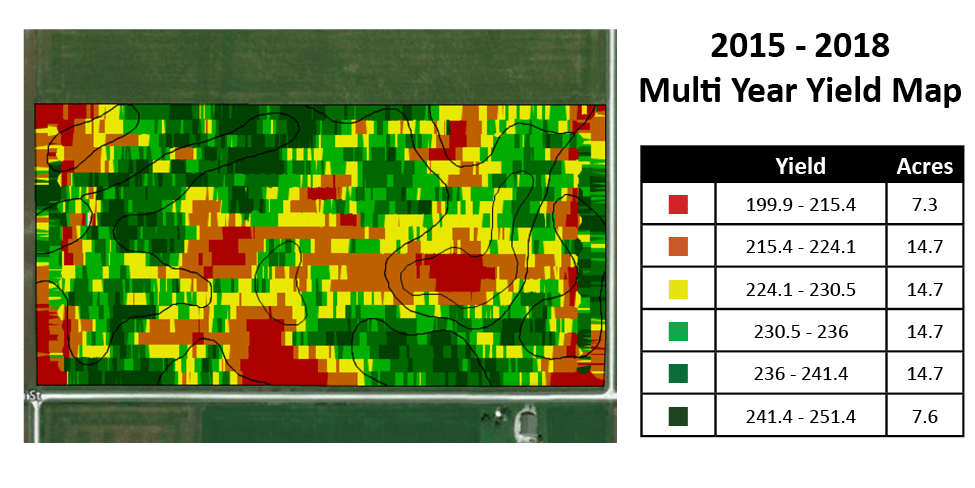
Our company, Premier Crop, is all about managing variability within fields and between fields to maximize a grower’s return on investment. We use yield files from calibrated yield monitors to measure our success both agronomically and economically. One of our tools empowers the user to build a multiple year yield map. I find that there are parts of fields that are amazing in their ability to consistently kick out exceptional yields. I understand that there are examples of “throw the kitchen sink” at production and have everything work perfect in a given year.

I’m not talking about a one-hit wonder. I’m talking about areas of fields that are exceptional yielding on consistent basis. Are those areas of the field “healthier” than other areas? Is it possible for them to be unhealthy and be so consistently high yielding?

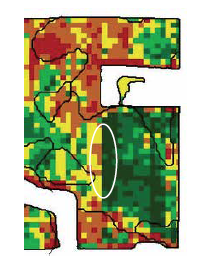
multi year yield map

What do these high yield areas have in common?

  • Drainage is right – either blessed with naturally well drained or a combination of cultural practice and field tile.
  • They frequently have deeper A horizons (depth of top soil before clay or sub soil) and usually a higher % organic matter.
  • Usually pH is right – not too high but also not low. That makes sense to me, correct soil pH makes other nutrients, like phosphorous, more available and is needed for the bacteria that increase mineralization to be active.

I believe that nutrient cycling is better in these areas – that is soil supplied and fertilizer/manure supplied nutrients cycle to plant useable forms better than in other parts of the field. There is a strong relationship in parts of fields between consistently high yields and soil health. I believe you can have healthy soils that aren’t exceptionally high yielding (can be limited by other management choices). But I don’t believe you can get consistently high yields on unhealthy soils. If you’re trying to understand differences in soil health within your fields, I’d be inclined to start with a multi-year map.

Analyzing Your Yield Map

Hunters and soil scientists may seem like an odd pairing but they have at least one thing in common – they know and appreciate that nature has an aversion to straight lines. Hunters spend a lot of time in and observing the great outdoors and getting an up-close look at the variability Mother Nature molded upon our landscape. Soil scientists not only spend time looking at the curvy contour lines that represent the transition from one soil type to another but their academic training is about the “how’s and why’s” of soil formation over the centuries.

Unlike nature, humans have figured out how to perfect designing straight lines! From early days of the very first mechanical planters and “cultivator blight”, the straightness of our rows was something that created neighborhood envy. Nowadays auto-steer has made it easy.

Straight lines are one of the first “gotcha’s” when studying a yield map. The cause for yield differences that follow straight lines are always man-made! It can be a variety change, a different nutrient application, a crop protection treatment, an equipment performance issue, a tillage pass or even something like a manure application we did years earlier. Seeing a straight line on a yield map instantly leads to digging deeper!

analyze yield data with your yield map

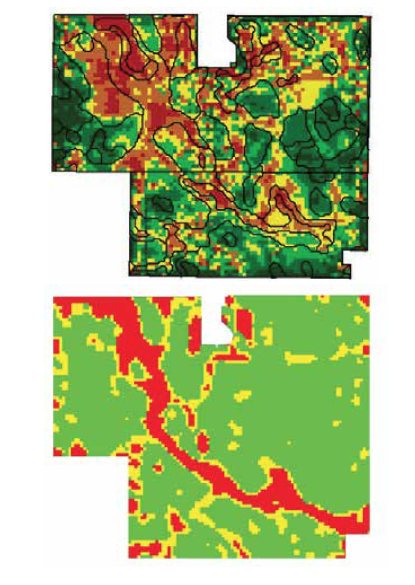
Yield maps are an awesome way to visualize data differences. However, a second “gotcha”, is not paying attention to the map legend! Years ago, I had a college friend send me an image of one of his yield maps, with a note that said “you see, we really don’t have much variability in our area.” But as I studied his map, I noticed that the predominant green color on his yield map had a 40-bushel-per-acre range.

use your yield data to check field variability

The two maps above use the exact same yield data.

There is not a “perfect” way to set map legends. The key is to also LOOK AT THE LEGEND – not just the map!

Using Data to Measure Hybrid and Variety Performance

The age-old agronomy equation is, “Yield Equals Genetics (G) by Environment (E) by Management (M).” There is a lot of focus on using data to measure hybrid and variety performance, in other words, to sort out the “G” part of the equation. That can start with your own data and but it can also include being part of “group, pooled or community” data. This allows you to anonymously see yield results from both genetics you planted and didn’t plant. Being able to filter results by rainfall, GDU’s and soils helps to address the factors that make up the “E” factor and get closer to apples-to-apples comparisons.

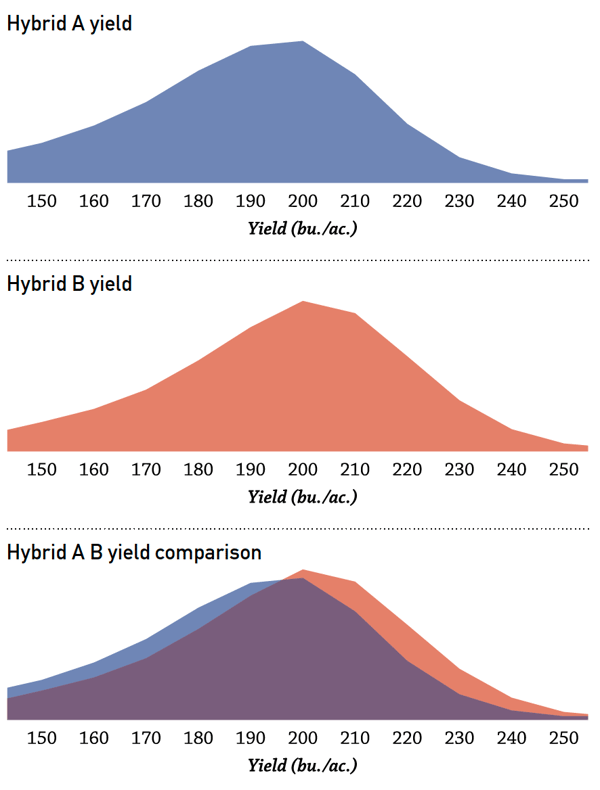
Many times, group data analytics generate results that reduced the comparisons to a single number – the average yield per acre for each hybrid or variety. Many times, that can have the effect of “masking” the deeper story in the data. Another way to visualize genetic performance is to see the yield distribution as a percentage of yield observations.

premiercropblog_yieldperformancebyhybridperformance

The blue image is Hybrid A, a popular choice, which averaged 182 bu/acre on 12,560 acres across a local market.

The red image is Hybrid B, another market leader, which averaged 192 bu/acre on 14,712 acres in that same area.

Now look at the yield distributions overlaid. Perhaps this is a more “honest” way to understand yield comparisons.

There are some situations where Hybrid A was actually better than Hybrid B, even though the overall average was 10 bu/acre less. Likewise Hybrid B had higher yields per acre more often than A.

When you visualize data in this manner, it’s easy to understand why one grower can claim Hybrid A was far superior to Hybrid B and yet a neighbor can document just the opposite experience. The real power in data analytics is understanding the situations where each hybrid excels! “Understanding the situations” is really about the “M” part of the yield equation. Realistically, there are a lot of great hybrids and varieties available for most crops. From my perspective, the equation is (?) looks like this: Y = g x e x M!!!!

Management matters far more than most people realize!!!

Thankful for Harvest Bounty

I’m writing this before one of our great American traditions with agricultural roots – Thanksgiving – originally a time to be thankful for the bounty of the harvest. The 2017 crop year harvest has been a surprise to many. How is it possible to produce so much with such adverse growing environments? Here are just two Iowa examples:

1st year corn – average of 247 bu/ac with .81″ of rain in July.

Corn on corn – average of 233 bu/ac with .74″ of rain in July.

How is it possible that during the peak of vegetative growth, when the plant is demanding the most water, the corn plants can sill produce so much with so little rainfall?

Likewise, how is it possible to produce an average of 252 bu/ac with 22 inches of rain in April through July in central Indiana – when it never stops raining, fields are water logged and there are virtually no good days to do field operations?

I’d like to take this time to make a point about how amazing our modern corn production is and can be and to share some thoughts on why we grow corn.

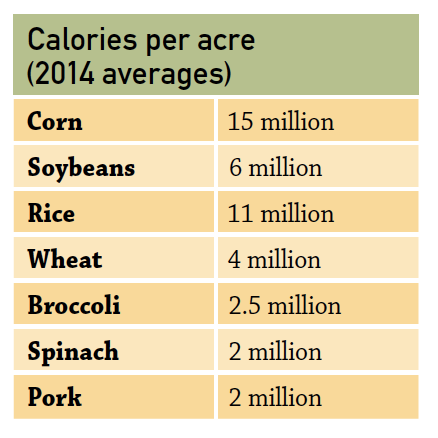
Borrowing from a Tamar Haspel’s Washington Post column from a few years ago, titled “In defense of corn, the world’s most important food crop”. In her column, she converts corn yields to calories/acre. Seems to me that if we’re serious about feeding the world, calculations like this matter.

premiercropblog_caloriesperacreperharvest

Doing the math for these real world, non-contest examples above – their bushel per acre yields convert to over 21 million calories produced per acre. The Post column provides the scientific explanation as to why corn is so much more efficient (3x) at converting sunlight – through photosynthesis into calories.

We don’t grow corn because it’s what our parents did, because of crop insurance subsidies or because the rotation helps our soybean yields. We grow corn because it is perhaps the more adaptable and efficient crop ever known!

Every measure of efficiency related to corn production is in need of constant updating. One of the original attacks on corn-based ethanol used 130 lbs. of nitrogen per acre to produce 130 bushels per acre to do the net energy calculation. We have customers that frequently produce over 200 bushels per acre using only 0.6 lbs. of nitrogen per bushel. Agriculture is frequently attacked for using too much water and corn is one of the crops that is cited. But lost in those debates is that 80% of the U.S. corn and soybean crop is rain-fed, not irrigated. The water we are using to produce most of our corn and soybean crop isn’t an either/or proposition. It’s not, either agriculture uses it or Los Angeles does. We use a fraction of the rain water that feeds our crops and leave most of the biomass produced in the field to recycle carbon and nutrients.

We have serious environmental and public policy issues that we have to continue to address but data from fields like yours shows constant improvement and efficiency. I get the luxury of seeing real world data that tells the story of an ever increasingly efficient production system. Every year, we not only produce more yield per acre but we squeeze more bushels from every pound of applied nutrients and more bushels per inch of rainfall!

Published in Corn and Soybean Digest Nov. 2017. 

Use Your Data to Make Decisions

It’s almost the time of the year when making New Year’s resolutions are popular. Ever make a business resolution? If you haven’t been using your data to make decisions, how about making that your resolution?

How should you start? I’d start with your yield maps. Look carefully and hear the stories that they tell. What are some of the real-world examples of how you can use your yield map to make decisions?

premiercropblog_datatomakedecisions

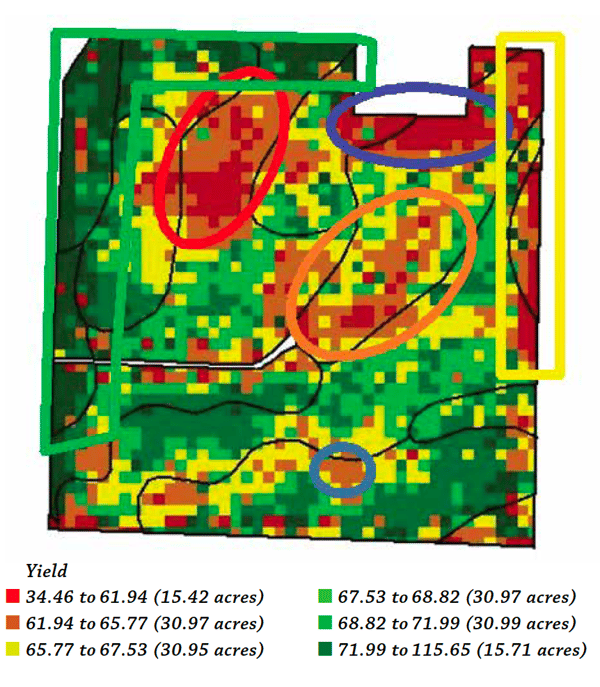
1. Red circle – This one is easy, using the yield map to quantify yield losses associated with drainage issues. Up to 10 bushels per acres @$9.50/bushel = $95 per acre. The economic loss is just as severe with corn. Breakeven on running tile might be as fast as 5 years. Wonder if my land owner will work with me on solving this issue?

2. Blue circle – simple too much traffic!!! 15+ bushels less per acre – that’s $150/acre yield loss! We need a strategy to fix this! Maybe concentrated effort with a ripper and then more discipline about how we move in and out of the field?

3. Yellow rectangle – wow – between shading and competing for soil moisture, the trees in that fence row are sucking yield and money right off my balance sheet. I know the land owner wants habitat for game birds, but it comes at 10-15 bushel cost to me. Maybe showing him some of my yield maps will help in negotiating?

4. Orange circle – this i another drainage issue. I think this one is an easier fix – maybe some surface shaping and extending the waterway on the lower end.

5. Light blue circle – yikes – I remember this one – it’s my first small patch of resistant waterhemp. This is mild compared to some in the neighborhood – time to get serious.

6. Green area in NW corner – oh my – this one is a puzzle at first. Two years ago, my contract manure applicator needed a place to finish and I’m fairly sure that’s only part of the field that was knifed. This is definitely something I need to investigate – over 100 bushel per acre in many places!!!

You get the idea – your yield maps can be the first step in quantifying problems and figuring out solutions! Merry Christmas and best of luck with those New Year’s resolutions!

Farm Finance Featured on the Farm 4 Profit Podcast

“We have growers who tell us that we’re helping them with their economics, which helps convince their lender to give them the full operating line.”
Dan Frieberg

On this episode of the Premier Podcast, Dan Frieberg interviews the Farm 4 Profit show. Make sure to subscribe to their show at farm4profit.com. We hope you enjoy the conversation:

TANNER WINTERHOF: All right, welcome back to another Farm 4 Profit episode. This is Tanner Winterhof.

DAVID WHITAKER: And this is David Whitaker.

TANNER WINTERHOF: Dave, we got a little advice from a couple of peers as we put this podcast together that it would be helpful if we identified ourselves at the beginning of each episode. So, for a new listener, I’m Tanner. This is the voice of Tanner, and I’m a banker in central Iowa.

DAVID WHITAKER: And I’m David, and I am a farmland sales auctioneer and a real estate agent in central Iowa, as well.

TANNER WINTERHOF: So, thank you, new listeners, for joining us. We really appreciate you checking in. We’ve got a little bit of an interesting time this year. We started out with the coronavirus. We had some weather events. We’ve got inland hurricanes. We’ve got regular hurricanes. We’ve got droughts. Everything’s all storming together, but we’re going to focus on something a little bit more exciting today. We’re going to jump right into what’s working in ag. Don’t you think, Dave?

DAVID WHITAKER: I think so. We’ll just call it hashtag 2020.

TANNER WINTERHOF: That’s all we got.

Farm 4 profit podcast focus on farm finance

DAVID WHITAKER: That’s what we’ll call it. We have a guest today. Who is our guest, Tanner?

TANNER WINTERHOF: We’ve got Dan Frieberg, and he is here to share with us a little bit about what’s working for ag in his company. A really neat background. He grew up on a farm in Iowa, graduated from Iowa State University. His career includes wholesale fertilizer sales, retail management. He also served as the CEO of the Iowa Fertilizer and Chemical Association, later the Agribusiness Association of Iowa, and other business consulting. One of his favorite beverages, if not the favorite beverage of Dan, can you believe this, is Diet Pepsi.

DAVID WHITAKER: There you go.

TANNER WINTERHOF: But what does this have to do with farming? What do you think?

DAVID WHITAKER: I tell you it has a lot to do with farming. So, Dan, tell us. I’m glad to see you’re an Iowa State grad. I’m glad to see you’re from Iowa. Anything we missed there, other than a good hair day and the Diet Pepsi thing?

DAN FRIEBERG: I think you got it nailed.

DAVID WHITAKER: Okay, great. Well, welcome Dan. Do you live currently in Iowa, still?

DAN FRIEBERG: Yep, just south of Des Moines.

DAVID WHITAKER: I got ya. And so, tell me a little bit about your company. What exactly do you do?

DAN FRIEBERG: We take agronomic data, help growers with agronomic data that they’re collecting to provide analytics and economics with farm finance. Then, that analytics turns into advice and an action plan for the following year. Most of what we do ends up with a variable-rate prescription that goes in a piece of equipment, whether it’s the grower’s equipment or it could be a retailer’s equipment.

DAVID WHITAKER: So, you’re basically working with the farm data. “Farm Data is the currency of the internet” is what I always tell Tanner. And you are taking that farm data, and then you are helping the farmer probably spend less money by doing variable rate throughout the field or making tough decisions to plant or not plant or certain things. That’s what I’m gathering. Is that correct?

DAN FRIEBERG: I don’t think we ever save growers money. I think that’s one of the mistakes that a lot of people made in precision ag in the early years. We’re 20-some years into this, and a lot of the early messaging was around saving growers money. And I think that’s an unfulfilled promise. In the case of variable-rate lime, it is something that we do that saves the grower money on liming costs. But, most of the time, I think what we do is, rather than positioning it as saving the grower money, it’s about investing within parts of fields to get a higher return. So, instead of treating the whole field as though it’s the same, it’s about identifying areas that are capable of producing more and more efficiently. And then in other areas, it could be that that’s where you save them money because it just doesn’t make sense to continue to invest.

TANNER WINTERHOF: I grabbed it right off the website that Premier Crop was established in 1999. And what it says right there is this: “They enable the growers to think deeper about their data.” So, what I grabbed from that is using that variable-rate technology. The way to make that pay is not necessarily saving money but maybe reallocating those input dollars to site-specific areas, to where you could probably get a better return on your investment than where they might’ve just been blanketly broadcasted.

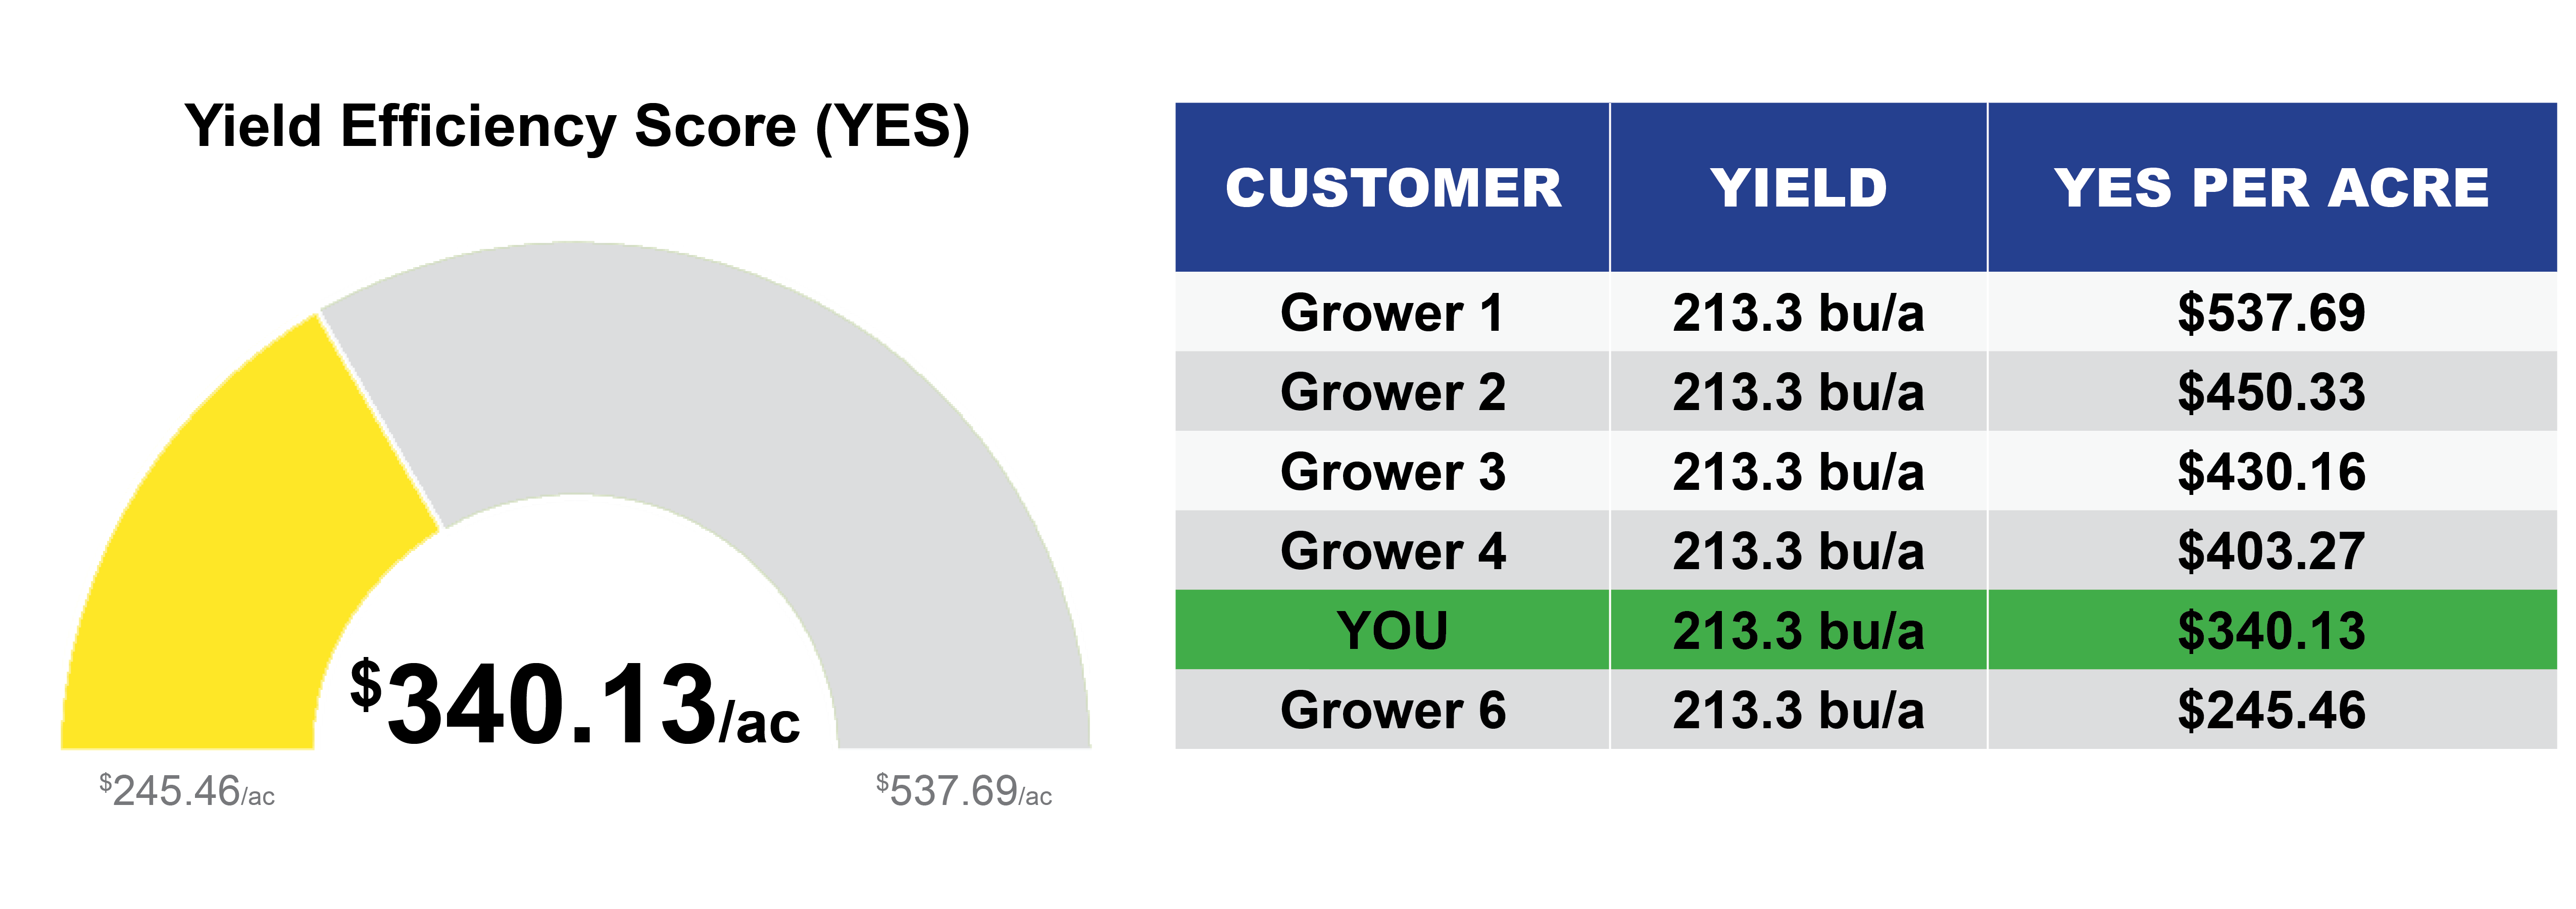
DAN FRIEBERG: Yep, I think that’s exactly right. I think maybe the other thing that we do differently is we have the ability to combine agronomics and economics. Right now, it’s really difficult to make money in a lot of areas. If we’re spending more in one part of the field, we’re able to actually tie the cost, the added costs that we’re investing in that part of the field, to the analysis. So, at the end of the year, we’re able to really deliver what we’re branding as a yield efficiency score, which is just dollar-per-acre return to land and management. For us, it’s about what’s been missing. We think there’s too much focus on just agronomics and not economics. I think right now, especially growers, they appreciate the focus on economics to help with farm finance. We like to say everything agronomic is economic.

farm finance and profits

DAVID WHITAKER: Gotcha. So, that’s a new term for me, the yield efficiency score that you have. Tell me a little bit more. Is it 100 is the best and zero is the worst, or how does your scoring system work?

DAN FRIEBERG: No, it’s really just dollar-per-acre return to land and management.

DAVID WHITAKER: Okay.

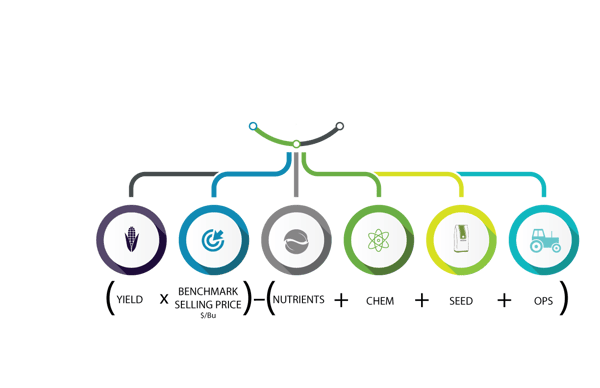
DAN FRIEBERG: It’s yield, and yield is tracked, obviously, with the yield monitor, a calibrated yield monitor. So, it’s yield at a benchmark selling price that the grower gets to set minus what they spent on nutrients, seed, crop protection and field operations. It’s kind of what’s left over. When a grower sees a yield efficiency score of $400, and they know they got $275 in land cost, then they immediately understand what’s left, the return to them for farm management.

Premier Crop Yield efficiency score

TANNER WINTERHOF: So, if we’ve got a listener here who hasn’t been using variable-rate technology before as part of their operation, is that a large hurdle to overcome? Or do they pretty much have the technology on most of these farms to be able to implement that?

DAN FRIEBERG: Tanner, I think if $7 corn did anything for us, it was that there was a lot of investment in new technology in the cab. When we had that run-up in prices and in profitability, growers put a lot and they invested heavily in upgrading planters. In the process of what happened during that time period, there’s a lot of technology in the cab, but there’s a lot of growers who aren’t necessarily using farm data to the full advantage. They have the technology. They have the ability to do it. They haven’t started because they don’t know how, and they’re looking for solutions.

DAVID WHITAKER: You said $7 corn. A lot of people updated their equipment there. But, for our newbie farmer that’s out there, or even somebody that’s been doing it, if they’re in an older combine, whatever it may be, and they decide they want to upgrade and be able to use your systems, is there a minimum-like entry? Something that they’re going to need for farm equipment?

DAN FRIEBERG: For us, we use the yield monitor as a way of measuring, measuring whether what we did was the right thing.

DAVID WHITAKER: Do they have to have a WAAS GPS or a certain sub-inch or anything there?

DAN FRIEBERG: No, just a GPS, a yield monitor with a GPS receiver.

DAVID WHITAKER: Okay, fair enough.

TANNER WINTERHOF: Pretty simple to get in there. So, Premier Crop Systems really allows that farmer to really get the investment that they put into that technology and put it to work. You guys can really work with them to use the existing equipment that they have to their full potential. One of the other things that I had come across when I was reading is it really keeps that farmer from farming on averages. You really come down and do check blocks and break that field out into, I call them, profit zones, but maybe you have a different term. Could you explain what you do when you break a farm down?

DAN FRIEBERG: Yeah, a lot of times that is what we do. We just try to identify, whether it’s management zones. We’re bringing a new version of that, which is performance zones, but it’s really trying to identify like-agronomic environments or unique agronomic environments within fields. It’s very much not treating it all like it’s the same. Tanner, within every field, growers will tell you there’s a sweet spot.

TANNER WINTERHOF: Yeah.

DAN FRIEBERG: Every grower who’s had a yield monitor has seen 80-90 bushel beans. They’ve seen greater than 100 bushel beans, and they just wish they could figure out what it was about that spot that made it so great. And that’s kind of what we try to help them do, identify those really high-yielding sweet spots, and a lot of times those are the ones that will respond the most to additional input investment. And then, conversely, there are areas that just don’t yield as consistently, and we try to solve the problem of whatever it is. We try to use farm data to help coach them on whatever those areas are. You’re in Huxley, and there’s a lot of potholes. There’s that north-central Iowa area. There are low areas. In wet years, they drown out. In dry years, they’re the highest yielding. They tend to be organic matter rich and nutrient rich because of all the years that they didn’t produce a crop. So, they’ll do great. They’ll do great in a dry year, but a lot of times we don’t invest near as much in inputs in those areas.

TANNER WINTERHOF: Yeah, take advantage of the resources that we have there.

DAN FRIEBERG: Tanner, the time is right, but it is tight on the farm. It’s really difficult to make money. That’s why farm finance and combining agronomics and economics is so important.

TANNER WINTERHOF: Yeah, it is.

DAN FRIEBERG: We have growers who tell us that some of this economic stuff we’re helping them with is what’s helping them convince their lender to give them the full operating line. So, we’re all about helping growers step up their game, and we know how difficult it is on everybody’s part.

TANNER WINTERHOF: It is.

DAN FRIEBERG: You guys don’t remember. I lived through the farm crisis of the 80s, and I was helping growers get financing. It was a dark and ugly time.

TANNER WINTERHOF: One of the things that I’ve noticed in the financing industry is that we have had more people utilizing creative financing methods, combining the dealer financing on their seed, getting some chem finance through their supplier, rather than getting their full operating through the bank. And part of that is our fault. We do get a little bit more conservative if we don’t have accurate records. So, I could see where Premier Crop Systems is valuable. And the fact that you can show me that, “Hey, we’ve got a plan. If mother nature cooperates halfway, we’re going to be able to put this plan to work and get us at least a crop that we can sell.”

DAN FRIEBERG: You guys know it because you’re interacting with growers. It’s a really high-stress time. When you see the farm suicide rate spiking, it’s reminiscent of just all the stress that’s going on with a lot of operations.

TANNER WINTERHOF: So, have you been advising any of your clients on what to do after the crop insurance adjuster shows up? Are you able to kind of help with a profitability calculation based upon what they’re learning after the derecho?

DAN FRIEBERG: Yeah, I mean it’s going to be difficult, like Corey will tell you. It’s going to be really difficult to get great data when you’re harvesting down corn. It really makes it difficult to have as much confidence in the data. It’s a struggle that way. Tanner, we’re right in the middle of it already because we’re starting to get ready for fall fertilizer prescriptions. If you’re not harvesting a crop, you’ve got nutrients that are in that crop that are going to get returned. So, you’re factoring that into your nutrient investment for next year, and so people are going to spend less on nutrients probably. But you’re trying to make sure you don’t short yourself in an area where you really need fertilizer manure to make it pay. It’s already started.

TANNER WINTERHOF: I’ve already heard guys talking that they might not be able to do as much corn on corn as they wanted to for fear of a volunteer coming up. Yeah, a lot of things are up in the air. I just got off the phone with a commodities broker who stated he’s got clients that just don’t know what to do. They’re in a limbo, waiting for the adjuster to show up, waiting for crops to dry down, waiting to find out what their options are.

DAVID WHITAKER: It’s an emotional roller coaster.

TANNER WINTERHOF: Yeah, any type of advice that they can get from a trusted advisor will go a long way.

DAVID WHITAKER: Yeah, it makes for an interesting year.

TANNER WINTERHOF: Well, Dan, I really thank you for joining us. I’m going to summarize real quick, and then let me know if we missed anything or if you want to share anything else. But we’ve got Dan Frieberg with Premier Crop Systems on the phone today, helping us out with our “What’s Working in Ag” segment. The company, started in 1999, enables growers to think deeper and utilize their data to make better agronomic decisions from that detailed data itself. They put the technology investments that you’ve already got on your farm to work for you. They want to make sure that you don’t think about farming on the average. Get down to a profit zone by profit zone analyst and management style, and then make sure that if you have a farm that is set up to where variable rate can pay, that it is not necessarily, Dave, the concept of saving you money. It’s more allocating those resources into a better part of the field that might make you more on the profit side. How did I do, Dan?

DAN FRIEBERG: You did perfect.

RENEE HANSEN: Thanks for listening to the Premier Podcast, where everything agronomic is economic. Please subscribe, rate and review this podcast so we can continue to provide the best precision ag and analytic results for you. And to learn more about Premier Crop, visit our blog at premiercrop.com.

Three ways to Use Data to Be More Profitable

If I asked you if you had a budget, you would most likely tell me you did. If I asked you where you could skim your budget in order to save more for your child’s education, a new truck or a vacation, you most likely wouldn’t know where to start. I know I wouldn’t!

This is really no different than farming. If you don’t have it written out, in detail, with all of your expenses and projected income, would you know where to start to be able to be more profitable?

First, you have to figure out what your profitability is throughout the field.  You can do this by adding up all of your inputs on your field (flat rated & variable rated) and adding those costs appropriately. When I say appropriately, I mean making sure that variable rates are accounted for.

Next, you have your income from your crop to add to the equation. But, your yield map is variable, so your cost of production is variable. See where I’m going with this?

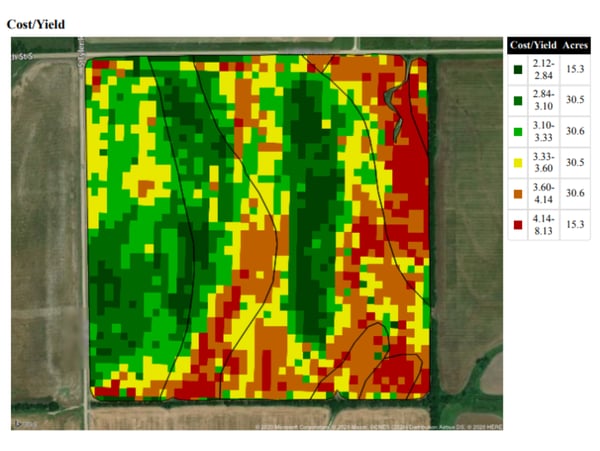
Using your data to create a profitability map, like this one, can identify those areas.

cost per yield map

Think about this number:  If 10% of your fields are losing money and let’s hypothetically say they are losing you an average of $2.00/bushel, that equates to some serious money loss when you scale it across your entire operation!

But, as my brother asked me once about our own family’s field when I showed him our home field’s profitability map, “That’s great, Katie, but what do you do with this map?”  Using the data and the technology that a grower has available to them, that’s when the magic happens.


HERE ARE THREE WAYS A GROWER CAN USE DATA TO BE MORE PROFITABLE


1. STOP TREATING ALL FIELDS THE SAME.

They don’t all produce the same, so why should they have the same yield goals?

2. DEVELOP A PLAN TO SPATIALLY MANAGE YOUR INPUTS WITHIN EACH OF YOUR FIELDS.

You don’t have to have all the latest and greatest technology. But you can use your data to help you improve your profitability within your operation. Your trusted advisor should be able to help you with this if you are unsure.

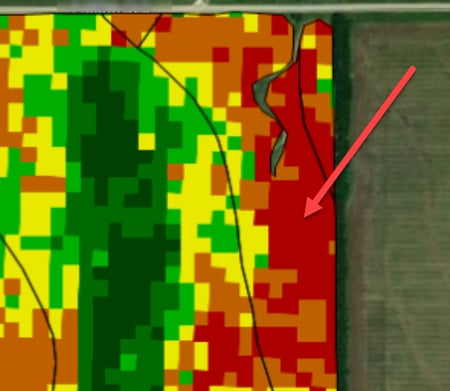
If we look at this example, these areas in red only removed off a portion of the nutrients that areas in green did.

premier crop nutrient removal rates

premiercrop_nutrientsremoved

Let’s give a hypothetical example: If we use $310 for the price of MAP and Potash, the difference in dollars removed is $5.20 and $6.30/acre, respectively.  We could use this information to make sure that our nutrient application accounts for these values in order to spend our nutrient dollars efficiently.  We’re all looking for ways to maximize every dollar and ensure that it returns us the most amount of profit.


3. USE YOUR DATA TO MAKE DECISIONS FOR THE NEXT CROP SEASON.

This requires you to listen to what the data is telling you. Using your data provides you the facts you need to make more profitable decisions.

We were led to believe that the Precision Ag technology could make us money or save us money. However, it’s the DATA that we use in combination with the technology that enables you to be more profitable.

Changing your outcome is only possible when you do things differently than what’s been comfortable. But, just like your own budget, knowing where to change is essential. Your trusted advisor is by your side to help you make these essential decisions and improve your overall farm profitability.

Six Frustrations with Precision ag

“Growers tell me they are frustrated with precision ag, they’ve invested in the technology. I tell them, ‘You just want to put the pieces of the puzzle together to see exactly what the picture is.’ And they are relieved when Premier Crop can help.”

– Katie McWhirter, Director of Training and Development


RENEE HANSEN: Today, we’re talking with Katie McWhirter, our Manager of Training and Development. Katie is chatting with us about the frustrations of precision ag.  Katie, tell us a little bit about your background and a little more about you and your role at Premier Crop?

KATIE MCWHIRTER: I was born on your typical farm in southeast Iowa, livestock and row crop. My father’s just now retiring, but funny as he is, he is in his late sixties, and in 2013, he invested in electric drives to be able to variable-rate seed. He variable-rates his fertilizer. He does all that, which is so not what people think of that generation, embracing technology like that, but he knew that, working with me, he’d be able to make use of that equipment that he was investing in. Then, on the flip side, I have a brother who was, I guess for lack of better words, gifted or brought into the row crop world. He’s actually in the livestock industry and doesn’t have that technology, but we started talking one day, and he said: ‘I think I can use my data to do better. It’s not that good.’ So, talking with him, does he have the latest and greatest? No. But, again, his data is everywhere, and it’s just meeting him where he’s at to say, okay, I realize you don’t have this technology or this technology, but we can still use what you have to make a better decision. Even as recent as about an hour ago, I’m entering in some of his costs and his inputs to really make him see that there is variability within his operation even at a field level, which means profitability is variable at that field level. So, I’m excited to watch his journey as he gets more into this space.

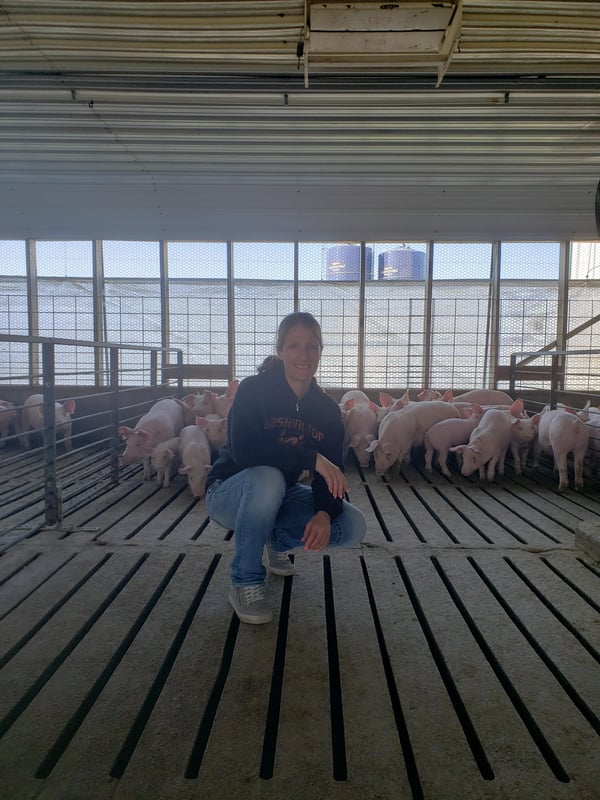
20210405_170325

FRUSTRATION #1: CONNECTIVITY

RENEE HANSEN: So, Katie, what would you say? We were talking before we hit record on this podcast, how do you come up with a list of five to 10 things that growers don’t like or are frustrated about with ag technology?

KATIE MCWHIRTER: Well, those frustrations definitely vary in the different hats that I wear. Probably the biggest frustration is that these technologies, if you’re talking about in or on the equipment, would be that they don’t communicate together, especially if they’re not a solid color, meaning they’re not all the same brand of equipment. That is a frustration for growers. I would say, also, a very big frustration, and funny as I’ve been out here in the last couple weeks, growers don’t think that they could, I wouldn’t say, benefit from our services, but they’re very worried because they don’t think their data is good. So, it’s two combines, it’s three combines, it’s not calibrated. How can you change some of these frustrations? What we can do, is take that data, and as long as it’s capturing that variability and we have an end measurement, whether that’s going to be bushels or yield, we can post-calibrate or make that data usable within our system. I think even the simplest technologies really can benefit from what we do.

I think one of the things I’ve learned is that we really have to ask questions to these growers to find out, when they talk about ag technology, no different than what I did with you, to find out what exactly they’re frustrated with. If they’re frustrated with data, what do they mean by that? I mean, is it they’re frustrated because they’ve got two or three combines or two or three planters and it’s not all brought together? Is it because they don’t feel like they’re getting a complete picture? I met with a grower yesterday who said: ‘The soil sampling is here. We’ve got these spreadsheets on our computer. Their data’s all over the place.’ I smiled, and I said: ‘You just want to put the pieces of the puzzle together to see exactly what the picture is.’ They’re like: ‘Yes, that’s what we want because we’ve invested in it. We know that each of those separately has been bringing us value, but it’s also bringing us frustration as we know we should be bringing them all together to make an even better decision.’

FRUSTRATION #2: DATA ISN’T GOOD ENOUGH

RENEE HANSEN: What was some of his biggest hesitation? I know you mentioned that he felt his data wasn’t good enough but elaborate on that a little bit more. Tell me more about that.

KATIE MCWHIRTER: Well, the yield monitor doesn’t have a card in it, so we haven’t been collecting yield data. So, I mean, the basics of what we’ve always said is a must. It’s really what we’re rooted in, but with our new planning tools, I immediately was like: ‘Okay, but there’s so much more we can do even by putting together, at the field level, his yield goals and his expected revenue and his variable-rated nutrients because he’s been grid sampling.’ Even though he doesn’t have what we, even a month ago, thought was an essential piece of what we had to have to be able to work with a grower, he’s going to test me on this one because he’ll get a yield monitor. That’s the agreement by fall, but I believe we can still provide him value being early enough and being able to identify his yield efficiency scores, his planned yield efficiency scores in each field, to be able to potentially identify profit robbers and how we could try to lessen that on his operation as a whole. Yeah, he definitely was hesitant until I showed him. I’m like: ‘Here’s what I need.’ And he immediately says to me, he’s pointing at the paper, and he’s like: ‘I’ve got this. I’ve got this. I’ve got this.’ I’m like: ‘Yeah, you’ve got the pieces. Let’s get them put together.’

RENEE HANSEN: Yeah, putting it together all in one system, and you also mentioned connection and connectivity. I mean, that seems to be everything’s everywhere. So, you also tell me, what are you doing to help him solve that and get all the information into one spot? I mean, you are doing some of the work for him.

KATIE MCWHIRTER: Right. So, I get the pleasure of contacting the people on his agronomy team. I think, before, some people might’ve seen us as the competition or a threat, and what I’ve said to both his seed supplier and his crop protection and fertilizer salesperson is I’m not here to step on your toes. I don’t sell those things. What I’m doing is I’m trying to help him be more profitable. That’s been fun to talk with his team, and, in fact, as soon as I start putting these pieces together, I want to meet with his team and show them what we’re trying to do for him in order to make him a more profitable farmer.

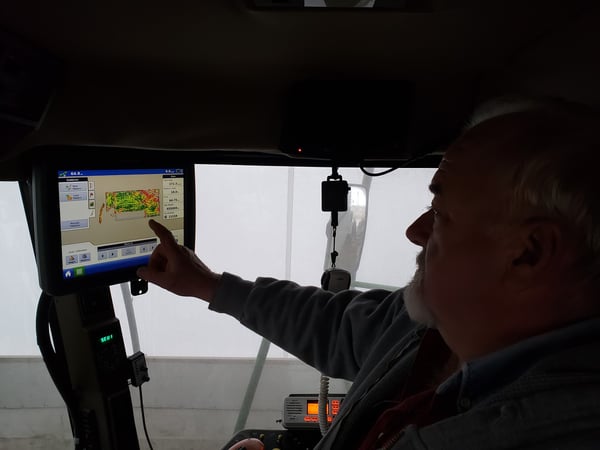
inthecabyieldmonitor

FRUSTRATION #3: DIFFERENT COLORS OF EQUIPMENT

RENEE HANSEN: Yeah, and what about the color of equipment with numerous different colors of equipment? Or the farmer, the grower, isn’t applying some of their inputs. Somebody else is doing it for them. How do we go about getting some of that information?

KATIE MCWHIRTER: Oh, definitely. Again, I met with another grower yesterday, and as we’re talking, sometimes they think all this information has to be captured somewhere or captured on a monitor. It has to be captured somewhere, but there are so many different pieces of information that we keep track of. I think that is a really big misconception, what data is. Some people, I’ve laughed, they think it’s a singular thing. For us, it’s a plural. I mean, so much data can be collected not necessarily on a monitor. So, putting that all together in one system, be able to look at it, to get a clear picture as far as what’s correlating yield or, more importantly, what’s driving profitability or, better yet, holding the entire operation back from being more profitable.

FRUSTRATION #4: IS A PRECISION AG SERVICE PROFITABLE 

RENEE HANSEN: Yeah, you’re talking about some of the things that they can start inputting and putting the pieces of the puzzle together. So, what’s the output? What do they get? What are we giving a grower? How is it going to benefit him?

KATIE MCWHIRTER: What it gives the grower is a clear picture of their operation as far as profitability, that return to land and management. The numbers don’t lie. I mean, I’ve always said the numbers do not lie. Take the emotion out of it, but that’s not where it stops. Essentially, it’s a continuous cycle. Don’t give me a pretty map, and that’s great, right? Don’t give me that. I need you to be able to, and our growers need us to be able to, without any bias, to say: ‘Here’s what we could do with it.’ Ultimately, it’s going to be the grower’s decision, and that’s what I was telling the grower yesterday. We’re never going to do anything that you don’t want to do, but we will challenge you as far as this is what we’re seeing in the data, and if you’re wanting to improve, it really looks like this is an area that we could focus on.

FRUSTRATION #5: FEAR OF CHANGING EVERYTHING AT ONCE

RENEE HANSEN: Yeah, something that you mentioned, Katie, was it’s a continuous cycle and how it’s never ending. You’re constantly learning. So, even at year one, there is so much that we can learn about. So, tell me, what does a grower learn at year one?

KATIE MCWHIRTER: Which is funny because, when I got back into working directly with growers, that was one of the questions that they asked me when we were first sitting down: ‘What do you think we’re going to learn this year?’ As I was getting all this data from him, and I’m like: ‘I don’t even want to take a guess.’ I have a suspicion, but I don’t want to say it out loud, but I think it was just their biggest ‘aha’ was I’ve never looked at my data like this before. I’ve seen it on the typical red, yellow, orange, three-shades-of-green map. Maybe I’ve done a little bit of comparison in some of these other platforms before, but never have I looked at it this way before. Whether that was in charts or in our data visualization tools and then, ultimately, to tie those costs back to it. Some of the things they thought, they were right, and some things they were kind of surprised, which has led to decisions. When I started with them in August, I mean, I told them I was not going to push them to anything that they didn’t want to do technology-wise. All of a sudden, we’re sitting down for our planning meeting in December. I’m like: ‘Oh my goodness. Four months ago, this is not where we were.’ I didn’t think this is where we were going, and now we’re jumping in the deep end of the pool. I don’t want you to do this and be uncomfortable. I want you very comfortable with the changes that you’re suggesting we make. That’s been fun, though, to lead people through because we all know that change is hard, and it’s very hard to get outside of our comfort zone. So, I actually start my sales training, my leadership training course, with: ‘Here’s your comfort zone, and outside of it, that’s where the magic happens.’ That’s so, so true with farmers.

premiercropyielddata_farmer

FRUSTRATION #6: DATA IS OVERWHELMING

RENEE HANSEN: I really think, and I see it too, just within our own family operation too, that sometimes you can get so comfortable diving into something new, they want to, a grower wants to get into something new, but it’s like, where do you start? How do you get started? It’s having a service, something that Premier Crop offers, something that you offer, just helping them, starting to input the information, contacting the people to get the information, knowing who to contact. So, right now in 2021, we’re at the beginning of March. Why would a grower need to get involved in something like this? Why should they wait?

KATIE MCWHIRTER: I don’t think they should wait. I think it could seem very overwhelming and don’t know where to start. It just takes that conversation to get them going. Really, I say, that’s why it’s so wonderful that we have the great group of advisors that we have to guide them through this process. We all like to be guided. We all like to know what’s next. I don’t care if it’s the program at church, the bulletin to what’s next. Or when you get on an airplane overseas, and it’s saying: ‘Here’s what’s going to happen. Then, this.’ That just puts everybody to ease and guide them along. Our advisors, it’s like we farm with them. I mean, I know I wasn’t going to go back and farm, but that love of agriculture and helping farmers, that’s our group of advisers. That’s their characteristics, their qualities. They genuinely want to help because it’s like they’re farming.

RENEE HANSEN: Thanks for listening to the Premier Podcast, where everything agronomic is economic. Please subscribe, rate and review this podcast so we can continue to provide the best precision ag and analytic results for you. To learn more about Premier Crop, visit our blog at premiercrop.com.

Learn more about the power of precision ag.

Unlock Insights to Your Farming Operation

“Data is valuable, but data in the hands of the right people with the right context is really, really valuable.” – T.J. Masker


RENEE HANSEN: You are listening to the Premier Podcast, where everything agronomic is economic. Today, we are talking with T.J. Masker, Senior Product Manager at Tractor Zoom, headquartered in Urbandale, Iowa. They are focused on helping bring price transparency to farm equipment and valuations for farmers, bankers, equipment dealers and insurance companies. T.J. has a lot of experience and knowledge in the precision ag space, and today, I asked him questions on how to unlock new insights to your farming operation using precision ag. Hey, T.J., welcome to the Premier Podcast. Just wanted to talk to you a little bit about unlocking some of the new insights to a farming operation, and I know you have a lot of experience. So, can you tell us a little bit about your background?

T.J. MASKER: Yeah, I grew up on a small family farm in southwest Iowa and did the traditional thing. Went to Iowa State, got an ag business degree, but for the last, well, about 11 years of my career, I’ve been working directly with farmers, helping them manage and understand their data better. So, whether that be agronomic data like soil tests, machine data that we get around like fuel usage or, in my current role helping farmers really value farm equipment, as that’s becoming the second highest cost on the balance sheet. What we’re really trying to understand is how we can make better decisions from that data. But the common theme is that ever since I went to Iowa State and graduated college, I’ve been passionate about helping farmers with data to make better decisions.

RENEE HANSEN: Yeah, you’ve had a lot of experience with data since you’ve been working in the field. So, can you tell me that? What is your experience with other precision ag systems, and what makes data so important?

T.J. MASKER: Yeah, I remember this, probably, like it was yesterday. I was covering a territory in south-central Iowa for one of the major seed brands. And I had farmers who kept asking me, like: ‘What can we do with this data? How do we start to think about how we utilize it more?’ This was almost eight years ago, and I literally Googled, like, ‘farm data’ something or another, and it led me, ironically enough, to Premier Crop and filled out the ‘contact us’ button. Then, I think it was Tony or Ben or somebody who reached out to me about: ‘Hey, we’d love to talk to you, understand where you’re coming from.’ And that ultimately led me to working with Premier Crop about seven-and-a-half years ago and doing direct advising with farmers in central Iowa. And many of those farms that I worked with back in the day, I’m still really close with today as I’m trying to solve new and unique problems, but I think, at that time, I had zero experience with precision ag. So, I had to learn how to set up the monitors, what Ag Leader SMS was, what software was to make better decisions. It was also my job to go out and recruit farms and help their operation. So, I think, over that time, I had to learn a tremendous amount about precision ag, what it was capable of. But, ultimately, I think for me, what it came down to is there’s so much value in this data and what we can get out of it if we’re measuring things correctly. And I think one of the things I experienced, even with the farms that have been collecting data for 15 years, was that, man, if we get this data structured in a way, it’s going to allow us to unlock so much potential. And whether that be if you’re using Climate FieldView or using John Deere Ops Center or using Granular, where I was at. It doesn’t matter unless the data is structured in a way that you can get the results out of it. And that, to me, was always the biggest ‘light bulb moment’ for a lot of the farmers.

RENEE HANSEN: Yeah, so since you’ve had the experience working with multiple different systems, what makes a specific platform better than another?

T.J. MASKER: When I talk to farmers about it, it’s really measuring the ROI, I think. Dan, I probably coined his phrase too, but if every agronomic decision is an economic decision, and we think about things that way, it fundamentally changes why we might do something. So, I think about systems that are able to actually provide that value to you as a farmer, and there’s not a ton of them out there. But we also need those systems that allow us to move data more easily. So, that’s why Climate, John Deere Ops Center, Ag Leader AgFiniti is another great example. Those tools help us get the data from the farm into the trusted advisor or the partner’s hands really quickly to make better decisions. That is valuable. I can tell you that there’s a reason why those tools are so heavily used because it solves a pain point. What I like to think about is: that’s one step. The next step is taking all this data and turning it into a better plan for next year. So, if I was at Granular, the way I described this problem is like: ‘I need to understand what we did and then how we did to understand what we need to do differently next year.’ So, if you focus on farmers collecting all this data on what they did, let’s get the scorecard for how they did at the end of the year. So, tools like Premier Crop. You think about all the things you can do with the query tool to answer questions from your data. Then, the real power is like: ‘All right. Using all this data, I now know with a high level of confidence going into next year that I’m going to have the best possible plan I can have.’ Mother Nature and God willing, things are going to fall into place. Well, let’s use everything we’ve learned to come up with the best possible plan, and we’ll adjust in season, right? Planting could get delayed by two weeks, so we might have to adjust seeding rates. All those things come into play, but let’s start with the best possible plan. And I think that starts with collecting and analyzing really great data throughout the previous growing season or previous seasons if you will, if you think about how many years of data a farm might have.

iStock-653836730

RENEE HANSEN: Yeah, I think you said something in there, like competence, where a grower just really needs to have that competence within the data. They’re collecting so much of it anyway. So, getting a grower started, it seems really overwhelming sometimes, just to get started with data because of the systems that you mentioned. They have Climate. They’re using John Deere Ops. Then, to add another system to their whole platform can seem really overwhelming.

T.J. MASKER: What’s funny is I’ve done customer discovery the last seven-plus years in my different product roles, and if you talk to every farmer, they’ll tell you they just want one system to manage everything. And the reality is that’s not possible. I think what we need to do as an industry to be better is to make things connected more easily, and you’re starting to see that. And the easier we can make it to connect different parts of the puzzle to the key people that need it, that is where you really drive value for the farmer. Because if you think about all the trusted people that the farmer is working for, you’ve got agronomists. You’ve got an equipment dealer. You’ve got a seed rep. You’ve got a banker. You’ve got probably a commodity broker advisor, potentially. So, you start to see all of these people that are helping the farmer with all the information that they have. It becomes really powerful if you can connect all those dots, and I think, for a while, we as an ag industry or a tech industry didn’t do a good job of this. I think everyone was trying to build a complete way to solve every problem. And now you’re starting to see that change quite a bit, and I believe it’s for the better because the more connected these things are, and the less you can alleviate a lot of the pain of getting data from one spot to another, the better off everyone’s going to be.

RENEE HANSEN: In one of our previous podcasts, we talked about how you need to connect all the pieces of the puzzle, and it sounds exactly what you’re talking about. You just need to connect everything together. It’s one big puzzle, and when you finally get it together, it starts to work like it’s more of a system. Growers have all this information. They have these systems. They have monitors. They have the tractors, like you said, that they’re heavily invested in. So, why would they invest in a service that helps them manage their data, that helps them make better decisions? Why should they do that?

T.J. MASKER: Yeah, I think this is really important, and I think understanding who you’re partnering with is really important too, from a farmer perspective. So, I think you’re going to see a lot of the bigger ag companies continue to invest in this space for good reason, right? They know there’s a tremendous amount of value in this data. What I also think is extremely valuable is what that independent advisor can mean to your farm. For example, I was out at one of the farms I used to work with on Friday, and we talked a lot about this. If you think about 7-8 years ago, where they were at, they were trying to manage it in house. They were writing their own fertilizer recommendations. They were collecting all their data. And now, fundamentally, they’re approaching things differently, and every year they’re trying to chip away at this thing. So, a great example is when I started working with them 7½-8 years ago. We talked a lot about: ‘Wow, you guys can grow really great soybeans. What if we grew more soybeans, for example?’ It was funny to talk with them on Friday. And as they approach planting season this year, they’re going to start one planter on corn and one planter on soybeans at the same time because the data has shown them that if they get in earlier on soybeans and get those soybeans in, there is X-yield gain from that. And that wouldn’t have been the case seven-and-a-half years ago. What data allows us to do is to test little things, and the way I always approached it with farmers was like: ‘Give it three years.’ We have the data that tells us that this decision is likely to produce a positive outcome. If we try it, we can’t just try it for one year. We have to commit to trying it for three because odds are, over those three years, we’re going to see that return. So, I think that’s where the power of having a system or a service to manage that is critically important. And I think you’re starting to see a few others come up in this space, as well, because they probably realize a little bit of the model of that trusted advisor is the most powerful model. And it’s because, fundamentally — again, I think Dan will probably laugh — but agronomy is local. What works for the Des Moines Lobe might not work as well where I’m from in southwest Iowa. It might not work as well for my buddy that farms in eastern Iowa. Data’s valuable, but data in the hands of the right people with the right context is really, really valuable. I think a lot of farmers are frustrated with managing that data. So, how do you find somebody that can help you and kind of provide that ROI? And, at the end of the day, they have to prove their worth, right? Fundamentally, they have to prove their worth, but I think they’d be surprised what they would see from partnering with somebody like that.

RENEE HANSEN: Yeah, definitely. Like what you said, there is definitely a shift that you’re starting to see with farmers, that they are wanting to see more of their data and utilize more of their data, where in the past, there was a lot of resistance and maybe because the market was too flooded. So, what would you tell a farmer who has resistance to working with a precision ag service?

T.J. MASKER: Once, I think I called on a farm for three straight months that was resistant to this, and it wasn’t because they didn’t see the value. It was that this was a piece of their operation that was so important to them that they’d been trying to figure out. And I think one of the things is when you have a group that’s been around for, let’s say, 15-20 years, there’s a lot of value in that versus I might be a little bit more skeptical of somebody that’s only been around a year or two because there’s that track record there. So, what I would think about looking at is who has a track record? Do they have farmers that are willing to talk to them about why they decided to partner with this person? Because, at the end of the day, we know there’s value in the data, but maybe there’s an opportunity for a farmer to share their story with another farmer that’s a little bit resistant and tell them: ‘Hey, I was exactly where you were at seven years ago, and now the way we do things seven years later is fundamentally different.’ So, I would just be open to having that conversation with others that are finding success in this area and help them along in their journey.

RENEE HANSEN: Well, sometimes, you get in a pattern where you are very comfortable with what you’ve been doing the past years, and you’ve been successful. You’ve been profitable, but there comes a point where there’s a tipping point where your margins are starting to get a lot thinner, and a grower needs to maybe change some practices. And that data can tell you exactly what practices to change.

T.J. MASKER: Yeah, it definitely can. I mean, all these things come flooding back to my head, but you think about some of the marginal areas of your farm that just don’t produce much. We did the math 5-6 years ago, and it said: ‘Hey, if we don’t apply dry fertilizer on these spots, we can save an average of $5 an acre across all the acres.’ And the reason why we weren’t going to apply there is: one, we didn’t expect the return, and two, guess what? When we analyzed the soil test results by those areas, they were, a lot of times, the highest soil test values, which, if you back away from it, makes a ton of sense. Because if you’re applying the same rate of fertilizer across the field, and the good parts are taking off more, you’re going to see these lower-yielding spots, for example, have higher soil tests. So, you start to tell that story, and all of a sudden, you’re like: ‘Wow, just by doing that one thing, I’ve saved $5 an acre across all my acres.’ I don’t know what fertilizer prices are at today. Normally, I’d have a better pulse on it, but it might be higher. It might be $6-$7. I don’t know. But you start to approach things from that standpoint and manage each field like it’s its own kind of factory. I know there’s that analogy out there, but it really does make sense when you start to look at it at that level.

RENEE HANSEN: And a lot of companies are talking about data science and machine learning, and they’re trendy words. I don’t want farmers to get afraid of companies starting to use this because if they are resistant to using precision ag, they’re going to think: ‘Oh, well, now they’re just turning this into something that’s more automated.’ So, what do you think companies mean, and what should a farmer know about data science and machine learning within the precision ag space?

T.J. MASKER: Yeah, so companies are investing a lot of money into data science, and it’s an ability to take a lot of the data we have and try to learn really quickly. Versus a traditional method would be: ‘I’m going to evaluate this year’s crop. Then, I’m going to go around and, then, implement three practices that I learned from this year’s crop.’ Versus: ‘Hey, could we speed this up through data science and machine learning and try to learn from 15 crops and apply that knowledge to one year?’ What I will tell you is that most farms that I’ve worked with, and I still believe this to be the case today, is that they want to learn from the data on their own farm, but that also means that they can leverage data science on their own farm. So, the way I would think about it is to think about trials that you’re running. How are you setting them up? Because that truly is data science in its very, very simplistic form, but that’s what it is. We’re trying to test and validate things and use the data. Another trend, like with machine learning, is you’re going to hear more and more about ‘combine automation,’ which is real. I think I was listening to a podcast the other week about how they go out to a farm and demonstrate this to a farmer. Because most people would say: ‘Hey, I know I can adjust the settings on my combine better than any computer can.’ So, one of the things they do is they completely purposely set the settings wrong on the combine for one pass, push the button and watch it adjust. And they watch the farmers’ eyes light up with how quickly and how accurate those adjustments are, and I’ll tell you the tech side of things. As I’ve been talking to farmers specifically about equipment, the tech side of things is tying more and more into that equipment-buying decision. So, what technology are you using? Who’s the provider, whether it be John Deere or Case, or what’s the system that’s going to manage it? And they’re starting to talk more about making decisions for new combines based on automation, which is machine learning which taught that. I think you saw some announcements from John Deere in the last two weeks with the See & Spray technology with the acquisition of Blue River. So, this stuff is going to keep coming, and it’s going to come pretty fast. But at the end of the day, it’s just like a trial on the farm, where seeing is believing. And I think once you see this technology in the hands of different people, you’re going to see people adopt it at different rates, but I’m pretty bullish on the ‘combine automation’ stuff just because of what I’ve seen and what it can do. And I know, from direct feedback from 50-plus farmers over the last four weeks, that is something that they’re looking at.

RENEE HANSEN: Yeah, it’s pretty incredible, the advancements that they’re making within the technology, just with the tractors, the combines. But, then, also kind of going back to that data, too, and data science, where if a grower is anywhat interested in their data, having to layer all of that in a spreadsheet of Excel and having your brain trying to figure it out, it’s just too difficult. Let the computer do the mathematics for you. I mean, that’s the whole purpose of the data science. It’s learning through your data. So, I’m just kind of reiterating what you were saying, T.J. You’ve shared a couple of stories. You shared that you talked with 50 farmers within the last four weeks. What are some of the most successful stories that you have from a farmer using precision ag?

T.J. MASKER: Yeah, I remember this was kind of the fun one and like the best case study that I have. It was that we started working on a problem, and the same thing applies to product management if I’m trying to solve a problem for a farmer. But it’s like: ‘What’s the goal here?’ And it’s like: ‘The goal was to increase soybean yields for this specific farm.’ They couldn’t get above 45 bushels. So, we started to break down the problem and study the group data that we had, to say, okay, well, we haven’t ‘limed’ in five years. Maybe that’s something we could do. Another thing that the farm hadn’t done in five years was try a different seed brand or variety. So, that’s another thing we could do. Another thing they typically did was only fertilized ahead of the corn crop. Okay. So, let’s split up that application. So, we literally picked a field and said: ‘We’re going to kitchen sink it, and we’re going to try everything we can. And we’re going to make sure we have trials set up within the field.’ I think we ended up hitting 75 or 80 bushels per acre, which was almost double what their average was. Now, granted, Mother Nature cooperated and rained when it needed to rain. But the point was we were able to say fungicide meant ‘this.’ A different variety meant ‘this.’ Using lime, dry fertilizer on this part of the field meant ‘this.’ And we literally laddered it up to that number. To me, we can spend a lot of money on inputs and resources, but doing that, and actually just calling it the ‘kitchen sink’ but having our checks in place, fundamentally changed how that farmer grew soybeans moving forward. And we were able to increase the average over a lot of acres, 15 bushels. But if we didn’t identify what the core issue was and start to think about how we strategically implement different tests, we would have never gotten there. And I laugh because the same thing exists in product development, where you’re trying to build things for farmers. It’s like: ‘What’s the problem we’re trying to solve? How do we prove value, and how do we incrementally get there?’ So, whether it’s agronomy or software development or building the next widget for a John Deere tractor, it’s all the same when you break it down. It’s how you solve problems and measure it to make improvements.

RENEE HANSEN: Well, that’s a great success story, and the fact that, just in one year, how much they can learn and then take it to the rest of their operation over the next 3-5-10 years. And the profit that you’re getting out of that service is tremendous. I mean, it’s definitely worth the cost of the service.

T.J. MASKER: Absolutely.

RENEE HANSEN: You mentioned a little bit about where precision ag is going in the future, but where do you think precision ag is in the software space? So, we talked a little bit about automation with tractors and combines, but what about in the software space? Where do you think precision ag is going?

T.J. MASKER: I think it’s going to continue to get ‘smarter,’ which is kind of an annoying tagline, but it’s going to get smarter about how much you’re applying what rate on what date. A lot of this, we’re getting so good at understanding the impact, and we have enough data to understand it. I also think I’m pretty confident — we saw it in a past experience. I see it in the current one. The value of the mobile device and whatever you have with you is going to continue to dominate this space from a software perspective. You think about: ‘I can pull up Climate or the Ops Center on my phone and have an answer really quickly. I want to show my landlord how the field yielded in a second.’ Farmers are going to continue, in my opinion, to demand that the tools they’re using be accessible from anywhere. And so, precision ag, yes, there’s the technology in the cab. Yes, that’s important. But I would argue that this device — the phone, the tablet — probably more so the phone than anything is going to continue to be such a critical piece. It’s how farmers run their business, and they expect to have things on their phone. So, I would think if I’m working with a provider, that is going to be one of my number-one needs, and it’s also going to drive a lot of engagement for that farm, as well, which is critical for any tool you’re trying to use because a farmer’s going to get value out of a lot of things. But having that answer really handy with them whenever they need it is very, very valuable.
iStock-489255170 - edited-1

RENEE HANSEN: Yeah, getting your data any time, anywhere, I think, is kind of a little tagline that we use, even with one of our mobile apps that we have within Premier Crop. But I think I agree with you that farmers want it. They want to pull it up, and they want to see it. They need to show it, whether that be the banker or the landlord themselves. So, they’re looking at the field, getting ready to plant, getting ready to harvest. All of the above.

T.J. MASKER: Yeah, and it has to be easy to use, which is such a challenge, right? Because if you talk to the 50 farmers that I’ve talked to, you’re trying to pull out the nuggets that are similar between all of them, but there are always unique use cases. But I think as long as you’re solving for the 90%, you’re going to be well on your way to help the farm make better decisions, which is ultimately everything that we’re about and trying to do.

RENEE HANSEN: Great. Well, thanks, T.J. Thanks so much for joining us today. Really enjoyed all of your knowledge and your experience and sharing on the Premier Podcast.

T.J. MASKER: Awesome. Thank you.

RENEE HANSEN: Thanks for listening to the Premier Podcast, where everything agronomic is economic. Please subscribe, rate and review this podcast so we can continue to provide the best precision ag and analytic results for you. And to learn more about Premier Crop, visit our blog at premiercrop.com/blog.

Learn more about farm profitability.
Are High Yields More Profitable?

Why do you put so much focus on driving higher yields per acre?

Is it a feeling of social responsibility to help feed the world? A sense of pride or feeling like you’ve won a contest? Are you wired to achieve – a constant quest to do better? Does it stem from your school days or parenting – always wanting to have a great report card?

For many growers we work with, we don’t believe any of those motivations are the driving force towards higher yields. Growers are generally pretty quiet about their high yields. For them, it comes down to a simple business reality – high yields drive profitability.

Business and economics professors have ingrained in us that some business costs are fixed and others are variable. Fixed costs are the same regardless of units produced. Sometimes, they are referred to as “sunk” costs because it’s what you sink into the business just to be in business. In crop production, we frequently consider our investment in land – either through ownership or rent – as our largest fixed cost.

Over the decades, we’ve replaced labor with larger equipment that has fueled dramatic productivity gains. But that increasing investment has increased the fixed cost of crop production in many operations. Farm economics professors will frequently list nutrients, seed, crop protection products, fuel and hired labor as variable costs. But for most operations, that’s not an accurate characterization. What percent of seed cost, herbicide cost or nitrogen cost is truly variable?

Everyone plants hybrid corn – so the real seed cost that is variable is the portion above the cost of a high-yield, non-traited hybrid. In corn production, most growers are going to apply a minimum of 100 lbs. of N per acre in some manner. The portion of your nitrogen investment that is truly variable might be the final 50 -75 lbs/ac. Choosing the cheapest herbicide program can be an example of “playing with fire” (boosting weed resistance for higher future costs). So is your herbicide program really a variable cost?

Lenders can be quick to encourage cost-cutting. But cutting nutrient, plant health and pest management investments can cut yields. In a high fixed-cost business, dividing those fixed costs over more units of production is usually the path to higher profits.

We frequently lead our customers to spend more input dollars only on the best field zones. That is possible when you can track and record those cost/investment differences like we do, then share a profitability analysis at the end of the growing season.

In corn and soybean production, you can spend your way poor but you can’t save your way into prosperity. Frequently, the only way to lower your cost per bushel and increase profits is to produce higher yields.

New call-to-action