When Two Negatives Make a Positive

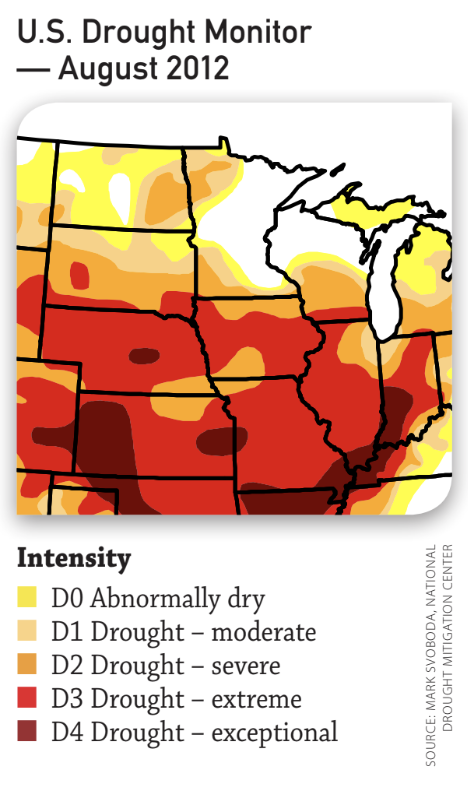
When we look back to 2012 it was historically dry, and 2013 started out wet and then turned dry. As some growers in the Midwest face yields below expectations, they’re finding new and different ways to learn from their data.

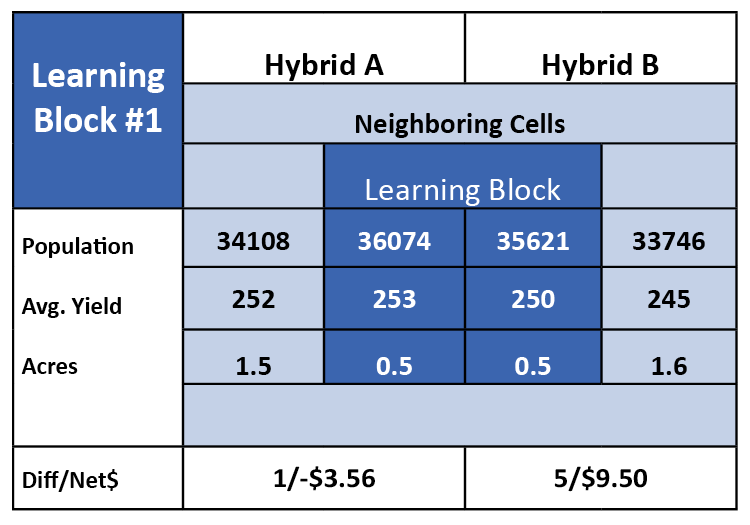
During the 2012 drought, north-central Iowa growers learned that they were being overly aggressive with plant populations on some lighter soils. This was a new trend for them, as abundant rainfall in previous years had masked these soils’ lower water-holding capacity. Since then, growers and advisors have paid more attention to those areas.

“We took the lemons of 2012’s lower production and made lemonade. We learned from the yield data and fine-tuned our management zones to apply more realistic seeding and nutrient rates on those lighter soils,” says Ben Rahe, a Premier Crop agronomic information advisor.

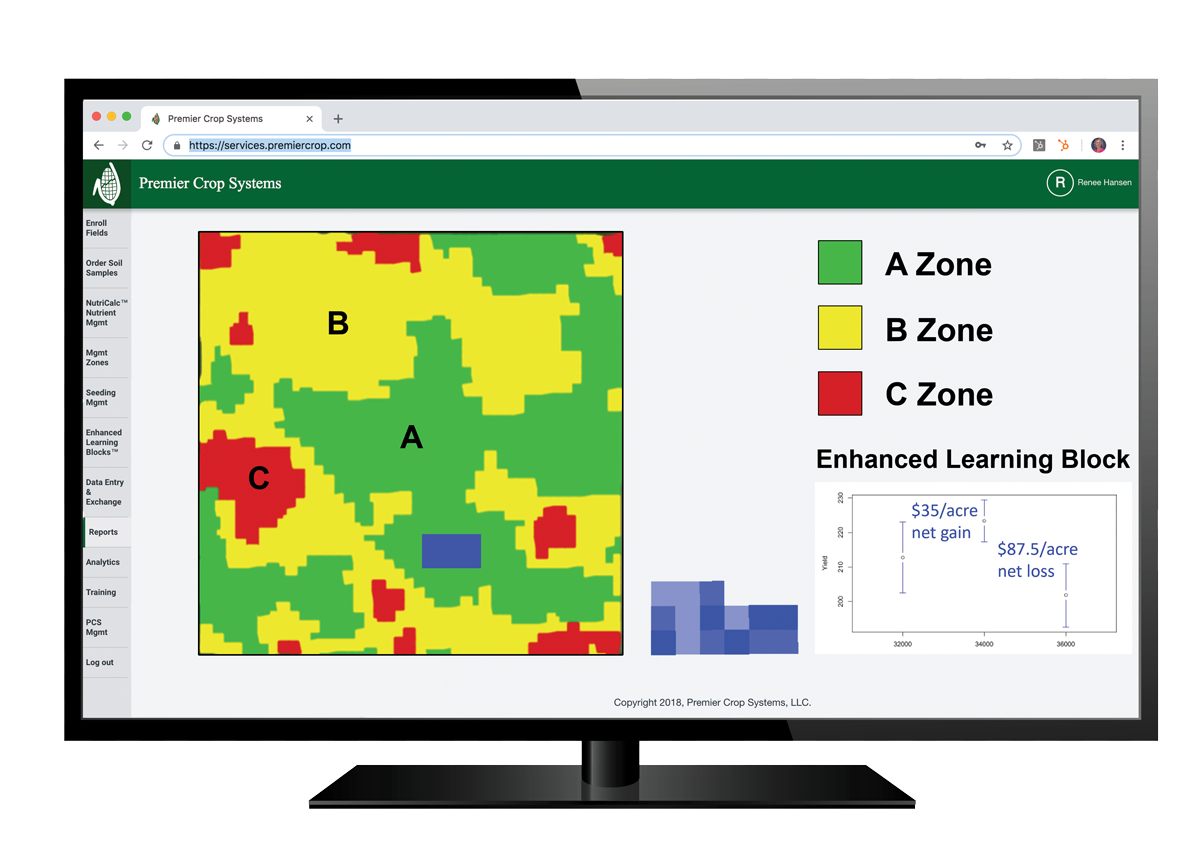
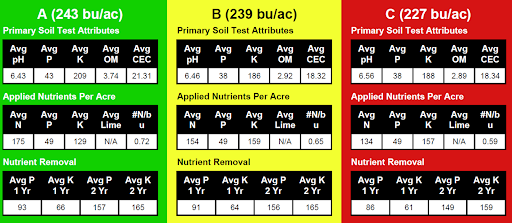
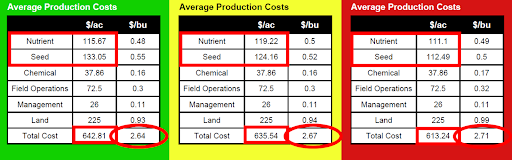
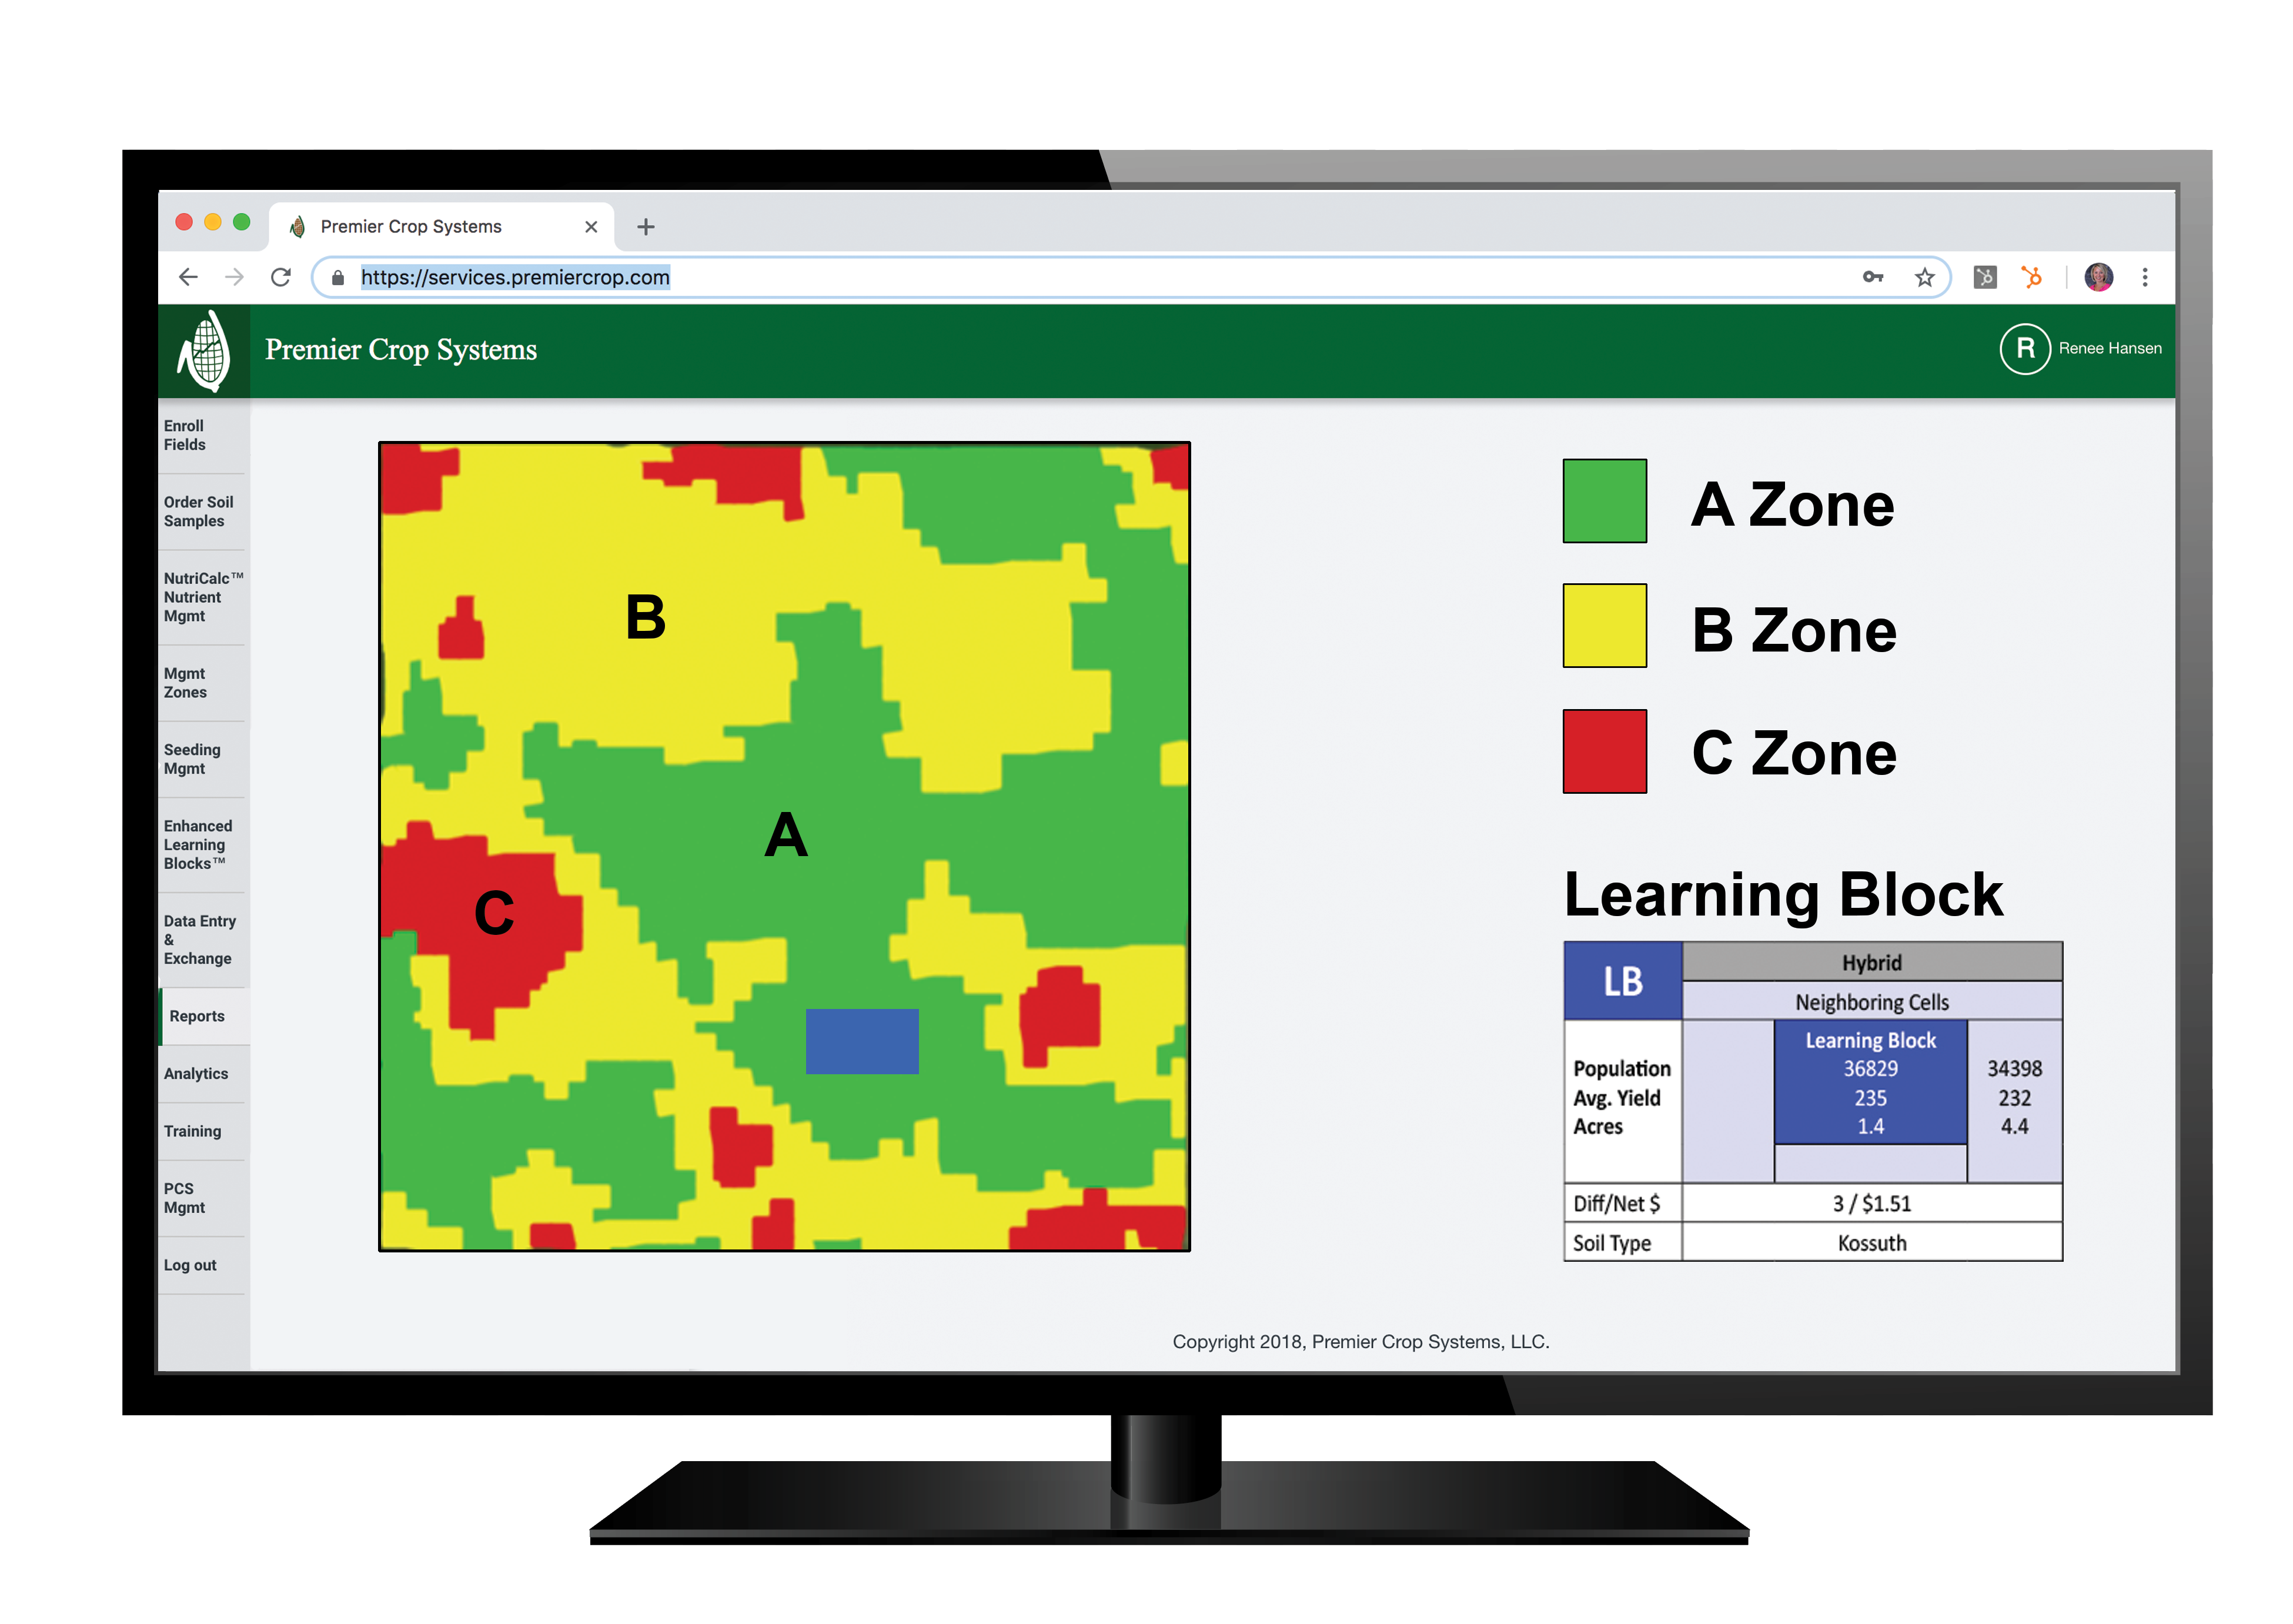
Northeast Indiana learned some valuable lessons from the 2012 drought, as well. “Even though yield information was so poor, we still had a lot to talk about with our growers about their management zones and what percentage of ground was in each A, B and C zone,” says Brian Warren, an agronomic advisor with ProTech Partners in northern Indiana.


Screen Shot 2018-09-18 at 11.38.18 AM


Warren also found that with their 60-to-80 bushel crop in 2012, weather needed to be a bigger part of the equation. “If a bumper crop is roughly 200 bushels, and a grower averaged 80 bushels in 2012, we learned that 60% to 65% of what contributes to yield is variable, and the other 40% to 35% is contributed by management.”

Warren made lemonade by amending management zones for the future.

“Every crop season, we try to identify each field’s yield-limiting factors,” says Rahe. “in a wet spring/dry summer year like 2013, that may mean using yield data to more accurately determine where to invest in additional tile drainage. We make the best of extreme weather conditions by learning how a field response to them. We then discuss with the grower what can be done to fix those yield-robbing items.”

Having a geographically broad information source can help with getting through tough years. “Due to weather, I’ll have some growers with well-above-average yields and some growers with one of their lowest-yielding crops,” Rahe says. “The positive of this yield variability is that as an advisor, I can apply what I learn to both growers. For growers with low yields, I can show them anonymous information from those who were more fortunate. What may feel to them like a ‘lost’ year of information educated them. And for those with good yields, I provide them with a watch list for extreme-weather years.”

Extreme weather conditions can uncover variability that growers and advisors have never seen, reinforcing the value of field-by-field management and accentuating the importance of site-specific decision-making. Assessing your yield data with a trusted agronomic advisor improves your odds against Mother nature’s curveballs.

GOT DATA?

1. Capitalize on a relationship with an agronomic advisor who isn’t as geographically centered as you. Prepare five questions to ask him or her about what worked for other growers who didn’t suffer from adverse conditions.

2. Study the big yield-limiting factors – like drainage or managing drought-prone soils. What decisions can be made from those lessons learned?

Originally published in Corn and Soybean Digest December 2013.

Cost Per Bushel

Premier Crop has been challenged by growers and industry skeptics. The recent euphoria over the value of grower’s data has been a welcome change in that more growers are starting to value their data and wonder how to best put it to use. But having spent so much time with growers, I know that in the end the ultimate credibility test for every data offering will be “does it pay?”

And that’s where we started as a company. Our goal wasn’t just to use growers’ data to help them drive yield, but must more importantly to drive profitability!

Our answer was to create a robust database that could not only track agronomic layers and input treatments but also the costs associated with each treatment plus land, management and cost of field operations.

When we started in 1999, there were many years when the grain market provided very few significant swings. The challenge of developing a solid grain marketing plan started with knowing your cost per bushel. We took that challenge to the extreme – providing grower with a cost per bushel map that included tracking costs down to 1/10th of acre increments.

Screen Shot 2018-08-17 at 2.00.03 PM

A simplistic approach would have been to take whole field average costs and divide them by the yield field.

Our approach is much more accurate. If a variable rate nutrient application called for more nutrients to be applied in an area of the field, the cost of those nutrients was processed with the nutrient application field. If seeding populations were higher in a management zone, the associated cost of extra seed was tied to the planting file when it was processed.

Screen Shot 2018-08-17 at 2.00.08 PM

This practice is a lot of work but the results provide analysis that can make critical decision making easier. Over the years, growers have used cost per bushel maps in many different ways. To have meaningful conversations with landlords. To change crop rotations on fields that show a profit advantage on one crop and not another. In some cases to decide if there are areas of a field that should not be cropped and might fit better with a conservation use. One farming operation used their cost per bushel data to grow in another direction where the combination of land rents and yields were more profitable.

Accurate cost per bushel information is highly confidential and can provide the ultimate benchmarking solution as it goes much deeper than just yield but compares the economics associated with those yields as well. Imagine the power of knowing your long-term average cost per bushel by dominant soil types. Maybe you’ve mastered being profitable on lighter soil types and that is one of your strategic advantages.

The knowledge you create from your data can be powerful in managing your farm and the risky involved in farming today.

Got Data?

  1. What strengths does your data show? Where does it suggest there is room for improvement?
  2. How might you use your data to manage risks in this growing season and beyond?

Color Blind Data

I grew up attending a small rural Iowa Methodist church and the theology from the pulpit was all about being “color blind”. Of course, the irony was that we all looked the same. The color blind theology was all about seeing beyond the surface – looking deeper to find real values versus making judgements based on what’s on the surface.

The agronomic and economic data from each part of all your fields can be a powerful tool that allows you to look deeper than what is on the surface. Maps are a great way to visualize data – but the combination of the data layers that each map represents will allow you to gain new and valuable knowledge that can drive more profitable data-driven decisions.

Decades ago, before Premier Crop, I asked one of our most reliable employees to prime and paint a piece of equipment. The primer coat was a red color and the priming process went well. But when it came time for the final coat of dark green, the results weren’t so good. There were obvious missed spots on every surface.

It was one of my first encounters with red-green color blindness. Red-green color blindness is the most common form of color blindness, impacts men far more than women and can affect almost 10% of those of us with European heritage.

Virtually all precision ag companies love to display data using colorful maps. Premier Crop is just as guilty as any other company of ignoring the 10% of our customers that can’t see differences in our red-to-green yield maps.

Screen Shot 2018-08-17 at 1.20.31 PM

Throughout our history, I’ve always thought color blind growers understood our message more quickly than others – that the power is in the data. They have no choice but to get beyond the pretty map phase.

The best data is the color blind! it doesn’t care about the color of the seed logo, the equipment used, the nutrient package or crop protection choice. it isn’t cleansed or stored or manipulated to tilt the results in one direction or another. Color blind data has no stake in what product or rate wins.

Maps can help tell us where, but data can tell us what, how much and why!

Did planting higher populations in the best parts of the field pay? Your data can answer that question. What color blind story does your data tell about hybrid and variety performance? Did your seed treatment result in higher yields? Does fungicide timing matter? Did that late season nitrogen pay for the extra trip? Look beyond the surface – be color blind and look deeper in your data for more value.

Why You Should Test Products on Your Own Farm

Why should you test products on your own farm? Your farm is unique and you have the equipment capabilities and data to conduct those trials. With little risk, you can have a more robust dataset than many companies.  I’ll explain…

It starts with grid soil sampling. Soil sample data is the foundation to understanding and analyzing yield in each part of each field and ultimately, if products or rate changes will provide a return on investment. If there is something wrong with the foundation, additional inputs generally won’t show a return.  From there, we gather information such as– variable rate nutrient information, as-applied planting data, chemicals, fungicides, insecticides, weather data, and more.  Because in the real world, there isn’t one variable. It’s important to know what your measuring stick is, and we’re different, because we use actual costs and yield to understand why products perform and where they perform best.

Often times, information provided for new products or management methods are gathered from trials averaged across geographies, which may not fit your location or your farm. Certainly, there is excellent research out there–high quality university research and independent plot research that has good information. But inevitably, products come to market and growers try new technologies, but they don’t work or they don’t work everywhere.  Why not?

We believe products work in specific places and we want to help growers find those specific places in their field. We hear this from growers all the time, “sure I’ll take a gallon of fungicide or insecticide because I want to see it, I want to try it.” You want to see the product, apply it and harvest it yourself to see how it does on YOUR field.

Most growers are capable and have technology to test products on their farm, but aren’t taking the final step of doing an in-depth of analysis. Premier Crop offers multiple testing methods including a patented scientific approach of randomized, replicated trials executed through a prescription and harvested with your own equipment. The exciting part?  You may have the technology to run these trials on your own fields.

test trials on my local farm

As a grower do you try new products or test new rates?  How do you measure if that product or methodology worked? Visually? With a weigh wagon?  Do you use a yield monitor and software to do a simple analysis?  I’m here to tell you—you can do more with what you already have, and we’re excited to work with you!

Remove the Guessing and Make Data Driven Decisions

As farmers face another year with challenging markets and high inputs, we as agronomic advisors continue to work with our clients in order to find where we can remove some of the guessing when it comes to the decision-making process of planning another season. It comes as no surprise to anyone that is involved in Agriculture that many areas saw higher than normal precipitation in 2018.

The map below shows the state of Iowa and the departure from normal in inches of rainfall in 2018.

2018 high percipitation

(source: https://water.weather.gov/precip/  parameters from last year versus normal rainfall.)

Unfortunately, this did lead to some areas of drown outs and low yielding areas in fields. Thus, there were many areas that had little if any removals of nutrients but many growers will treat those areas the same as areas that yielded well in the field. This is just one of many examples where VRT and precision agriculture can save the grower on inputs across their farms. It is important to look not just at soil sampling and soil types but also historical yield when deciding on proper recommendations for the field. At Premier Crop, it is important to us to treat every field individually and not look at those fields in a cookie cutter style approach. Premier Crop has an extensive database with over 20 years’ worth of observations.

It is important to look at the return on investment for not just for every field or every acre, but what it is actually taking to produce every bushel. We are able to take all of the costs that are provided and quantify the grower’s yields with those costs. Does it make sense to continue to treat historically poor yielding ground the same as historically high yielding ground? Would your inputs be better spent if focused slightly more on ground that has more yield potential? It is important to us that we treat every acre in an unbiased way, as if we are farming it ourselves, and the data allows us to do that.

The example below shows a field that has been put into three different zones of productivity based upon fertility and historical yield.

premiercropmanagementzones_productivity_blog_lk

We then break that out further and show how each zone did on a per bushel basis with all the costs entered. As you can see we dropped our rates in the least productive zone because it didn’t show the same ability to produce as the other two management zones.

premiercrop_costperbushel_blog_lk

This is a great example how Premier Crop uses data to prove profitability. It’s time to stop guessing and use your data to make profitable decisions.

Can “Unhealthy” Soils Consistently Produce Exceptional Yields?

In the early 1970s, I was fortunate to work for a farming operation that was serious about soil conservation. Serving on State Soil Conservation boards, building terraces, implementing no-till, when planters and weed control options were crude by today’s standards – they were soil stewards. Because of their mentorship, I’ve always taken soil conservation seriously.

In the 1980s, I found myself defending the use of commercial fertilizers. Those that attacked their use liked to describe them as “chemical fertilizers”. If you remember the Periodic Table of Elements in your first chemistry class – you know nutrients are chemicals. Phosphorus and potassium are minerals that mined from the earth, and nitrogen is made from the air (which is 78% nitrogen). Nitrogen fertilizer is a chemical and combining hydrogen from natural gas, with nitrogen from the air, to produce nitrogen fertilizer, was a significant scientific achievement. We have to be judicious in how we apply Nitrogen from all sources, but since it takes energy to create nitrogen fertilizer, it warrants additional attention.

What I understood then as I do now, is that we need integrated approaches to crop management to be both economically and environmentally sustainable. How we manage weeds, insects, nutrients – including organic nutrients, tillage, residue and crop rotations have serious consequences both for the environment and growers’ balance sheets.

One of the thoughts that’s been rumbling around in my head relates to soil health. In some circles, soil health tends to end up in a discussion about farming practices – almost a checklist of do’s and don’ts. Other approaches try to quantify soil health with a test. I tend to like the test concept because it starts to allow us to make comparisons from field to field, within fields, benchmark over time and eventually be able to quantify changes.

Our company, Premier Crop, is all about managing variability within fields and between fields to maximize a grower’s return on investment. We use yield files from calibrated yield monitors to measure our success both agronomically and economically. One of our tools empowers the user to build a multiple year yield map. I find that there are parts of fields that are amazing in their ability to consistently kick out exceptional yields. I understand that there are examples of “throw the kitchen sink” at production and have everything work perfect in a given year.

I’m not talking about a one-hit wonder. I’m talking about areas of fields that are exceptional yielding on consistent basis. Are those areas of the field “healthier” than other areas? Is it possible for them to be unhealthy and be so consistently high yielding?

multi year yield map

What do these high yield areas have in common?

  • Drainage is right – either blessed with naturally well drained or a combination of cultural practice and field tile.
  • They frequently have deeper A horizons (depth of top soil before clay or sub soil) and usually a higher % organic matter.
  • Usually pH is right – not too high but also not low. That makes sense to me, correct soil pH makes other nutrients, like phosphorous, more available and is needed for the bacteria that increase mineralization to be active.

I believe that nutrient cycling is better in these areas – that is soil supplied and fertilizer/manure supplied nutrients cycle to plant useable forms better than in other parts of the field. There is a strong relationship in parts of fields between consistently high yields and soil health. I believe you can have healthy soils that aren’t exceptionally high yielding (can be limited by other management choices). But I don’t believe you can get consistently high yields on unhealthy soils. If you’re trying to understand differences in soil health within your fields, I’d be inclined to start with a multi-year map.

THREE Ways to Determine Field Profitability Using Your Technology {Pt. 1}

This is a three part series focusing on ways to determine your field profitability using your technology. We will post the series over the course of two months. If you don’t want to wait, you can get the full series here.

__________________________________

In tough economic times, it is more imperative than ever to know your productivity and be able to evaluate the cost or benefit of your decisions. Our mission at Premier Crop is to make this easy for you and give you multiple ways to evaluate across your operation. I will walk you through the different methods of evaluation: cost/bu, variance reports, and learning blocks, along with why each is important.

The first measurement is the cost per bushel on a spatial level to give you a new look at each individual area of your field.

COST PER BUSHEL

Q: What is the end goal of your operation? To raise more bushels to sell at a profit.

Q: How can you do this if you are basing everything off of cost/ac? Cost/bu should be your end goal. How much did your fertilizer cost you per bushel? How much did your land cost you per bushel? This diagram shows a realistic view of your operation.


determine your cost per bushel

We look deeper than your Average Production Costs to find the impact on your cost per bushel by field. And we go even deeper than only looking at your field, we break down each field into management zones and determine the cost/bu in each unique zone. (see diagram below)

Manage your cost per acre in management zones to determine field profitability


Not every area of your field performs the same and using cost/ac as your main metric of measurement can have detrimental effects on your overall productivity. Let me explain.

Your A zone is the most productive area of your field, it consistently performs well. Your C zone, by contrast, is the area of your field that constantly disappoints you. It never seems to do well and brings your overall field average down. Why would you treat them the same? You may be able to cut your cost/ac in the C zone by giving it less fertilizer and seed, allowing crops more room to spread out and grow, but if you do that in your A zone, you would see a decrease in productivity. Your A zone wants to be pushed, it needs more nutrients and can handle more seed population than the C zone.

This is a detailed look of each field, but sometimes you may want a more broad view of your overall operation to make management decisions. This is when step number two is valuable, by viewing your Field Productivity Report Card.

Stay tuned for our next post featuring the Field Productivity Report Card.

THREE Ways to Determine Field Profitability Using Your Technology {Pt. 2}

This is a three part series focusing on ways to determine your field profitability using your technology. We will post the series over the course of two months. If you don’t want to wait, you can get the full series here.

__________________________________

In tough economic times, it is more imperative than ever to know your productivity and be able to evaluate the cost or benefit of your decisions. Our mission at Premier Crop is to make this easy for you and give you multiple ways to evaluate across your operation. I will walk you through the different methods of evaluation: cost/bu, variance reports, and learning blocks, along with why each is important.

The first measurement is the cost per bushel on a spatial level to give you a new look at each individual area of your field.

FIELD PRODUCTIVITY REPORT CARD

After determining your cost per bushel, it is valuable to look at all your fields and rank them, like a report card. This process allows you to view which field deserves the gold star and which field needs more attention. This is a process that is automatically generated for you when you are enrolled in our program.

One part of the report shows a cost/bu field average over all of the crop acres for a given year and over multiple years. It allows you to look at trends in regards to cost/bu over time. This report will show you if one field is consistently producing a lot more or less yield or costing a lot more per bushel.

In the report below we can see that Bob Smith’s BS3 Home field corn averages $6.11/bu(1) across all the years of data, which is higher than his other fields in comparison. In 2018 it cost him $3.38(2) to grow a bushel. This report will show where the cost/bu had a significantly higher average (2012 $15.07/bu(4) corn) but since 2014 this farmer has been doing a good job of maintaining his cost/bu average on the BS3 field. However, we can see that across all acres of our fields the average cost of corn in 2018 was $2.94/ac(5). Therefore this field raises a flag for us to look deeper into the field data.

In contrast, the BS4 Home field averaged $2.59/bu(6) in 2018 which is below our average corn costs of $2.94/bu(5). This field has a consistently lower cost/bu year over year than other fields.

premiercrop_costperbushelaverage

What does this mean? The purpose of the report is to get us to ask ‘why?’

BS3 could be averaging a higher cost/bu because our management zones are not correct, we may be trying to push the field too hard, our plant population is off, or the nutrient prescription is flat-rated. Or we may be paying higher rent on that field and need to consider if it is economically responsible to keep renting at the current rate.

Again, this report is a big-picture overview across a whole operation, it’s main strength is to get us to ask why. Why is BS4 performing so much better than BS3? What can we change to get our cost/bu more in line across all of our fields? Lower seed costs? Split apply nitrogen? Apply fungicide?

Premier Crop can help answer these questions, our trained agronomic advisors can identify yield-limiting factors by doing an in-depth analysis of your individual field. We are able to recommend a management change that will affect your bottom line across a whole field. That is our ultimate goal, to make you profitable.

Is there a way be profitable without implementing wide-scale changes across your whole operation? The answer is yes, with step three, Learning Blocks…stay tuned!

THREE Ways to Determine Field Profitability Using Your Technology {Pt. 3}

This is a three part series focusing on ways to determine your field profitability using your technology. We will post the series over the course of two months. If you don’t want to wait, you can get the full series here.

__________________________________

In tough economic times, it is more imperative than ever to know your productivity and be able to evaluate the cost or benefit of your decisions. Our mission at Premier Crop is to make this easy for you and give you multiple ways to evaluate across your operation. I will walk you through the different methods of evaluation: cost/bu, variance reports, and learning blocks, along with why each is important.

The first measurement is the cost per bushel on a spatial level to give you a new look at each individual area of your field.

LEARNING BLOCKS

What is a Learning Block? Premier Crop has created a low-risk way to test and check variable rate seed populations, crop protection products and nutrient rates in one-to-three test acres, called Learning Blocks™. You have the ability to check if the optimal rate for that environment is higher or lower, in a low-risk way, built right into your prescription, using your technology.

After you have established management zones for your field, Learning Blocks prove whether a practice such as plant population or different nitrogen rates, are effective in that zone. Since Learning Blocks are one-to-three acre cells it’s a low risk way to prove and maximize efficiency.

premiercrop_learningblock_blog_THREEways

In the diagram above, this Learning Block was performed to test plant population. Did it pay? Yes and no. The Hybrid A did not have enough yield increase to offset increased seed costs. Hybrid B did have a yield increase to produce a positive ROI.

A great benefit to Learning Blocks is that you can place multiple Blocks in one field to test different management zones, soils, nutrients and more. This can ultimately help you make confident data decisions that will help you profit, all while using the technology you already have.

premiercroplearningblock

Get started, contact us to calculate your profitability and schedule a demo today.