Learning Blocks

Some people remember phone numbers or slender dates; I remember farm fields. Before the 2005 crop year, the program leaders for Central Advantage from Central Valley Cooperative in southern Minnesota asked me to help generate variable-rate planting prescriptions. The primary question was “agronomically, what makes sense?”

Field by field, I looked at the data collected for historic yields, soils, fertility levels, cation-exchange capacities, etc., and generated variable-rate prescriptions for each field. But I didn’t stop there. I wanted to prove that what I thought made sense agronomically would truly work.

To do so, I put 1- to 2-acre check blocks within each area/population rate of the field. That fall, I carved out the yield for each acre check block and compared it to its surrounding area. I still remember those fields and the stories the check blocks told as we learned and proved concepts.

Since those days, we [Premier Crop] have trademarked the name Learning Blocks™ and have automated the process for analyzing yields inside Learning Blocks compared to the surrounding area via planting, fertilizer and other inputs. In my entire career I have never “sold” anything as popular as Learning Blocks! Growers love them for many reasons. Most notably, they make sense – comparing 2 treated acres to 4 non-treated acres within a management zone is a great apples-to-apples comparison. And, the technology does all the work – the grower does not need to slow down planting or harvesting to learn from the data.

learningblock

Growers enjoy not being told “trust us, this recommendation works”; but rather are given the ability to check and validate the recommendation. In the case of planting, growers can see Learning Blocks by downloading them into their smartphone and physically walking to a Learning Block, verifying the population change. Learning Blocks area low-risk strategy for implementing changes. For example, planting 39,000 plants per acre or increasing nutrient rates across an entire management zone might be a stretch, but every grower would risk a 2-acre Learning Block to test the limits.

Premier Crop has done plenty of strip trials in the past – running different across the entire length of a field. For variable population, the strip trial approach means running high populations across all management zones. Everything we gained from increasing populations in an A zone, we lost when the strip ran across a C zone.

When premier Crop talks about using data to make decisions, Learning Blocks are a vital part of that decision-making strategy. They give growers the knowledge necessary to refine further the prescriptions in their fields, with confidence and data to back them up.

THREE Ways to Determine Field Profitability Using Your Technology {Pt. 1}

This is a three part series focusing on ways to determine your field profitability using your technology. We will post the series over the course of two months. If you don’t want to wait, you can get the full series here.

__________________________________

In tough economic times, it is more imperative than ever to know your productivity and be able to evaluate the cost or benefit of your decisions. Our mission at Premier Crop is to make this easy for you and give you multiple ways to evaluate across your operation. I will walk you through the different methods of evaluation: cost/bu, variance reports, and learning blocks, along with why each is important.

The first measurement is the cost per bushel on a spatial level to give you a new look at each individual area of your field.

COST PER BUSHEL

Q: What is the end goal of your operation? To raise more bushels to sell at a profit.

Q: How can you do this if you are basing everything off of cost/ac? Cost/bu should be your end goal. How much did your fertilizer cost you per bushel? How much did your land cost you per bushel? This diagram shows a realistic view of your operation.


determine your cost per bushel

We look deeper than your Average Production Costs to find the impact on your cost per bushel by field. And we go even deeper than only looking at your field, we break down each field into management zones and determine the cost/bu in each unique zone. (see diagram below)

Manage your cost per acre in management zones to determine field profitability


Not every area of your field performs the same and using cost/ac as your main metric of measurement can have detrimental effects on your overall productivity. Let me explain.

Your A zone is the most productive area of your field, it consistently performs well. Your C zone, by contrast, is the area of your field that constantly disappoints you. It never seems to do well and brings your overall field average down. Why would you treat them the same? You may be able to cut your cost/ac in the C zone by giving it less fertilizer and seed, allowing crops more room to spread out and grow, but if you do that in your A zone, you would see a decrease in productivity. Your A zone wants to be pushed, it needs more nutrients and can handle more seed population than the C zone.

This is a detailed look of each field, but sometimes you may want a more broad view of your overall operation to make management decisions. This is when step number two is valuable, by viewing your Field Productivity Report Card.

Stay tuned for our next post featuring the Field Productivity Report Card.

THREE Ways to Determine Field Profitability Using Your Technology {Pt. 2}

This is a three part series focusing on ways to determine your field profitability using your technology. We will post the series over the course of two months. If you don’t want to wait, you can get the full series here.

__________________________________

In tough economic times, it is more imperative than ever to know your productivity and be able to evaluate the cost or benefit of your decisions. Our mission at Premier Crop is to make this easy for you and give you multiple ways to evaluate across your operation. I will walk you through the different methods of evaluation: cost/bu, variance reports, and learning blocks, along with why each is important.

The first measurement is the cost per bushel on a spatial level to give you a new look at each individual area of your field.

FIELD PRODUCTIVITY REPORT CARD

After determining your cost per bushel, it is valuable to look at all your fields and rank them, like a report card. This process allows you to view which field deserves the gold star and which field needs more attention. This is a process that is automatically generated for you when you are enrolled in our program.

One part of the report shows a cost/bu field average over all of the crop acres for a given year and over multiple years. It allows you to look at trends in regards to cost/bu over time. This report will show you if one field is consistently producing a lot more or less yield or costing a lot more per bushel.

In the report below we can see that Bob Smith’s BS3 Home field corn averages $6.11/bu(1) across all the years of data, which is higher than his other fields in comparison. In 2018 it cost him $3.38(2) to grow a bushel. This report will show where the cost/bu had a significantly higher average (2012 $15.07/bu(4) corn) but since 2014 this farmer has been doing a good job of maintaining his cost/bu average on the BS3 field. However, we can see that across all acres of our fields the average cost of corn in 2018 was $2.94/ac(5). Therefore this field raises a flag for us to look deeper into the field data.

In contrast, the BS4 Home field averaged $2.59/bu(6) in 2018 which is below our average corn costs of $2.94/bu(5). This field has a consistently lower cost/bu year over year than other fields.

premiercrop_costperbushelaverage

What does this mean? The purpose of the report is to get us to ask ‘why?’

BS3 could be averaging a higher cost/bu because our management zones are not correct, we may be trying to push the field too hard, our plant population is off, or the nutrient prescription is flat-rated. Or we may be paying higher rent on that field and need to consider if it is economically responsible to keep renting at the current rate.

Again, this report is a big-picture overview across a whole operation, it’s main strength is to get us to ask why. Why is BS4 performing so much better than BS3? What can we change to get our cost/bu more in line across all of our fields? Lower seed costs? Split apply nitrogen? Apply fungicide?

Premier Crop can help answer these questions, our trained agronomic advisors can identify yield-limiting factors by doing an in-depth analysis of your individual field. We are able to recommend a management change that will affect your bottom line across a whole field. That is our ultimate goal, to make you profitable.

Is there a way be profitable without implementing wide-scale changes across your whole operation? The answer is yes, with step three, Learning Blocks…stay tuned!

THREE Ways to Determine Field Profitability Using Your Technology {Pt. 3}

This is a three part series focusing on ways to determine your field profitability using your technology. We will post the series over the course of two months. If you don’t want to wait, you can get the full series here.

__________________________________

In tough economic times, it is more imperative than ever to know your productivity and be able to evaluate the cost or benefit of your decisions. Our mission at Premier Crop is to make this easy for you and give you multiple ways to evaluate across your operation. I will walk you through the different methods of evaluation: cost/bu, variance reports, and learning blocks, along with why each is important.

The first measurement is the cost per bushel on a spatial level to give you a new look at each individual area of your field.

LEARNING BLOCKS

What is a Learning Block? Premier Crop has created a low-risk way to test and check variable rate seed populations, crop protection products and nutrient rates in one-to-three test acres, called Learning Blocks™. You have the ability to check if the optimal rate for that environment is higher or lower, in a low-risk way, built right into your prescription, using your technology.

After you have established management zones for your field, Learning Blocks prove whether a practice such as plant population or different nitrogen rates, are effective in that zone. Since Learning Blocks are one-to-three acre cells it’s a low risk way to prove and maximize efficiency.

premiercrop_learningblock_blog_THREEways

In the diagram above, this Learning Block was performed to test plant population. Did it pay? Yes and no. The Hybrid A did not have enough yield increase to offset increased seed costs. Hybrid B did have a yield increase to produce a positive ROI.

A great benefit to Learning Blocks is that you can place multiple Blocks in one field to test different management zones, soils, nutrients and more. This can ultimately help you make confident data decisions that will help you profit, all while using the technology you already have.

premiercroplearningblock

Get started, contact us to calculate your profitability and schedule a demo today.

Are you applying the right rates?

In 2005, Premier Crop trademarked a unique idea that has become a common practice with our customers. A trademark called Learning Blocks™. If you’ve conceded to the idea that your fields aren’t the same from fence line to fence line and you’re already managing your fields in zones, you’re ahead of the pack. But, are you checking your work? How do you confirm you are choosing the right rates for the zones in your variable rate planting or nutrient prescription?  Do you just trust that the prescription is right?

The concept of Learning Blocks was a way to test if the correct rates were chosen each zone, in a low-risk way. By placing small check blocks into an area that historically yields in a consistent manner, you can reliably check higher and lower rates against the rate you think is right.

premiercrop_learningblock_rightrates

For example, in a 30 acre area that has been your top yielding zone most years, you may choose to push corn populations to 37,000 seeds.  But, with nothing to compare against, how can you know that was right?  We’d recommend a high check at 40,000 seeds and a low check at 34,000 seeds within that same zone, only on 1-3 acres each.  Using the yield data and a few pieces of cost information, you can quickly understand the return on investment for those seeding decisions and the resulting yield impact they each had.

Now next year, you’ll have refined that planting population just a little more—and can do it again to keep checking your work.  At Premier Crop, we’re all about continually improving profitability, trusting the data to be our guide.

Learn more about Premier Crop’s trials here.

Best Average Rate Costs Profits

Long before GPS was part of our acronym vocabulary, my early agriculture career started in eastern Iowa and northern Illinois. On one of those scorching hot July days, as you were driving through the area, every so often the road would be higher than the fields and you could visually capture a birds-eye view of the fields below. You could see parts of the fields, where the corn was rolled up tight as the plants went in to “protection” mode – while other parts of the field look perfectly normal. Images like that help make me an advocate that managing parts of the fields differently would make agronomic and economic sense.

Now those “pictures” can be captured in detail with a drone, a plane, or a satellite and further documented with your yield file. Since 80% of the US corn and soybean crop is rain-fed, we can’t solve the problem of running low on moisture in those drought-prone parts of fields. But we can manage those areas by changing the seeding rate – spreading the plants out a few inches can provide more room for the root mass needed to maximize yield and economic returns per acre.

Premier Crop’s new Enhanced Learning Blocks allow users to use the equipment they have already invested in to do randomized and replicated trials. In this dryland Kansas field in 2016, two trials with 3 different planting rates and 5 replications each were conducted. In best area of the field, yields climbed as population climbed. We don’t know how high we should have gone but know that in the A zone (green), 24,000 returned $24 per acre more vs 21,000, including the additional seed investment.

But the results in the B zone (yellow) were much different.

The B zone trial mirrors results from many other 2016 trials – that pushing population too high can not only lead to lower yields but because of higher seed investment, can be very costly.

continuous learning with seeding population with on farm trials

Consider what these results suggest about farming by the best average rate. If the grower plants 20,000 – the best rate for the B zone on the entire field – the grower loses at least $25 per acre on the best half of the field. Obviously, planting 24,000 on the entire field would be even worse economically. Picking 22,000 as the best “average” rate – mid way between 20,000 and 24,000 – would results in losing $18/acre on the A zone and $25/acre on the B zone.

If you think this might be worse case, consider that as you move east in the Corn Belt, both seeding rates and yields are higher. The higher the investment (higher seed costs) and the more return (higher yields) equates to even larger benefits to getting the rate correct. The story with nutrients in the same; the ideal rate changes within the field and economic reward or penalty is dramatic. Remember the example of having one foot in ice water and the other in hot water and the suggestion of being just right on average?

Farming by averages is costing you profits! We can do better than choosing the best average rate.

Does Variable Rate Anything Pay?

Difficult economic times tend to bring out skepticism or at least a review of current practices. Recently I was asked “Do variable rate applications of any crop input really pay?” To some it might be surprising that 20 plus years after variable rate technology was first brought to the market, there are still so many that haven’t “bought in” to the concept.

It doesn’t surprise me though. As we grow into new markets, it’s very common to find virtually no one is doing any variable rate applications – not lime, not phosphorus or potassium, not nitrogen, not seeding or crop protection products. Reality is, across the country there are by far more flat rate applications of crop inputs than variable rate applications. It’s not really hat hard to figure out why this is the case. Flat rate applications are easy – no files to move, no prescriptions to create and a shorter discussion for an input supplier to get the order.

In some parts of the country, growers that used to variable rate crop input no longer do. When you ask these growers why they quit – frequently the answer is “I didn’t know if it paid.”

does variable rate pay use learning blocks to find out

But all that has changed. Using your yield file, you can now quantify results and answer the did-it-pay question. Since 2005, we’ve been checking our work with our trademark Learning Blocks and we have proved, and continue to prove every year, that variable rate applications frequently pay. It’s not 100% but given the complexity of our modern crop production the results from millions of acres are amazing. In this example, the grower used Learning Blocks as a low-risk way to test whether the nitrogen prescription was correct.

Our experience has been that growers love the Learning Block concept. They love the idea of advisors who are willing to check their work. Still today, that is uncommon. With regard to most variable rate prescriptions sold today there is no validation of the results. Rather, growers are sold a prescription for a crop input and told that a model or algorithm is so sophisticated that it just works. But without a check area of higher or lower treatment to compare to the prescription rate, there isn’t any way to know if it worked.

Protecting Crop Profits with Precision Ag

“In tough years, it’s even more important to manage your inputs and to maximize profit. Way too often, I hear people want to maximize yield and, obviously, the more bushels you have, the more you have to sell. But if it costs you too much to raise, you might not have increased your profitability by increasing yield.” – Eric Marchand, Britt, IA

Eric Marchand protecting crop profits with precision ag

In a recent podcast episode our guest speaker Rodney Legleiter, from our Partner SciMax Solutions®,  interviewed grower Eric Marchand from Britt, IA. 

RODNEY LEGLEITER: How does farm analytics help your farm become more cost efficient?

ERIC MARCHAND: Well, when you can take your farm and break it down, you can see where the profit robbing issues are. You can try to correct them or combat them with different hybrids, different nitrogen rates, different fertilizer responses and variable rate planting in certain areas. SciMax compiles the data from other growers in the area, then helps find different practices that are working versus what isn’t working so you can not only see your farm operation but see what others are doing anonymously. This way you can manage each acre slightly different to maximize your profitability on each acre.

RODNEY LEGLEITER: How do you manage input costs to protect profits?

ERIC MARCHAND: It’s about having the right population of the right hybrid on each acre in each area of the field, as well as optimizing your nitrogen rate, your micronutrients, and even your P and K rates. Going clear back to the basic as-planted map and overlaying that with your yield mapping, you can determine your profitability by field, acre and hybrid.

RODNEY LEGLEITER: Talking about variable rate, you’ve been variable rate seeding for quite a few years. Tell us the timeline and history of how you’ve been using variable rate prescriptions and seeding.

ERIC MARCHAND: In 2013 I purchased hydraulic drives on my planter and knew I could variable rate. Since I had the technology available to me, I tried a little bit of corn in a field or two each year. I broadened that into trying a field of beans based on pH and adding four more corn acres. It went to having a prescription written for every acre of corn and beans that I plan to plant each year. I believe variable rate really pays off in optimizing your population. I wouldn’t say you’re cutting back in the less productive acres. You are cutting back your population, but you’re optimizing your population more than just cutting it back to save seed. Cutting back saves the seed cost, but it also allows the best population on that acre to produce the best yield. Saving input cost, as well as increased yield for return, is a double-ended benefit.

RODNEY LEGLEITER: There’s a misconception that you’re going to cut your seeding costs drastically, but that’s really not the case when you’ve pretty much got the same average rate across the field.

ERIC MARCHAND: You’re right. If you decide the ballpark of what you would flat rate that field by seed, once your prescriptions are written, most of the time you’re within one bag. So you’re not cutting back seed. You’re taking it out of the less productive areas and putting it in the higher producing areas. You’re trying to be a little more offensive in the good ground and a little bit more conservative to optimize the situation in the less productive ground.

RODNEY LEGLEITER: Throughout the years you’ve tried the SciMax Nitrogen program with variable rate nitrogen and you’ve been able to reduce your rates by anywhere from 25 to 30 percent over those acres and still maintain, if not, increase yield. What are the different things you’ve tried with the SciMax Nitrogen program?

ERIC MARCHAND: Yes, definitely. With the variable rate single application or dual applications, you can cut your rates back. I used Learning Blocks® to test different rates to see if there was a yield drag where the nitrogen rates were cut. To start, I used learning blocks as a convincing agent, especially with variable rate nitrogen. For too long, guys have thought if I pump more nitrogen out there, I’ll get more yield. And then, you see some of the data that SciMax has shown with reducing nitrogen rates, and it really challenges the comfort zone of the ‘old-time-thinking’ and wanting to dump more nitrogen. We wanted to see for ourselves, so we put a learning block out that used my old nitrogen rate and a higher rate. When we got our yield maps and lay over the nitrogen rate learning block we saw little to no change, even sometimes a negative response on the higher rate. It builds confidence to make the decision for the right rates next year. And it’s not only nitrogen, you can start analyzing nitrogen rates to planting population to micronutrients and fungicides. Instead of doing strips where your ground might vary across a field, do a section where you see if what you’re doing really matters. You can start to ask the questions, ‘What if I went and did that? Would I have had the same results anyway? Did I just get a banner year and get a good yield out there? Or did I do the right thing by pushing the population or by cutting the population back?’ The Learning Block tells you changing this did work or, in some instances, maybe changing this didn’t work. But it’s not a test plot from a hundred miles away. It’s your learning block right there in your own field.

RODNEY LEGLEITER: The farm economy is being impacted, more so in some areas than others. Tell me a little bit about your thought of the farm economy and what you’re seeing, how it’s affecting you and what keeps you up at night, as far as the current farming economy?

ERIC MARCHAND: In tough economic years, it’s even more important to manage your inputs and to maximize profit. Way too often, I hear people want to maximize yield and, obviously, the more bushels you have, the more you have to sell. But if they cost you too much to raise, you might not have increased your profitability by increasing yield. I’m proud to say I have a good partner in SciMax by managing input costs and maximizing profitability.

Three Steps to Combine Farm Agronomics and Economics

We often use the phrase, “Everything agronomic is economic.” What does that really mean?

First, let’s first define agronomics and economics. What is agronomics? That’s everything that we do in the field related to making good management decisions. It’s deciding how much fertilizer to apply and where to put it, planting rates, crop protection, tillage systems and how to incorporate all of this into the farm. Those all go into how we grow our crop. On the economics side, we’re talking about all of the money involved in farming. Farming is a business, and just like any other business, you need to make sure you have cash flow so you have the opportunity to farm again next year, and the year after that. So, how do we focus on agronomics and economics? We do that by analyzing growers’ data. We use that knowledge to help them make decisions on their farm.

Knowing what you’ve done on the farm in the last five, 10, or 20 years can provide valuable knowledge as you plan into the future. However, if you never take that data and don’t use it to make decisions, it’s not doing you any good. It’s important to invest time into collecting your farm data. We work with growers to analyze their collected field data. We add costs to the layers of data including product cost, operations cost, management cost if they have any land-specific cost, and tie that to the yield file so we can see what is making agronomic and economic sense on the farm.

It’s fairly easy to tell where there are higher yields, but it’s a lot harder to know if that yield increase also caused an increase in the pocket book. Did the decision pay for itself? Did you produce enough bushels to offset the cost of production? Every pass across the field matters agronomically, but it also has a cost associated with it. We give you three steps to help combine your farm agronomics and economics below.

1. PLANTING

When you’re preparing to plant, your seed has the highest yield potential it’s ever going to have. Everything we do at Premier Crop is aligned with protecting yield potential, and planting population is a big aspect of this. If you overcrowd the plants, you’re going to make them compete for resources, which will end up reducing your yields. On the flip side, if you have too low of a population, then you’re reducing your yield potential by not having enough in the first place. You can’t produce more bushels of corn if you never plant the seed to begin with.

Combining agronomics and economics is about finding the right rate for the right part of the field, which we accomplish with management zones. A management zone is not just a seeding rate like it is with many other precision ag companies. We manage the field and the operation off of the zones. We break fields into high-producing areas, which are A zones, average-producing areas, which are B zones, and lower-producing areas, which are C zones. The B zones are the types of areas that do pretty well year in and year out, but they don’t have the capability to be the highest producing areas of the field. Our C zones could look like a wet spot, an area shaded by trees, or a family of deer could live nearby and eat it all the time. We manage nearly everything based on these zones.

premiercroppbreakevencostperbushel

In the A zones, our high-producing areas, we push planting populations. We plant more seeds in these areas because these parts of the fields have the capability to produce more bushels. In the C zones, we’re going to pull back our population because we know those spots just simply don’t have the yield potential. By labeling it as a C zone and understanding that it is not going to produce as well, we can manage risk by lowering the planting population. This practice will save money on seed costs in this part of the field because by lowering the population, we have reduced seed cost, which helps the bottom line. However, if we can get part of the field from a C zone to a B zone, or from a B zone to an A zone with fertilizer or any management practice, we will go after that to increase our return to land and management, what we call yield efficiency.

2. FERTILIZER

When variable-rate technologies first came out, the discussion was: “It’s going to save you money and reduce your fertilizer usage.” We found that’s not always the case, though. Instead, grower’s are making better decisions with their planting or fertilizer dollars. They are putting those dollars in the areas of the field where it’s needed and where they can get a return on their investment. We are driving farming towards thinking more on the economic side of the business.

In general with farming, if you’re doing a straight rate across the field, you’re essentially treating every acre the same. We know that every acre is not the same because when you’re harvesting, even if you don’t use a yield monitor, you can see variation in the amount of loads you’re taking off. You can tell how good or bad the corn is as you’re driving across the field. So, why would you treat your inputs the same if you’re not taking the same amount off of it at the end of the day? That’s why it’s so important to tie the economics to planting, and fertilizer. That is where the real benefit lies.

Even if you are locked in on your planting populations, placing different checks in a field through different years allows you to gather historical data and be able to check and say: “In this year, if we’re looking at a cold, wet spring, this is the best population to go with.” Even if we don’t use that specific data in the next year, we are still collecting it for future years.

It is also important to factor in your planting population when you’re determining your nitrogen rates. We often use the example: If you invite more plants to dinner, you have to have enough food to feed them. We could apply a straight rate, but we’re going to be overfeeding the poor-production areas and underfeeding the high-production areas. So, if you have a higher population in the A zones, you need to account for the added food they’re going to need. We can also push the nitrogen rates a little higher in the A zones because we have the capability to produce more bushels, not just because of the higher population but just because the ground is better. By pushing that, you’re taking a little bit more risk, but it’s a smart risk.

3. ANALYTICS

To get started looking at a grower’s analytics, we first pull yield monitor data. Then we look at everything the grower has done throughout the year, whether it’s fertilizer, lime, planting, nutrients, or crop protection products. We dig in and see what the economic benefit was. When planting, did we build small test plots into the planting maps for our growers called Learning Blocks. We then use the information from our all of our data within a management zone to see if we have the right rate. Learning Blocks not only show us what produces the highest yield, but it also shows which population provides the greatest return on investment. Once the prescription is in a grower’s monitor, they can just focus on farming. It’s very little thinking on a grower’s part because we’re constantly constantly checking our work.  It is important that we prove what we’re doing is the best option possible.

premiercropgrowerseedingtrials

The analytics is where the magic happens. Not many companies look at what happened after harvest. Premier Crop uses our platform to make informed decisions based on what the growers data is proving through on-farm trials, Learning Blocks and Enhanced Learning Blocks to provide statical confidence to help the grower see their profit.


Not every operation has the same goals and not everyone sets out to produce the max amount of bushels. It’s a “do it and check” process. We go out and do something, we check our work, and then we make corrections for the next year. As a grower, you’re always busy. You are going from one thing to the next, and there’s always something to do. Going through the data can be a tedious task that leaves you feeling like your time would’ve been better spent elsewhere. The benefit of working with a Premier Crop Advisor is that we retrieve the data, clean it up, and enter it into the system. A grower just needs to hit “record” when they’re running through the field.

Want to learn how you can work with an Agronomic Advisor to start making agronomic decisions based on your economics? Contact us to schedule a demo today.

Learn more about the farm profitability.

Nitrogen Strategies for your Fields

“It convinces growers to spread those nitrogen pounds out over the course of the season or minimally making more than one application, and they see improved efficiency. We’re talking about less pounds of nitrogen to produce a bushel of corn, and we generally see higher yields at the same time. So, it becomes a win-win.” – Mike Manning

RENEE HANSEN: Hey, Mike, welcome to the Premier Podcast. Today, we’re going to talk about helping a grower have a nitrogen strategy. So, first, I know you’ve been on the podcast before, but can you just quickly introduce yourself and tell us what you do at Premier Crop?

MIKE MANNING: Hi, Renee. Good to catch up again. Mike Manning, Premier Crop Systems. I’m our Nebraska Account Manager and Agronomic Information Advisor. I support some of our retail partners in a few different areas and work directly with a good set of growers across the state of Nebraska.

RENEE HANSEN: Thanks for that intro, Mike. Also, I know there are a lot of people who follow you out on the Twitter world, and you’re known as who on Twitter?

MIKE MANNING: DataManning. You can find me on Twitter @DataManning.

RENEE HANSEN: Perfect. Great. Well, thanks for that introduction. So, let’s go into this nitrogen strategy and why we believe that a grower and why you believe and work with growers who should have a nitrogen strategy. Let’s just take it from the first step of planning and having a plan and a strategy when it comes to nitrogen.

MIKE MANNING: Well, you hit it right on the head. First, we have to have a plan about how we’re going to go about applying our nitrogen or what our season-long plan is for nitrogen management. The simple answer is there is no one-size-fits-all solution, especially when it comes to nitrogen management. It needs to fit into your rotation. It needs to fit into your logistics, your available labor, how you’re going to manage different cultural practices and other tools that you have at your disposal, whether that’s equipment limitations, irritation or rainfall limitations, yield potential. All these dynamics play together. One I’ve left out there would be topography and soil types. Also very important. A lot of nitrogen plans probably have fallen under that cultural practice of what a specific area has been accustomed to doing. Some examples of that might be 100% of total expected nitrogen needs applied in the fall with anhydrous ammonia or spring-applied anhydrous ammonia. I’d say, really over the last 20 years, you’ve seen more of a move towards split application of nitrogen. There’s a fair amount of research that’s come behind that’s, I would say, pretty widely accepted in the industry now that split application of nitrogen is much more common than it ever used to be.

With what I work with in Nebraska, it’s almost universal. I know that’s not the case in some of the rainfed states and different management systems and on different soil types. I wouldn’t even say growers that are limited to owning their own equipment. Even one split application, maybe anywhere from 50 to 75% of their nitrogen upfront in the spring pre-plant or early post-plant and, then, a single side-dress application. Probably, more commonly, what I see for that nitrogen delivery method is some form of upfront pre-plant. Pretty common to come back with a weed and feed pass, where we have 32 or 28% nitrogen, potentially some Thio-Sul mixed in with an early post-planter, early post-emergence application. Then, perhaps another trip back across the field with a coulter bar at about V5. In the great state of Nebraska, with our irrigation, we tend to put it on season-long. We’d like to fertilize through our pivots, generally, at about 50% of our total N needs.

RENEE HANSEN: So, Mike, you’re talking, I mean, you’re going right into application timing. How does somebody plan for their application timing? Obviously, in Nebraska, they do have the capability to do that because they are working with a pivot, but for the rest of those who don’t have some kind of irrigation system, how do you plan for those different application timings? What are you looking at to make that plan? Are you using data from the past? Can you do it year one after you use the data, or do you need to be in a system for numerous years to develop a bigger plan, a bigger strategy?

MIKE MANNING: You’ve asked some multifaceted questions there. So, let’s kind of break that down one by one. Let’s just go. Let’s say we’re making the decision to go between a single application, like we historically have, and two applications. We’re going to split some portion of our total nitrogen pounds. The best way I explain it to growers is that our corn crop has a season-long nitrogen requirement. The closer that we can supply our synthetic nitrogen to that growing crop, or to the crop as it’s growing through the course of the season, the better efficiency we’re going to have. There are definitely places in Iowa and Illinois with very high organic matter, very strong holding capacity and some very nice flat-level fields. Dan Frieberg shared it many times in the past. Well, we kind of call it our surrogate data. Why are we seeing, in the group data, these 100% nitrogen fall-applied ammonia always showing up as the highest yielding in the database? Well, we were making those applications to some of our best fields that we could go place all that nitrogen at that time, in the fall, how to be available. And there are prime acres to begin with. The acres that were receiving a split application, or had some other balance of nitrogen pounds throughout the season, were those rolling hills mixtures of sand and clay and just more marginal acres that needed to be managed with a different stroke anyway.

Probably one of the biggest things I see, as it convinces growers to spread those nitrogen pounds out over the course of the season or minimally making more than one application, they see improved efficiency. And by improved efficiency, talking about pounds of nitrogen to produce a bushel of corn, and we generally see higher yields at the same time. So, it becomes a win-win. To what I think was one of your second questions: how many years of data do we need to have, or how do we arrive at our total nitrogen requirement? Again, we can kind of break that apart in a couple of different pieces. For somebody that is making a single application, I would say just take a couple of fields and plant a split application. Again, how does that fit into your labor and logistics workflow? For growers that own their own equipment with the sprayer, it’s pretty easy to convert. Not too much more difficult to incorporate a weed and feed side-dress nitrogen going on with your post herbicide. For guys that hire it out, that hire their spraying out, it might make sense for them to acquire a coulter bar and go make an application in season. Or at least go rent one and try it. Take a handful of fields and just try it for a couple of years. Now, if you have 6% organic matter on perfectly flat earth, you’ll probably completely disagree with me. If you farm anything other than that, I would put my money on split applications just about every time.

RENEE HANSEN: The split application is really becoming more popular. You mentioned that in the beginning of this podcast, that you’ve definitely seen the trend move the line more towards split applications. So, you did mention this also about nitrogen efficiency based off of the field. So, can you talk about why having a plan, a nitrogen strategy, how that makes you more efficient with your nitrogen to gain more yield?

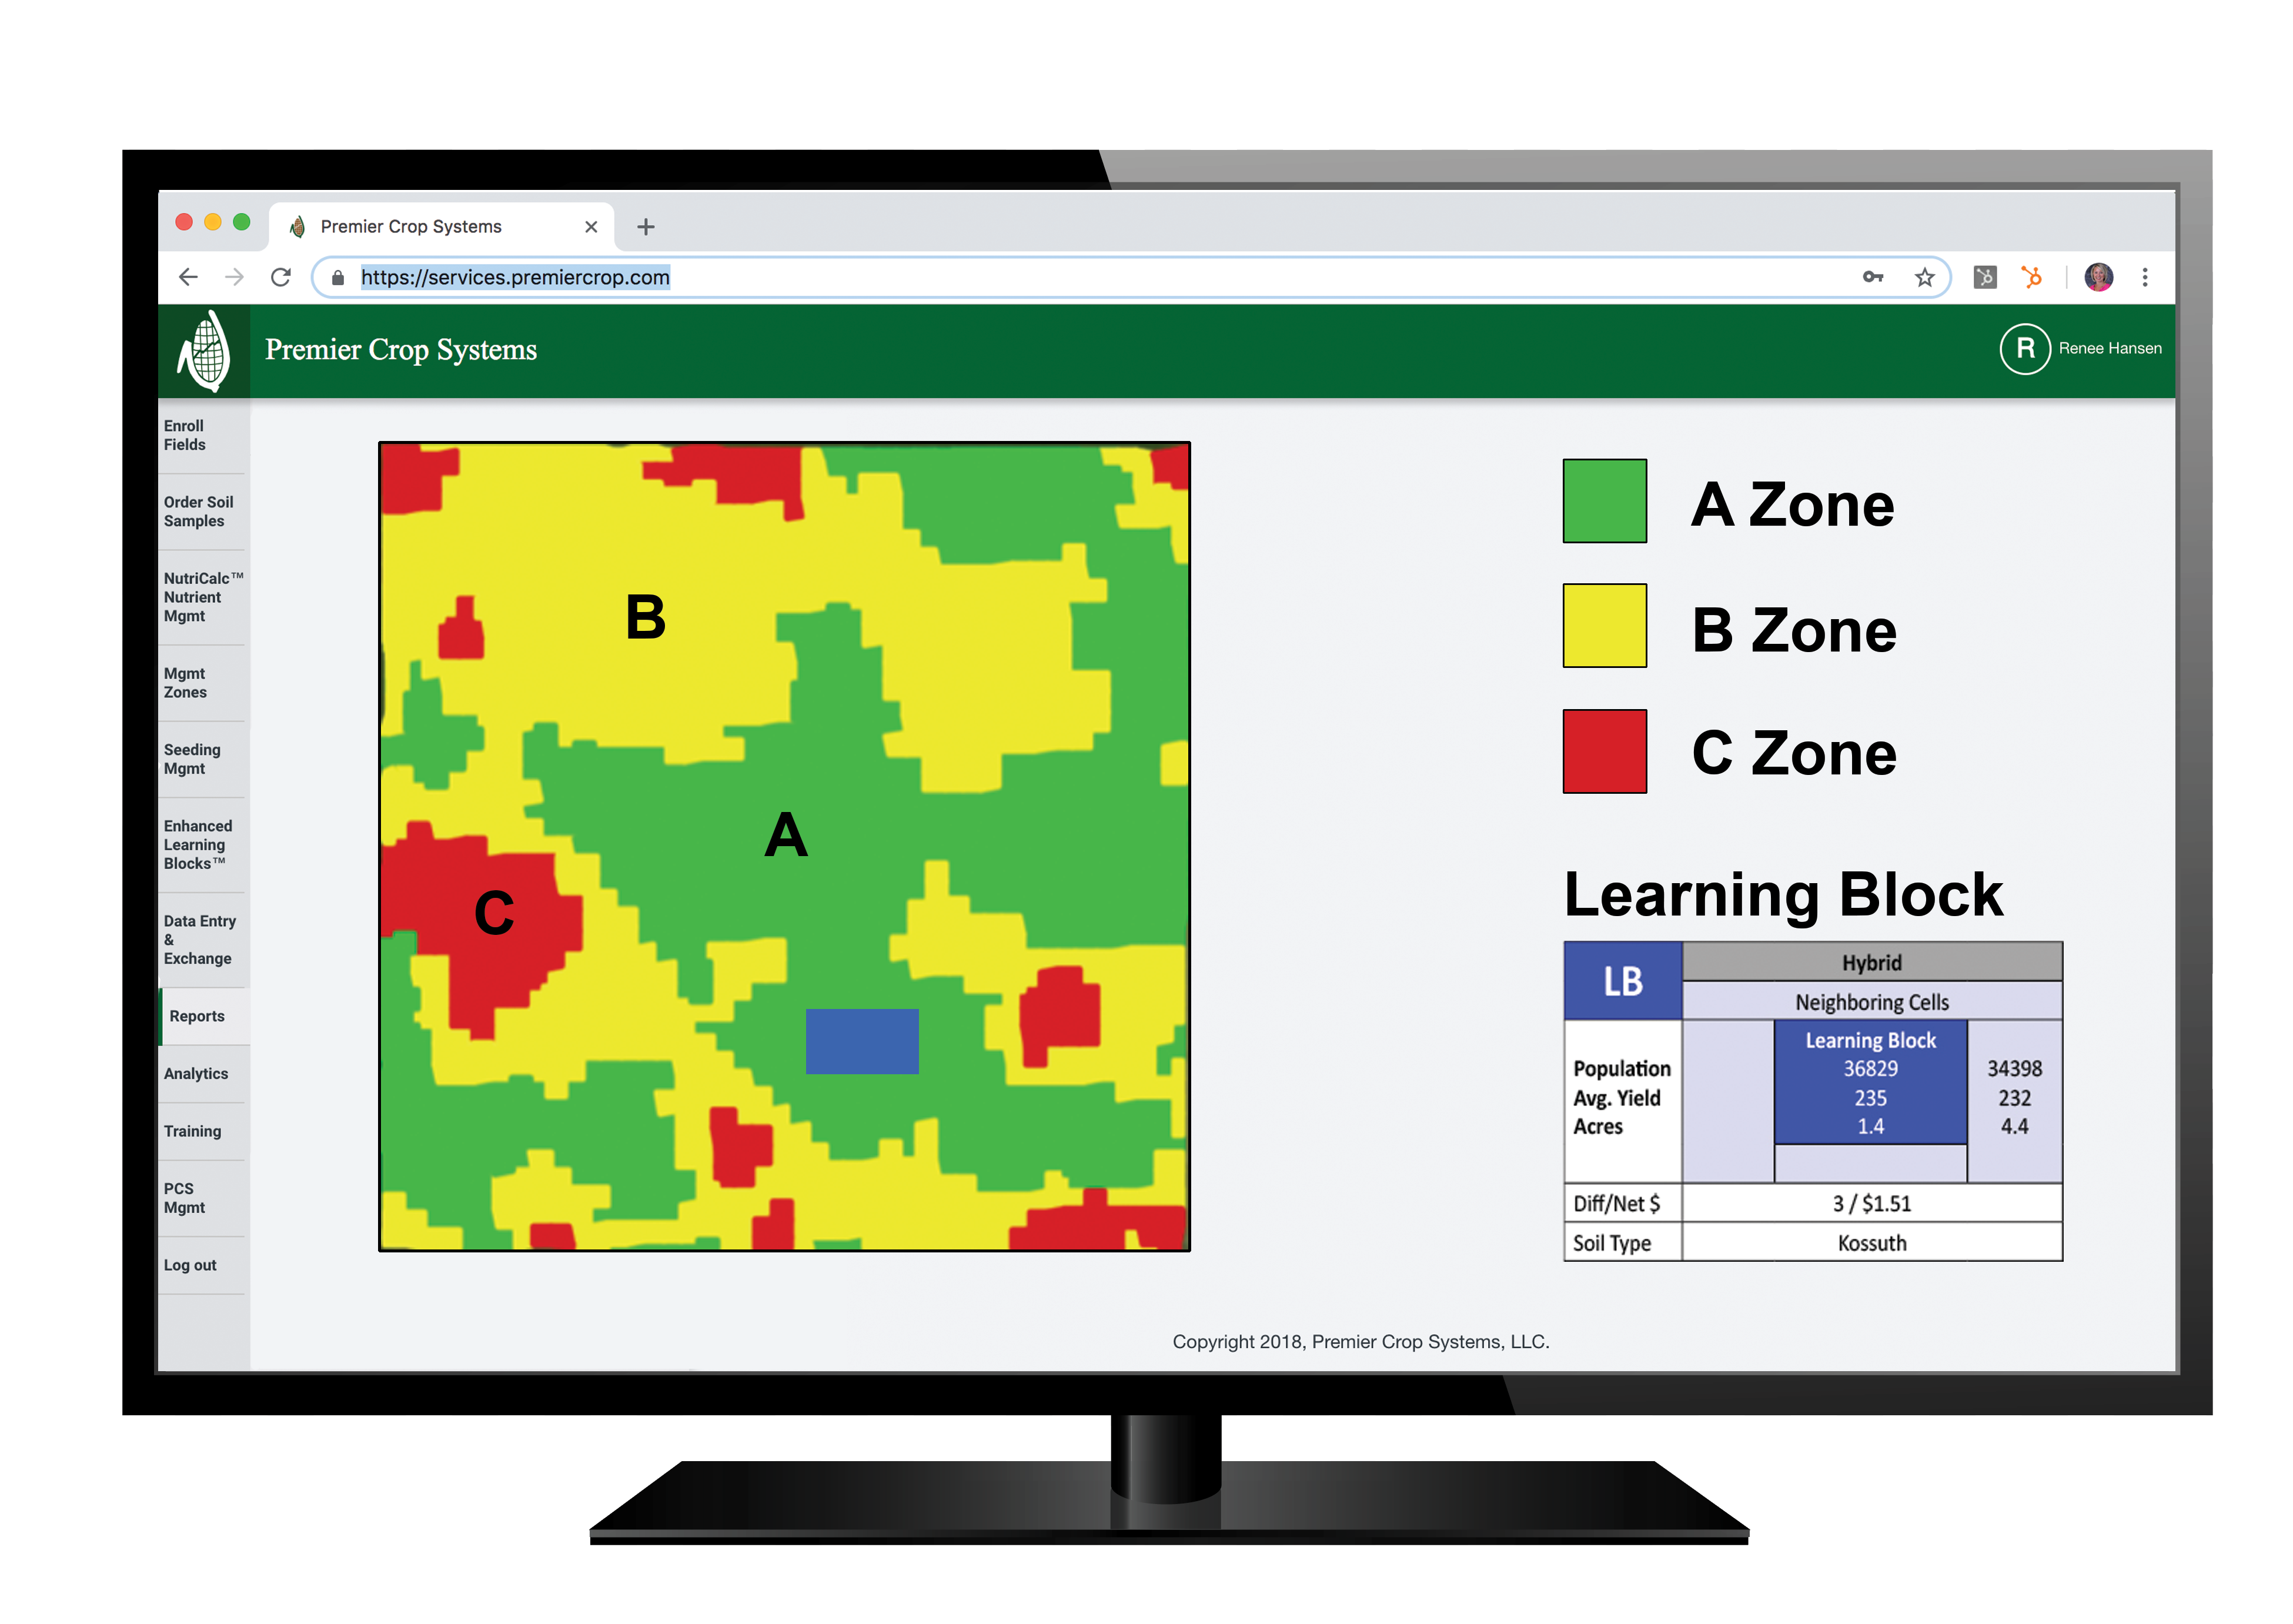
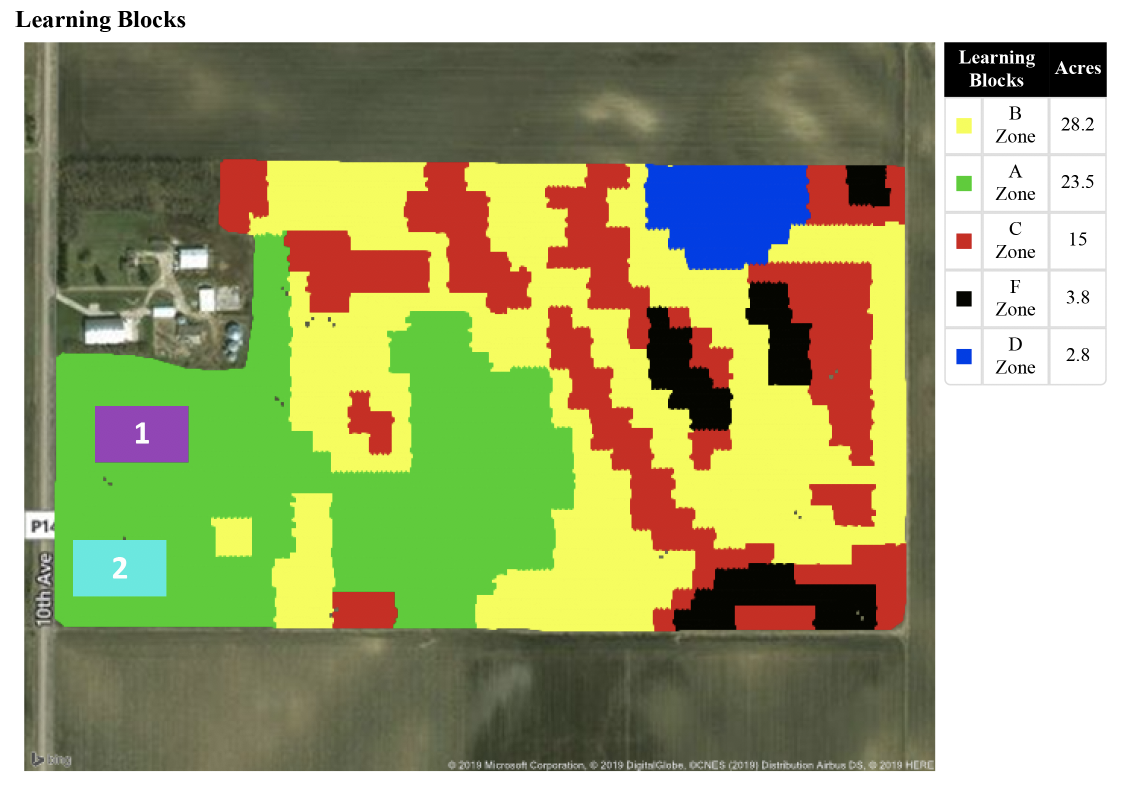
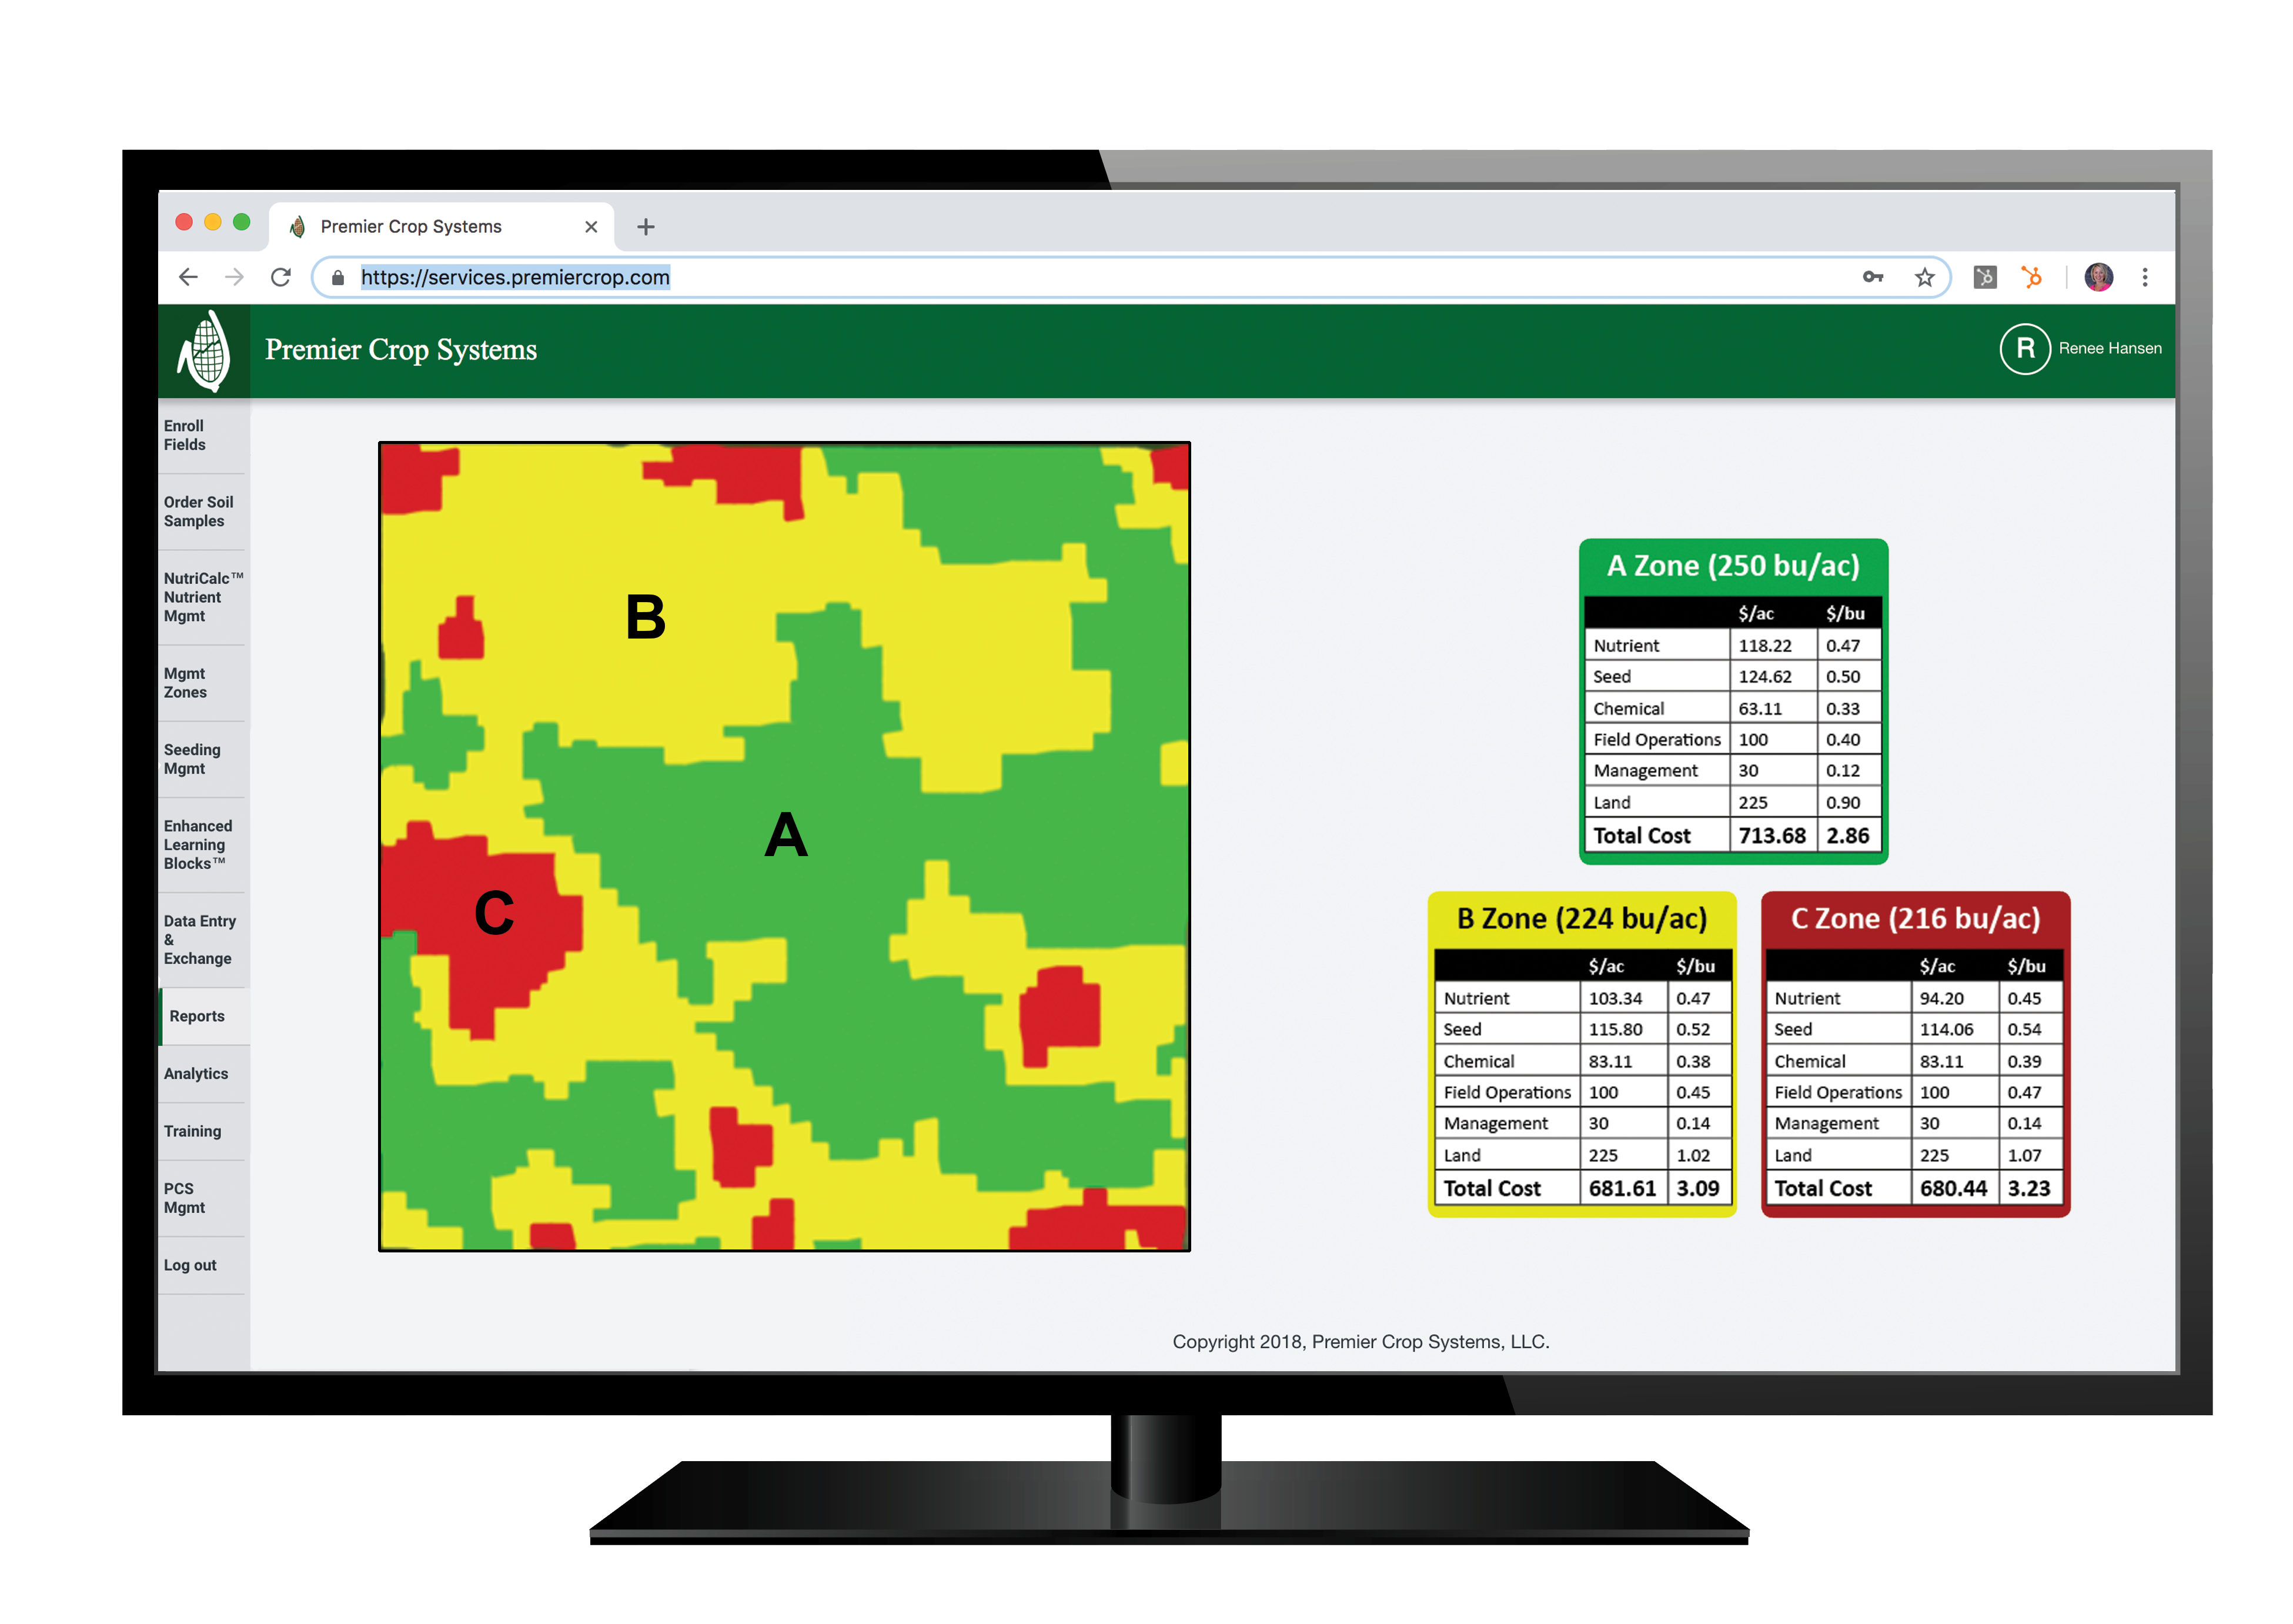
MIKE MANNING: Combination of factors. I’d say, bottom line, it does. A split application helps us be more efficient, but if we’re measuring the results off of our farm, we can actually see what those real efficiency values are. With Premier Crop, we talk about zone management a lot, managing fields by zones. Zone management makes sense. Just for my standard disclaimer on that, we’re not talking about zone soil sampling. We still have a grid soil sample underneath of that. One of our favorite methods for arriving at Management Zones is principally looking at historic yield data. For the most part, the best area of the field has always been the best area of the field. The poorest area of the field has always been the poorest area of the field. Using other pieces of spatial data to maybe augment that, whether that’s grid sample data, EC, EM data, soil survey maps, where applicable. We can use that to help augment and guide zones.

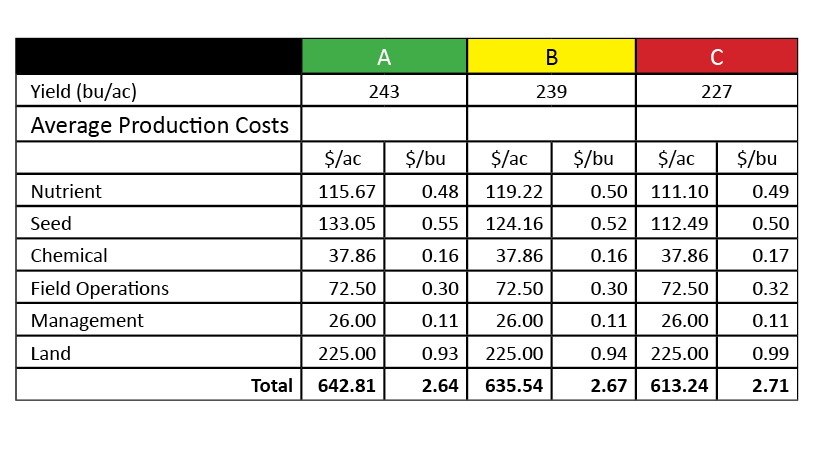
So, now we think of our traditional Premier Crop ABC management zone approach. We start seeing efficiencies. You start breaking that out year over year, especially in those corn years. If I see consistent efficiency of, say, 0.75-0.8 pounds of synthetic nitrogen per bushel produced in my A zone, maybe 0.9 or 1.0 in my B zone and maybe anywhere from 1 to 1.2 pounds of nitrogen in my C zone, I see that consistency. We can confirm our zones. A, we know our zones are behaving how we believe they ought to be behaving. B, we’ve dialed in management, probably with a variable-rate seeding approach, as well. And C, now we can start incorporating these nitrogen efficiencies that we’re observing within the field. That becomes, well, A becomes an efficiency driver. And, all of a sudden, let me do some quick math. If I’m producing 280 bushels in my A zone, but my efficiency is at 0.7 pounds of nitrogen, I really only needed 196-200 pounds of synthetic nitrogen in that A zone. In that C zone, that’s at 1.1, and it’s producing 225. I probably needed 240-250 pounds of nitrogen in that C zone. At the end of the day, it’s spatial management. As things change in the field, we’re adapting our management to it and, then, marrying economics and efficiency back to it. Now, it also ties right into sustainability. We’re being a lot more — we’re just being smarter with how we’re applying fertilizers on our fields.

RENEE HANSEN: Mike, that was going to be my next question to you, and I think you already answered it. When it comes to nitrogen and efficiency, it couples the economics, so profitability for the farm and sustainability to the land.

MIKE MANNING: Absolutely. It’s agronomics, economics and the sustainability piece. Agronomically, we’re producing good bushels. Economically, we’re doing it very efficiently. Sustainability-wise, we are being good stewards of the land and being good stewards of our fertilizer resources.

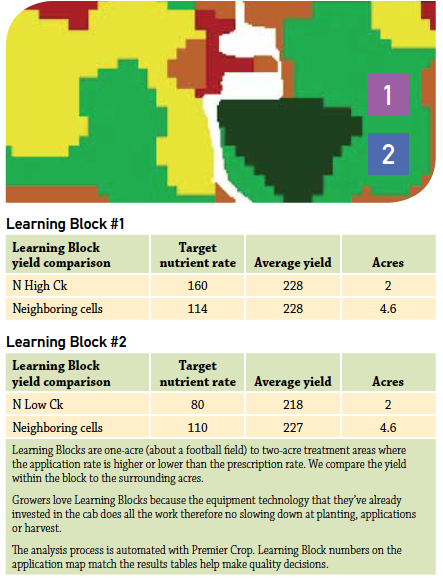
RENEE HANSEN: Lastly, can you talk a little bit about what Premier Crop is doing with what we call Enhanced Learning Blocks and possibly what you can do with a nitrogen strategy?

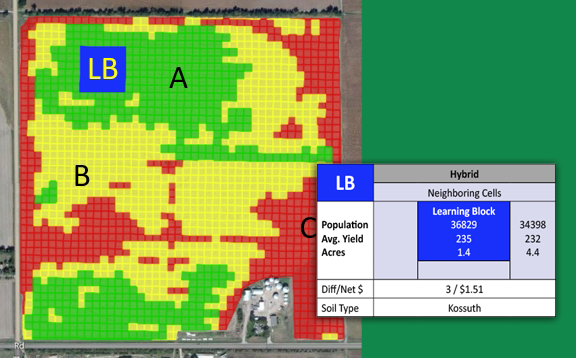
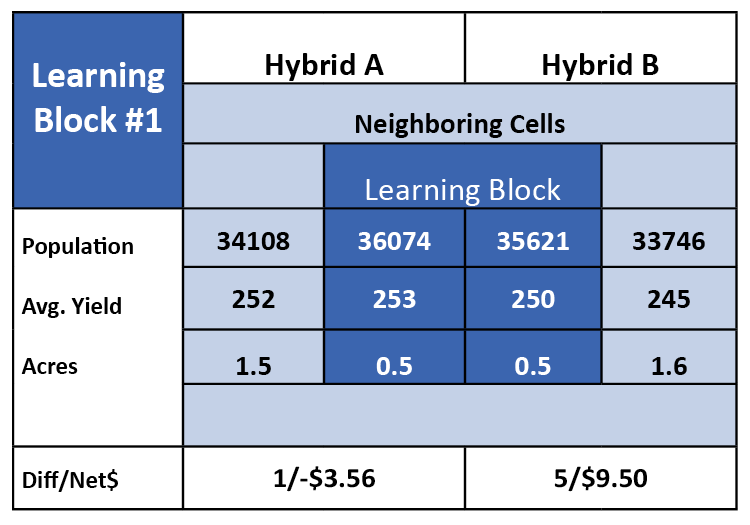
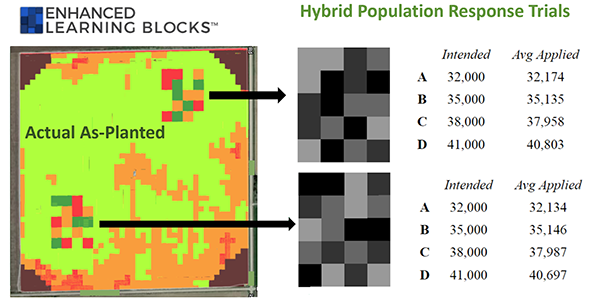
MIKE MANNING: Sure. So, Enhanced Learning Blocks, I’m pretty passionate about Enhanced Learning Blocks. I’ve been using them widely since 2016. I haven’t done a ton with nitrogen, but there’s certainly an opportunity to do that. So, an Enhanced Learning Block we’re taking builds off the traditional Learning Block concept.

Screen Shot 2021-04-20 at 4.44.41 PM

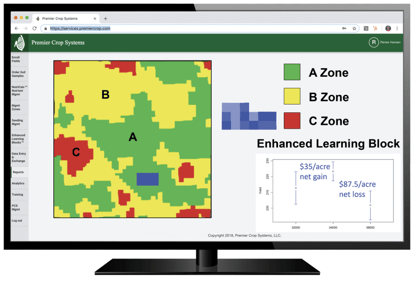
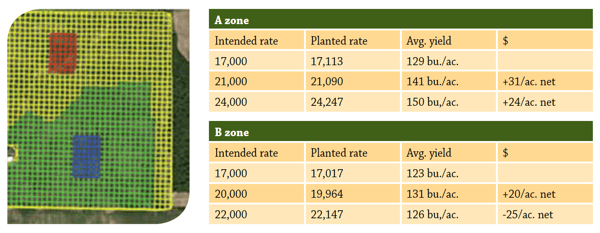
Let’s take a two or three-acre block in a known area of the field, and let’s change our rate. Let’s go up or down. Well, enhanced learning blocks enabled us to introduce both randomization and replication. So, instead of testing a single rate in a two or three-acre block, let’s test three or four different rates and then replicate it five times. So, now, in the case of nitrogen, if I was, say, on a side-dress application, I was coming in with 30 gallons of 32%. Let’s pull up 28.005. So, if I was at 30 gallons there, I’m looking at about 90 pounds of nitrogen. Within that enhanced learning block, maybe it’s about four acres in size now. Let’s test rates at 20 gallons, 25, 30 and 35. Or 25, 30, 35 and 40. This system — we build it into the prescription system — enables that application to execute in the field. Then, we can have statistically valid nitrogen response results to review at the end of the season, and that becomes very powerful. What is the right rate? Obviously, one trial one year from one field is not going to answer the question for your entire farm, but it starts you down that path of learning. In many cases where I use Enhanced Learning Blocks with my growers, we have multiple blocks where you have anywhere from one to five blocks per field, and we replicate that on just about every field they farm. So, they’re building a research quality data set off of their own farm with their precision equipment. I’ll leave it at that. Nitrogen management and how nitrogen behaves in the soil, in the environment, and how it performs agriculturally, agronomically for us, is probably one of the most complex aspects of agronomy. Again, just to reiterate, there is no one-size-fits-all solution, but it is about tailoring and optimizing things that best suit your farm.

RENEE HANSEN: And that’s why having a nitrogen strategy and building that with an agronomic information advisor like you, Mike, is really helpful because you have the knowledge. You see the data, and you can help the grower learn, year over year, how to best get the best profitability and sustainability on their land.

MIKE MANNING: Absolutely.

RENEE HANSEN: Thanks for listening to the Premier Podcast, where everything agronomic is economic. Please subscribe, rate and review this podcast so we can continue to provide the best precision ag and analytic results for you. And to learn more about Premier Crop, visit our blog at premiercrop.com/blog.

Learn more about soil health.