Measuring Yield Efficiency Using a Visualization Platform

We are excited to announce the launch of our new Data Visualization platform, part of our three-tier technology strategy. This new platform allows growers to gain key insights that give them the ability to make informed decisions based off economics, seed, crop protection, fertility, operations and management.

The Data Visualization platform is focused on grower dashboards and group benchmarking ultimately showcasing a Yield Efficiency Score for growers’ operations.


yield efficiency as an ag tech disruption driver


“Data Visualization is a key to helping growers understand their yield efficiency as their measure of success using a Yield Efficiency Score,” stated Darren Fehr, director of sales and marketing.

A Yield Efficiency Score, by Premier Crop, similar to a credit FICO score, is a single number derived from multiple factors. Its purpose is to determine a grower’s return on investment on a per acre basis but from a spatial perspective.

Yield Efficiency is rapidly becoming the most important metric to measure grower’s success in order to enhance a grower’s operation. “Our ultimate success is the grower’s success. We are constantly looking to improve growers’ operations to maximize efficiency and help them be more profitable on the acres they have,” said Tony Licht, business development manager in Iowa.

Premier Crop’s Data Visualization platform and Yield Efficiency Score allows a grower to visually see anonymous group data and grower benchmarking. It provides a benchmarking score how a grower is performing against others as well as against their own fields. Using the grower’s actual data in five of their most important decision-making categories (economics, seed, crop protection, fertility, operations) to prove efficiency and effectiveness of crop production.

bradhagan_centraladvantage

“Group data is powerful over that many acres, allowing us to benchmark with other producers anonymously, which is invaluable information to my operation,” said Brad Hagen, Minnesota corn producer. Brad works with Premier Crop’s partner, Central Advantage GS.

Share Your Farm Data?

It’s hard to avoid hearing about the promise of “big data.” Thanks to Edward Snowden’s revelations, it is also easy to spin conspiracy theories. There are many big-data analytics examples cited, such as Amazon and Netflix. They suggest books and movies we may enjoy based on what we have “liked” in the past or what other people who seem similar to us like. Google, the National Security Agency and others evidentially collect data bout what we search, what and whom we email, and much more.

There seem to be several “values” from big-data analytics. Many companies’ goals are to monetize data through better value propositions to their customers, like selling advertising, how they position products, differential pricing, etc. Another goal is to reliably predict behavior. For example, Bob shares a common background and behavior as Tim, and Tim likes this brand; therefore, Bob must like it as well.

Reliably predicting behavior, better product value propositions and differential pricing are all examples of how companies could use your agronomic data. For example, your field soils are X, Y, Z and hybrids A, B, C outperformed hybrids Q, R, S on 85% of the X, Y, Z soil; therefore A, B, C is the best possible value proposition for you. That fact that your soils are X, Y, Z is “public knowledge” – because the soils database is public.

But a company might say, ” to really perfect our value proposition, we need your non-public agronomic data. Why don’t you send us your historic yield data, your fertility data, your management information, etc.”

What can it hurt? After all, they only want to help you. The reality is, we all share “our” data with other companies, either intentionally in exchange for a benefit or inadvertently because we wanted a cool app, and sometimes the trade-offs are worth it.

For me, the difference between consumer data sharing and sharing your geo-referenced agronomic data is profound. Your reading choices might influence what advertising you see; your agronomic data is your “business” data. There is nothing anonymous about GPS data.

Anyone with a tractor guidance system has heard about the different levels of GPS accuracy. Any of those accuracies are more than sufficient to provide site-specific data about your fields when you use a documentation system.

For Premier Crop, building a partnership to use data to make better agronomic decisions has always begun with this foundation: the grower owns the data, data is only pooled with permission, and even pooled data belongs to the growers who shared data. But Premier Crop’s history and operating principals don’t mean that’s the right way or the only way to use data to benefit growers.

premiercropoptixgroupdata

Sharing your data with seed, crop protection, nutrient or machinery suppliers can make business sense. These companies sell you products that are important to your business and profitability. Sharing your data to help them provide better recommendations may be well worth any trade-off. Most important is to think through those trade-offs and each partnership proposal.

Got data?

1. What are the partners going to do with the data? Perhaps more importantly – what will they assure you (in writing) they will not do?

2. Some of your partners may be fearful of missing out on the “next big thing” if they provide the wrong answers to your questions. What questions are you asking?

Learn more about data analytics here.

Using Data for Hybrid and Variety Seed Selection

“Part of the value of what they get in the Premier Crop program is being able to see beyond their own operations. A lot of times, hybrid and variety is the very first thing they look for.”

– Dan Frieberg


DAN FRIEBERG: I always think, from a grower’s perspective, that the first analysis that you do is your own. It’s what your own results were from that crop year. What worked and what didn’t? It’s understanding analytics by hybrid or variety across their operation. The reason that it’s really great at a grower level is that, sometimes, a hybrid or variety in data shows up having done really poorly at a grower level, but the grower knows where it was planted. They have the benefit of knowing that the reason that number did badly, or looks bad, was because I planted it on my three worst fields. It may have been that they picked the number intentionally that had more defensive characteristics because those are really difficult fields. So, I think just looking at how your numbers did on your own operation is maybe a starting place.

TONY LICHT: Maybe to build off of that, Dan, from there, once I do the analysis on my own operation, then I want to think about: “How did it do for others around me in a like environment, somewhere pretty close to me?” Because if it happened to do poorly for me, but I find out it did well for others, where did it do well for others? How can I correct that?

use data to select seed hybrid

DAN FRIEBERG: Amen. Every grower in the system has the option of whether they want to be part of seeing anonymously beyond their own operation. Today, they all want that. Part of the value of what they get in the program is being able to see beyond their own operations. A lot of times, hybrid and variety is the very first thing they look for. They want to see beyond what their own experience was.

TONY LICHT: And depending on the number of hybrids or varieties they’re planting, sometimes if it’s planted on a small amount of acres, they completely forget about it. I mean, you think about the larger-acre hybrids, and it’s like: “Oh, I forgot about those new ones I planted. How did they shake up against the rest of my line?”

RENEE HANSEN: I mean, you’re talking about expanding beyond the operation, in a sense benchmarking against other areas or like areas. Can you explain or elaborate a little bit more about how Premier Crop utilizes the hybrid and variety selection with data? What does that potentially look like? Or what is the conversation with the grower?

DAN FRIEBERG: Renee, it’s kind of unlimited sorts. Initially, a lot of people might focus on soil types. If they have dominant soil types, it might be just hybrid and variety performance on different soil types. In some markets, for example, pH can be a huge driver on soybeans. High-pH areas or low-pH areas can have a huge swing, and varieties respond differently in those environments. Those would be two examples of how people get started, but they probably don’t stop there. They look at things like planting date or harvest date. So, if you’re a large operation, what inevitably happens is you end up with some fields that you know are going to be harvested last. So, for those numbers, Renee, they might drill down on late-harvest data. They’re trying to pick numbers that they know will stand and hold the ear late into harvest because some field has got to be harvested last, and a lot of growers literally plan. They plan their harvest by the way they plan their planting. There are certain fields that are always going to get planted first. In the case of harvest, there are certain fields that are going to be taken out first. It might be the ones that are closest to the bin site. They want to get the bins. They want to get the dryer going, and so there are certain fields that will come out early. A lot of times, those fields that come out early will probably get more of a racehorse number that doesn’t have to stand. It’s the highest yield potential because they know they’re going to get it before they get very far into harvest.

profitability by hybrid or variety

TONY LICHT: As-applied fertility can also be another environment they may want to look at, as well. How did I treat this group of corn hybrids differently on as-applied nitrogen, maybe split treatment or in-season treatment, versus just “all in the fall” kind of a concept? Are there differences amongst the hybrids and varieties now? How did they react to the environment they were in, whether it be as-applied fertility or soil test fertility?

DAN FRIEBERG: What we do is just adding another source of analysis to what a grower considers. A lot of times, their decision is if something did exceptional for them, they’re probably going to plant it again, obviously. They’ll look beyond their own operation to see and make sure it wasn’t a fluke or see how it held up in other environments. One of the advantages we have is that we can tend to see the hybrid and variety performance in different growing environments in the same year, meaning that you might’ve been in a really dry area, but you can go look and see how it did in a normal area. Or you happen to be unfortunate and you got hit by the wind, and so, sometimes, you want to jump out of your area because your own data isn’t as meaningful, just because you had something that happened that didn’t make your data quite as useful.

TONY LICHT: I was just going to say that’s a great point. Case in point: the wide area this year that got hit by the derecho. Those folks don’t lose data for a year. They still have the ability to build on data, albeit from a little bit further than their real local geography. It might be from 20 miles away in an area that was not hit. It could still be considered a like-agronomic environment.

DAN FRIEBERG: There are really big dollar swings because we’re measuring the economics and the agronomics. The reason people focus on it a lot is, at the end of the year, there are just really big dollar swings on a per-acre basis. It could easily be a 100 dollar-per-acre swing in return to land and management or what we call yield efficiency. You can just see really large swings. When you start analyzing that way, from my perspective, it probably leads to having a strategy where you call more aggressively. I grew up on a livestock farm and the term “cull,” “culling the herd.” In the livestock industry, you’re just constantly eliminating the low producers. When you’re making genetic selection, you’re eliminating the bottom 20 percent or whatever. In the case of hybrid and variety selection, I think, sometimes, we need to be more aggressive about calling some of the poor performers out if we’re really focused on trying to drive the highest returns.

Yield Efficiency Score

RENEE HANSEN: You both were talking about data. Can you elaborate a little bit more on the data features that Premier Crop measures hybrid variety with?

TONY LICHT: Everybody always thinks of just yield by hybrid and variety, but there are a lot of other attributes that come along with that hybrid: relative maturity on the chemical resistance or the seed disease resistance, as far as rootworm traits, non-rootworm traits. All those things come along with it. So, the conversation goes beyond not just a yield by hybrid, but maybe there was a specific trait that really helped drive yield, or a certain plant date helped drive yield. What are the trends I can see across my farm from a given year, and then also across a series of years, as well?

DAN FRIEBERG: Over the years, you’ve lived through some of the trait issues, just where we had areas where the rootworm trait wasn’t holding up. We ended up going through several years where needing a rootworm insecticide was a big part of the strategy and a big return for growers.

TONY LICHT: Absolutely. As a grower, do I need to do a double approach here? Not just the trait, but seed-applied insecticide, and where? And what can I expect from those people that have been utilizing that? What has the success rate been for them, to determine immediately, like: “Okay, well, here’s kind of a return on investment I can expect to get back out of this.”

DAN FRIEBERG: The trait thing probably also comes up as people shift in herbicide strategies. Renee, people would use the data to try to quantify differences in herbicide if they’re considering Liberty or if they’re needing to rotate strategies from any kind of a pest management or weed management strategy. That’s another piece where they drill down in data a lot, just to try to find the best performing genetics, as they’re switching strategies.

RENEE HANSEN: So, what would you say is the benefit to having all of this data to a grower who is utilizing Premier Crop Systems versus somebody who isn’t?

DAN FRIEBERG: It’s even the growers we work with, Renee. We are one part of how they make decisions in the seed world because, a lot of times, they have seed sellers who they really trust. They have long-time relationships in local communities with seed advisors. So, a lot of times, the seed advisor is there, too, and most growers will want to plant 20 percent of their acreage to something that’s new because every year there are new genetics coming out. Unless it’s been planted commercially, we don’t have any data on the new numbers. A lot of times, that’s what happens. Their local seed advisor or seed seller is positioning what they know about the new genetics from plots and what they’ve seen in small quantities as it got planted in the pre-commercial years.

TONY LICHT: A team can definitely help that grower out. We’ve always said that agronomy is local. So, that local knowledge with that seed advisor, combined with a lot of data points from a given area, can just help amplify the value proposition for the grower in getting the right seed on the right acres.

RENEE HANSEN: Yeah, and since we have a lot of data in our system, we clearly have seen. Over the years, with all of the data in our system, have you seen trends? And what are they?

TONY LICHT: There have definitely been trends in certain geographies of a stronger yield correlation by later maturing hybrid. But within that, there are all these “gotchas,” where there are a few early-season hybrids that perform within those environments very, very well — whether it be later maturing hybrids going further north or earlier maturing hybrids going south. So, definitely looking at not just a multi-year, but looking within and across those different years individually, trying to pull out those trends of what hybrids can be moved around either north to south to accommodate diversifying a grower’s portfolio.

DAN FRIEBERG: In the early years, you could literally see in the data. Sometimes, when companies had trouble with trait insertion, the non-traited versus the traited, you could actually see a yield decrease. I mean, companies are getting way better at that. I don’t think it’s as big an issue as it might’ve been in the early years.

TONY LICHT: When new traits come to the market, growers will definitely want to ask the question: “How do the new traits compare to my existing operation? Or how much more do they bring to the table for me?”

DAN FRIEBERG: Growers drill down on that really quick because what tends to happen is new traits come at a price. Usually, the company is wanting a premium for them. They’re trying to weigh that. Is that extra seed investment worth it? Am I actually getting a higher return?

RENEE HANSEN: Can you talk a little bit about yield efficiency — and Dan, you did elaborate on it a little bit — and how developing and making a selection for your hybrid or variety, how that can attribute to your yield efficiency score?

DAN FRIEBERG: Yield efficiency is just the dollar-per-acre return to land and management, meaning, after you’ve paid for the seed and nutrients and crop protection and field operations, what’s left. From a seed perspective, Renee, it comes down to: “What was the price point? How much did I have to pay for the seed?” And then, probably, the next piece is: “How could I manage the seed?” There are some numbers that just have a lot of flex, meaning they’ll flex ear size as based on population. So, in a highly variable field, that might be a great strategy, just something that will really change. In other words, you can plant at a lower population, and if it’s a good year, you won’t take a yield hit. Versus a fixed-ear number, they’re really responsive to populations. It’s just even a bigger factor. Some numbers just require more. In order to produce at the top end, in general, you need more. You need more plants, but some numbers seem to be able to flex more than others. So, that goes into yield efficiency because if you can plant a number at a lower rate and still achieve the same yield, you could potentially add 10 or 15 dollars an acre in return.

TONY LICHT: To build off of just reallocating your rate around the field, as planters become more sophisticated, we can reallocate which hybrids go on which part of the field, assigning hybrids to zones or soil types and at different rates, as well. We’ve got a different cost point of the hybrid and a different rate to maximize the ROI.

DAN FRIEBERG: We have a lot of growers in the system that are doing multi-hybrid or multi-variety planting. Do you think that’ll continue to grow? Where do you see the trend on it?

TONY LICHT: We continue to be in a discovery phase with that, of trying to figure out the best placement of hybrids, the different rates of hybrids, like those treatment blocks behind you in your background, Dan. ELBs accelerating the learning of rate and also placement of hybrids helps us versus single-rate testing year over year. We definitely continue to try and find the bottom of the soybean population, but the issue with that is, all of a sudden, it becomes an unemotional decision. That’s at times looking at data points in January, February, March, but all of a sudden, sometimes, it becomes a little bit of an emotional decision in season. If I feel confident in the data in January that I can drill down a seeding-rate population to 120 or 110 or 100 thousand, and, all of a sudden, I might get cold feet in April. If it happens to be a really great spring, and we can get out and plant early and do everything we want to do early, all of a sudden, it may be an uncomfortable situation of: “Boy, I don’t know if I have enough. I don’t know if I have enough information on planting this lower rate this early. Maybe for safekeeping, I should just turn the population back up just a little bit.” So, it’s trying to balance the emotional decision versus the data decision back in the couple previous months to really drive and find the bottom of where we can go on populations. It’s just the same way in corn, in soybeans and corn. As far as wheat, how much we want to sow. I think everybody kind of knows where the optimal rates are, but where are the extreme rates, the highs and the lows that really maximize that yield efficiency?

seed yield efficiency

DAN FRIEBERG: I get copied in on a lot of the trial results. I’ve seen some 80,000 seed drops on soybeans that just did exceptional, and they were learning blocks or replicated trials. It really gets your attention because if you start trimming 50,000 seeds, and you get a higher yield, it really drives the dollars really fast.

TONY LICHT: Seed treatments and soybeans have really, really helped us drill down, I think, our populations, as well. We’re better protecting that seed to ensure that every one of them matters more to get up and out of the ground in a timely fashion.

RENEE HANSEN: Yeah, ultimately, driving up that yield efficiency score, helping growers profit more. Thank you guys for joining us today. So great to see you, so great to have you, and we’ll be back again. Thanks for listening to the Premier Podcast, where everything agronomic is economic.

What Does a Year End Meeting Look Like with a Premier Crop Partner?

“We use SciMax Solutions, a Premier Crop partner,
to push everything we can
in order to get the best ROI
and try to do the best job that we can.”
– Mike Myers, Waukee, IA

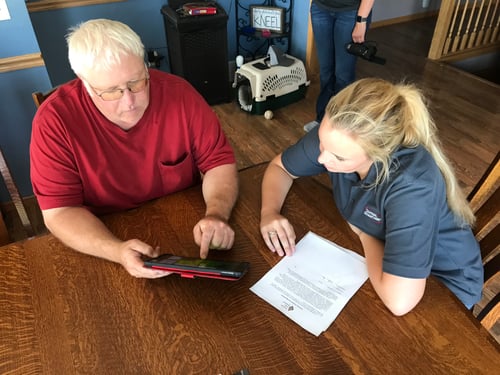
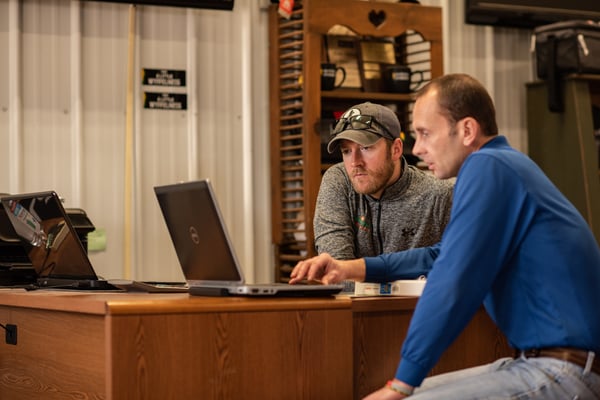
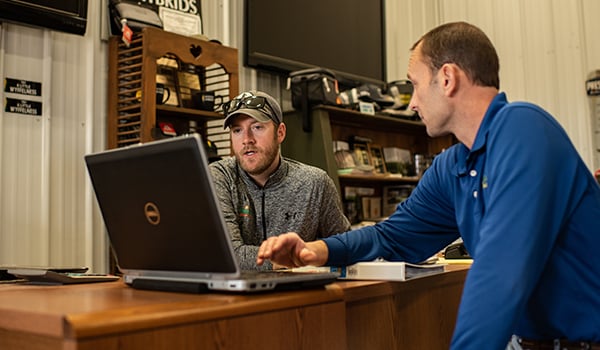
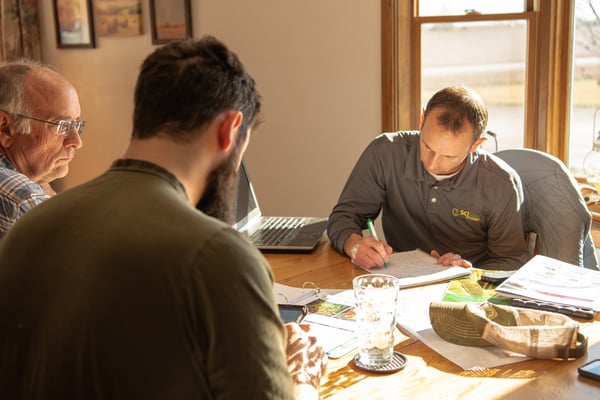
PETER BIXEL: I’m Peter Bixel, SciMax Team Leader, and today we’re working with two of our clients, down here close to Des Moines, Iowa: Dale Meyer and Michael Myers. And I’ve been looking at their information, reviewing 2020 data this year and planning for 2021.

MIKE MYERS: I’ve been working with Peter and SciMax for, I think, around seven years, something like that. Time flies. I work with SciMax to help push us to the next level. It’s a really good precision ag database that they have, and adding VRT into our operation was a big part of that, using our yield data and going into our management zones and pushing the best acres as far as we can. We haven’t pushed them as far as we can yet, and that’s the goal for the future. It’s to push everything we can in order to get the best ROI and try to do the best job that we can.

DALE MEYER: Before that, we were doing zone management for fertility by soil type. I mean, there was soil sampling, but it was, more or less, by the lay of the land and soil type. With the local co-op, we went to larger five-to-seven acre grids. They would spread it by areas, more or less, not necessarily by GPS but by a map.

Farm data for ROI

MIKE MYERS: Our precision ag and farm data was pretty rustic, overall. You just kind of guess where you were in the field. The biggest thing that helped us change was implementing yield data. As soon as we started picking that up, we needed something to do with it. Otherwise, what’s the point of getting it? Peter did a talk with Latham that made a lot of sense to us, that we could compile the yield data with our fertility, soil sampling, soil types, etc. And the biggest thing that he’s helped us with is to realize where we’re lacking, where we’re putting too much fertilizer on. I mean, it’s not a coincidence that our best yields have been over the past few years using SciMax’s precision ag tools. Now, you have to have the weather to do that, but without SciMax’s help, we wouldn’t have averaged 240 as a farm average last year on corn. It probably would have been 210, 220, like your average farmer in the area would have been. But with us doing the extra things and managing better with their help, we were able to get more return. More or less, we’re not at the beginning of this, but we’re starting to take the steps that’ll start pushing us even higher, I think. It’s not something in that we implemented everything right away, but we’re implementing some things more and more every year. We’re trying to build our soils on fertility-level more this year than we have in the past. And looking at the farm data he gave us today, I mean, if we continue the trend of what the farm data is saying, then that should pay off. Peter’s a really good guy to work with, too. There are other people that offer precision ag or something like it, but Peter’s the thing that kind of puts that all together, as far as SciMax marrying with Premier Crop and then bringing that to us. If he was a different person, I don’t know if we’d still be with them or not. I don’t know, but he’s keeping us for sure.

DALE MEYER: I think it’s safe to say that the majority of the farmers of my generation operated on a status quo thing up to a point. Then, the yield monitors came in to where we could see: “Oh, wow. I never realized that the wet spot was affected so much by the excess water.” So, a lot of tiling has happened because of that, and then, also, the fertility side with different soil types. In parts of the field that are high yielding, we were pulling a lot more nutrients off than we thought. I guess, maybe, we just didn’t even think. Precision ag kind of sharpened everything because you didn’t really know the advent of the yield monitor, as well as grid sampling and other things. Hybrids have improved, there’s no question about that, but, all in all, we’re doing a better job. We’re doing a better job of planting, as far as placement, depth and spacing, but particularly depth, or emergence at the same time. It’s easy for the seed companies to take a lot of credit, and they deserve a lot of credit, but the farm equipment’s and farm data management changed this picture a lot, too.

PETER BIXEL: Well, I think, studying the hybrids and placing them where they need to go makes a big difference, too. Before, maybe, if you were my partner, you just buy: “Yep, these three are good.” The dealer sold them to him. Where did you plant them? “It didn’t matter. You just plant them wherever you want.” No, there is a difference. You know that, Michael.

MIKE MYERS: Yeah, I guess for me, as far as all this, it’s all that I mentioned a little bit. Getting yield maps gives you a picture of what happened that year, and then making that into managing the zones, that shows us what has happened over many years. I mean we have a memory, but we don’t have a the farm data memory where we can go back and say: “Okay, this area of the field did this, and, on average, it’s kind of been a B area. Or it’s a C area or an A.” We can break that down, and then we can also look at the fact, and I mentioned it too, as far as fertilizer, where: “Okay, what did the field make? Did it do 200? Okay, we’ll put a flat rate of crop removal of 200 across the whole field.” Well, that’s not the truth. The truth is that the poor areas did 160, the medium areas did 200 and the high areas did 240. I mean, it varies, right? But that’s kind of the idea. I, over the past several years, have really been putting a lot of thought to the fact that I would really like to see what our yields would be today if we would’ve started doing precision ag and variable-rate fertilizer five years ago because what we’ve been doing is taking off 240-bushel corn on a good area and putting 200 bushels of nutrients back on. So, we’re stealing away from our good areas and adding to our poor areas. In those poor areas, you’re never going to yield what the good areas are going to do. So, we can better utilize our money as far as our investment into fertilizer, and then that should pay dividends in ROI and harvest time, too. That’s one of the biggest things, I would say.

PETER BIXEL: Their retailer in the past wasn’t able to really do the field history either, so now they’ve made a big change and adjusted things. Including adding strip-till.


CREATING NEW MANAGEMENT PRACTICES FROM FARM DATA

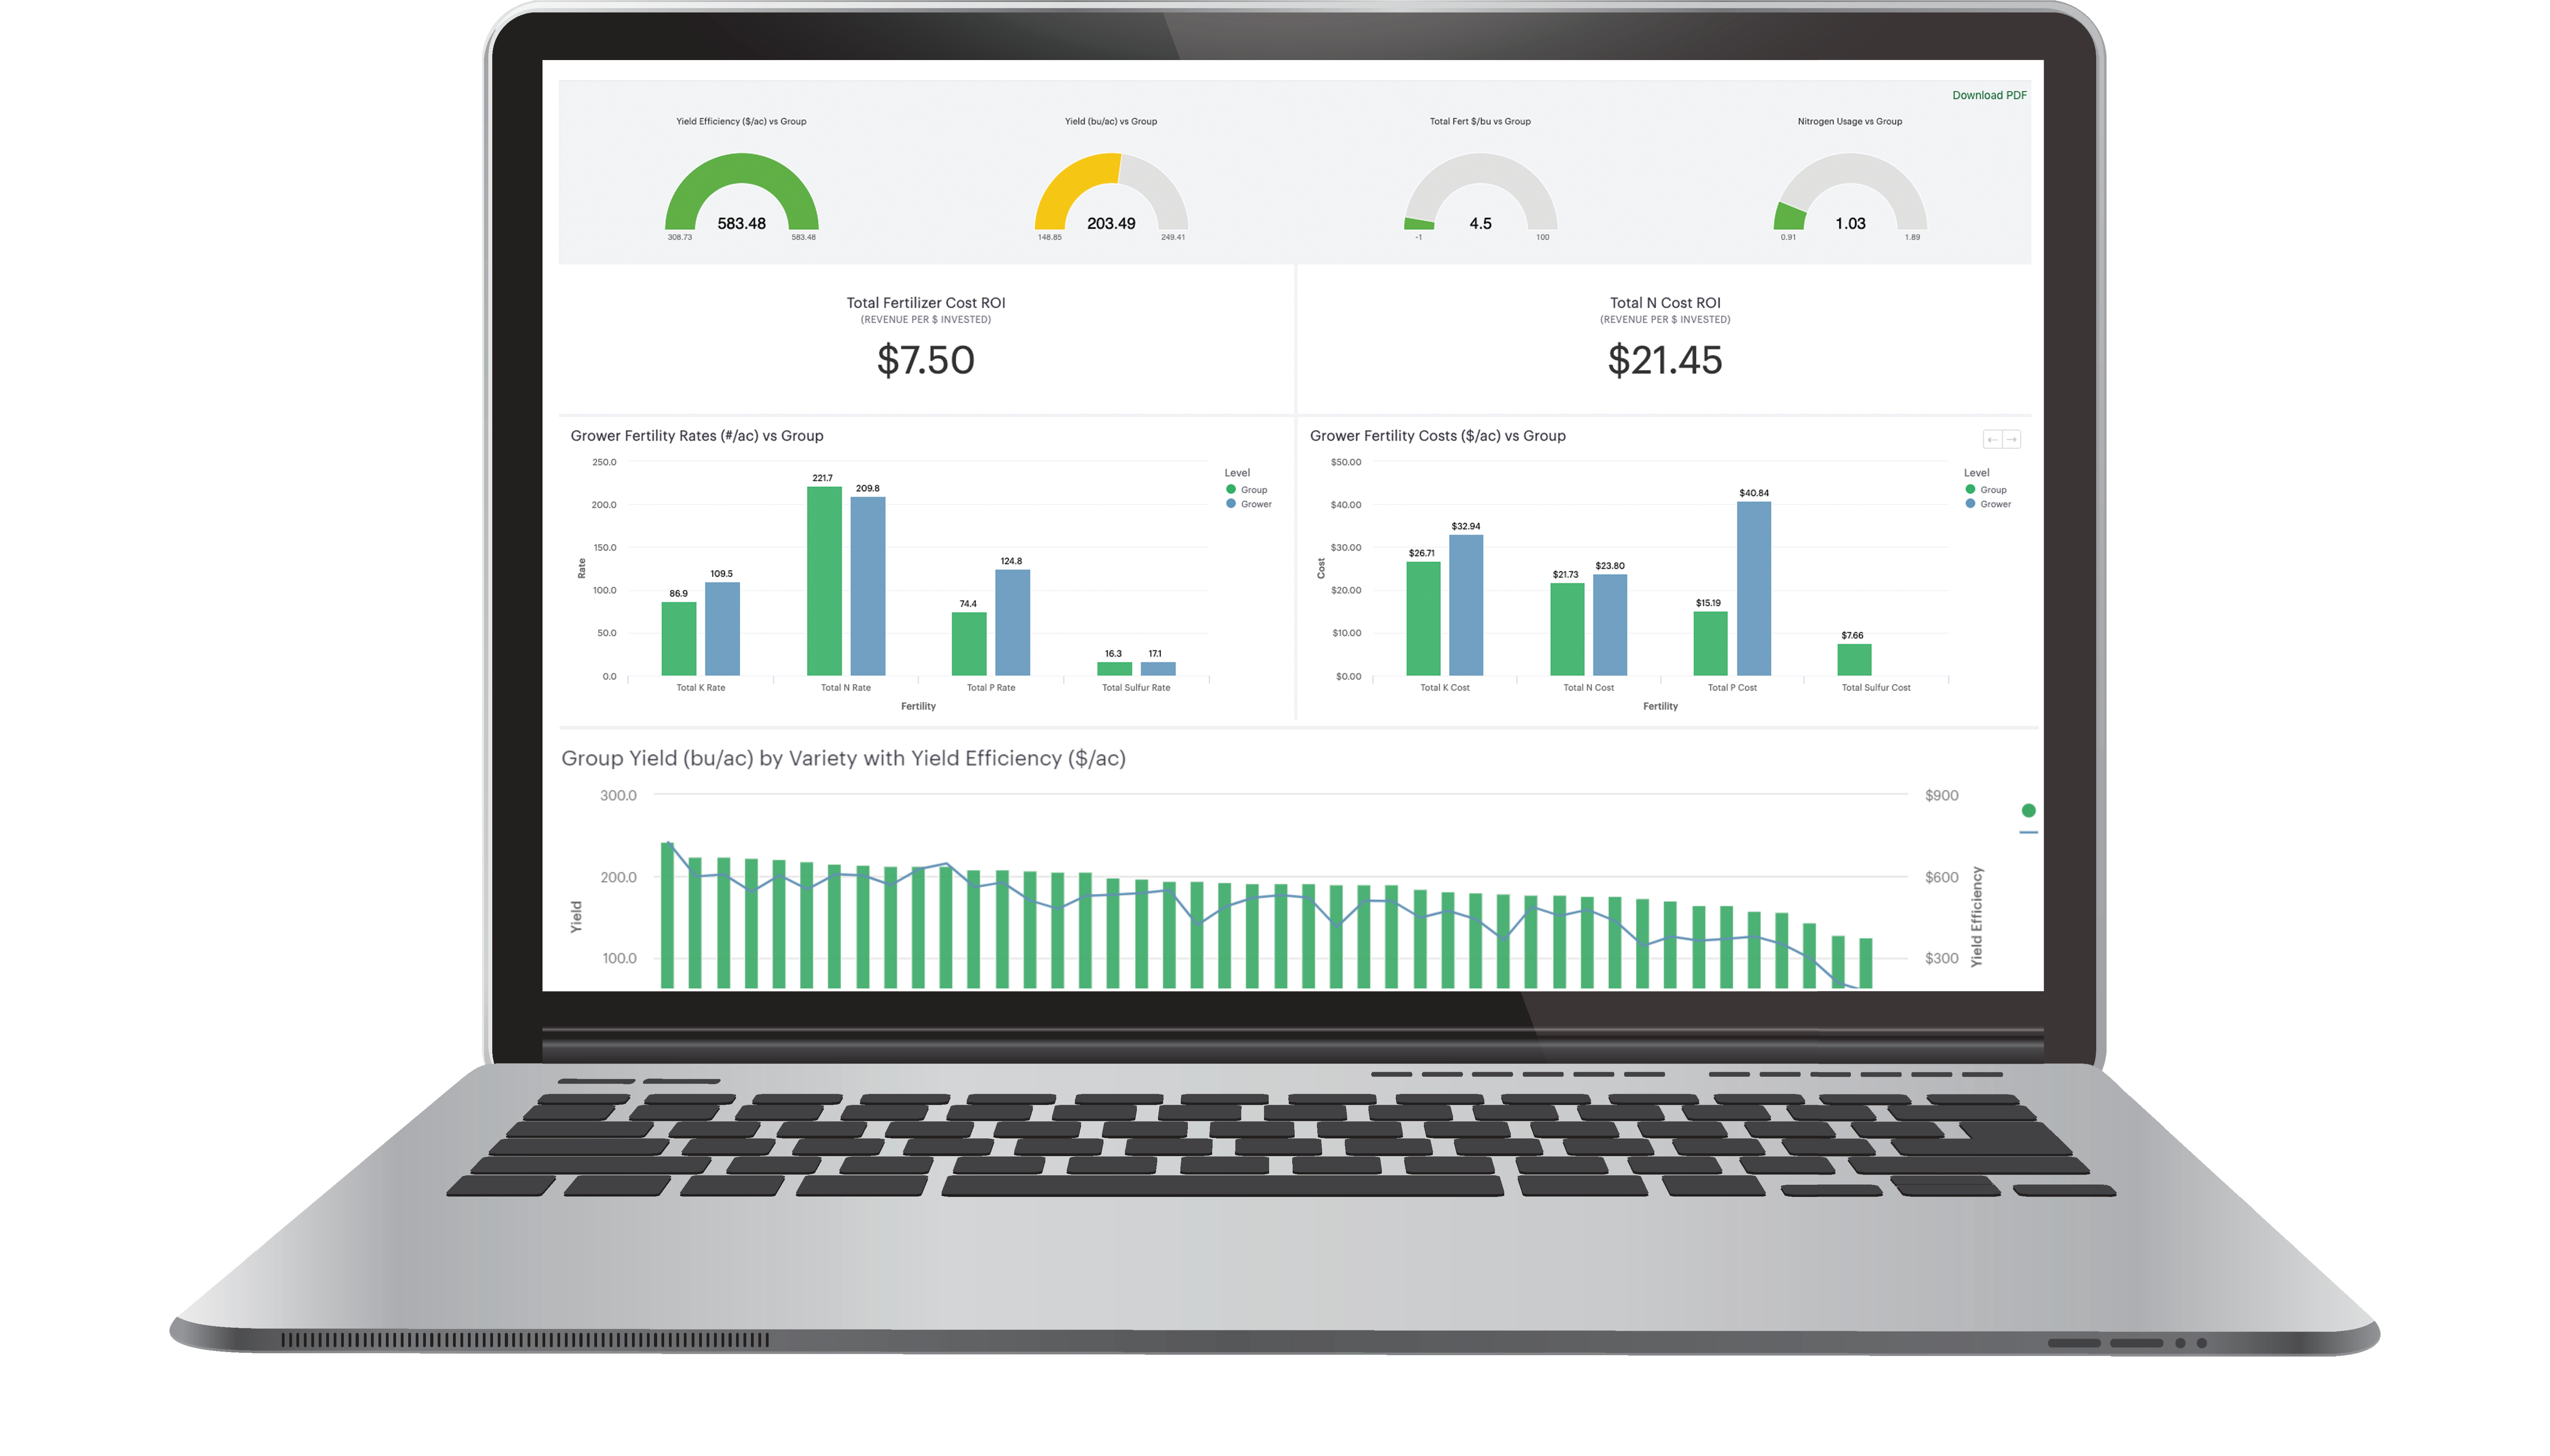
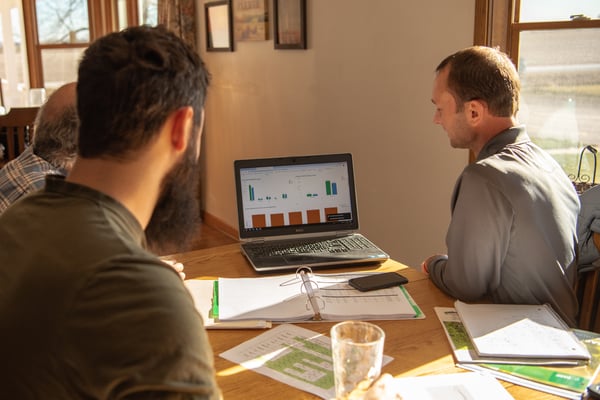
PETER BIXEL: We’ve come up with tissue sample ranges by stage for corn and soybeans on each nutrient. So, this is that line, and then, basically, it’s just the group average zone, all we did overall here. You’ll get yours with this graph, and then we’ll always plot their individual data on here. It’s kind of interesting. I mean, we’re pretty close to the limit. We tracked pretty close on nitrogen. Really, we weren’t that far off comparatively.

MIKE MYERS: I’d like to see the guys that did the KTS. Can we group that data and look at it?

PETER BIXEL: Yeah.

MIKE MYERS: Our application was right at V5, V6. So, we gained more stalk, but where is manganese?

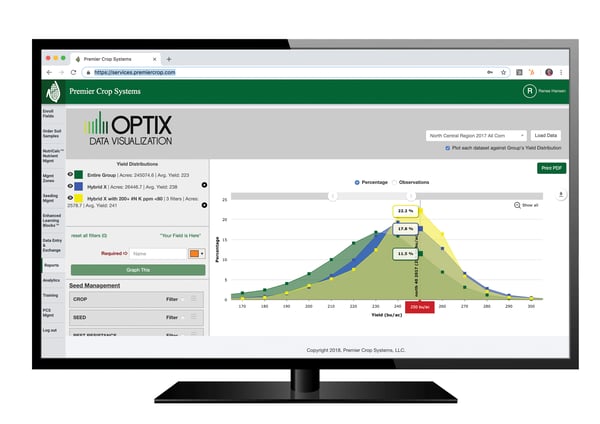
PETER BIXEL: Right here. (pointing to the field map on the computer)

MIKE MYERS: My manganese went through the roof, like right in there. I put it in with the KTS. Then I put that Versa Max, and that’s got manganese in it, and I took my manganese levels from like 80 to 100 clear up into 140s, and they stuck around until probably V10. I graphed it all out myself. Let me grab it. I think I got a pamphlet right here.

Using precision ag to look at tissue sample data

TISSUE SAMPLING

PETER BIXEL: Well, we’re trying to define trends for just seeing what the plants are telling us. It’s no different than a blood test, which you could say: “Well, that’s overkill.” Yeah, but the plants, the weather and everything change so much every stage, depending on the growing season. Like there in the middle of May, we didn’t hardly gain any GDUs for like two or three weeks because it was just cloudy and cool. Then, we took off, and we were growing like two stages from V4 to V6 in five days. The nutrients change by that stage. It’s kind of a way to gauge where the plants are at. Michael’s been pulling two different farms, and you pull in an A zone and just kind of track and see what they’re telling us. Not everybody, but the majority of us, will go, and apply what we feel the plant needs. Then, like he’s looking now to see: “Okay, if we applied zinc and manganese right before this tissue sample, and we applied it and we came back a week later, did we see the uptake?” Did the plant tell us they got it? Like my zinc and manganese, I think it took like about two weeks, two sampling times, for it to really uptake. For my potassium, I’ve got to look back. I can’t remember this off the top of my head. I think it took about three weeks because potassium is mobile. It takes water to get it down the soil. We didn’t have a whole lot of moisture, obviously, but Michael and I Y-dropped to put it next to the row so it would hopefully get in faster.

MIKE MYERS: Yeah, I just remember on the home farm, on the treatment out here, that the manganese just went through the roof. So, I know I can raise those loads.

PETER BIXEL: Manganese has been one that we’ve kind of struggled with, especially later on, but this year. I think some of it was due to the dryness, too. We didn’t have as much water as the last two years. So, it wasn’t flushing it through this profile. We were able to keep reasonable. The black line is where we want to be at, and you can see that. You got the polynomial or you got just the average of the polynomial for our group, and so we were able to stay a little bit better on that. The other thing, to me, that was pretty interesting was how boron’s been. If you look at the past years, we’ve been just horrible. We just tanked on boron. We would never come back up to where we’d like to be at but this year. Some of this, too, I believe, is we’re getting a lot more guys that are throwing boron in with their fungicide. Not everything, but some of that’s been helping bring those levels, I feel as a group, at least, up. We stayed pretty good, and the reason I think we stayed good on boron is that it’s mobile. We didn’t have rain. We didn’t continuously keep flushing that deeper and deeper in the profile. I think we’ll talk and see what everybody thinks next week. We can quit at like V10, V12, just because nobody’s been significantly doing anything different after that point.

PETER BIXEL: I know it would have because look at what you did last year. So, Michael and Dale, they’ve been doing some different stuff last year. It definitely showed, I think, good stuff for all your treatment, boron and zinc already, and things like that. I guess it kind of tells me they weren’t, I wouldn’t say, normal conditions. They had more rain than you but not normal. I guess that just tells me that we’re still going to keep playing, but we also learned our normal standard practices. It’s probably still a benefit if you’ve got that one limiting factor, whatever that is. It’s potassium in their case. He said it was like 130 to 140 parts per million. Spend the money on it. Get the foundation built. Then, you can start to worry about wider operation or extra phosphorus.

MIKE MYERS: It just goes back to that. Every time we plant a seed, it’s got its maximum potential, and as the season goes on, that lowers, lowers and lowers. Well, with potassium, and I’ve thought about this a decent amount, it’s more important than about every of the other major ones earlier. Maybe phosphorus is there, too, but as far as potassium, most of its uptake is V6 to 12-ish. Phosphorus, sulfur and, obviously, nitrogen are all after that. So, which of the four biggest nutrients is going to pull our potential down the most in that first, until V8? Well, it’s probably potassium. So, if we don’t have potassium there, that potential is already capped.

PETER BIXEL: Correct. You can put on as much nitrogen as you want if you think it’s efficient, like you said. After that fact, it doesn’t matter because K has got to be there to move it up in the plant. When you grid sampled and then started doing the strip, I think it’s good, especially with what we’re doing and trying to build the 250 and stuff that we’re doing on the farms and using the management zones. I’m trying to continue to build that. On your beans this year, with new soil sample data, which is not the best year in yields and stuff like that, you were at 144 parts per million of potassium, and you went to 176. Pretty steady increase and a direct correlation. We saw that, yeah, you went from 27 bushels to 57, a 30-bushel acre advantage.

MIKE MYERS: On just a 30 parts per million difference.

PETER BIXEL: Correct. So, I think as we sample some other farms — I don’t think everything got sampled. I can’t remember the majority of stuff, but as we get the new stuff on the rest of the farms, it’ll be interesting to see. That was something I pointed out where, like you said, potassium, and we see this with a lot of clients, at 22 to 26. Not really a huge correlation.

CORN ON CORN FARM DATA

MIKE MYERS: I was really impressed with how I did this fall corn on corn over here, and we vertical tilled at first. Well, we did that, so we could put anhydrous on.

PETER BIXEL: How deep did you do the vertical till?

DALE MEYER: Through May, three to four inches.

PETER BIXEL: How deep was the strip-till in?

MIKE MYERS: About four to five. It can go six, just depends.

PETER BIXEL: That’s why I don’t think our lows aren’t as low. Maybe that’s some of the genetics or fertility, things like that, too.

MIKE MYERS: We’ve mentioned we have more potential on all of our corn going into July, except our corn-on-corn. It’s awful. Yeah, there’s a pond right there.

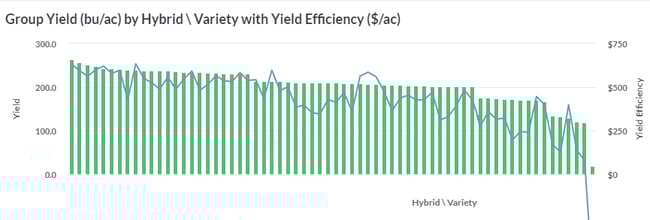
PETER BIXEL: Our corn-on-corn, for the group, averaged 165. Our first-year corn was 190. So, that tells you that we haven’t seen that big of a spread between those two for a lot of years.

DALE MEYER: We’ve not had this consistent-looking crop at harvest time on corn-on-corn ever, that I can remember.

MIKE MYERS: As far as spacing and the beans being there.

DALE MEYER: We had a good growing season, but that all started when it came up.

PETER BIXEL: Well, we didn’t have a lot of wet feet in great conditions, like you said, to come out on soil. You only had nine inches. With the weather Premier grabs, nine inches of rain is all I had. This area is definitely the lowest.

MIKE MYERS: Probably over half of that came before July 1st.

PETER BIXEL: It came before June. He keeps track of some calendars. He’d have every rainfall.

DALE MEYER: The people that run the auction over here at Guthrie Center, what did he tell him?

MIKE MYERS: He was worse yet. What was it?

DALE MEYER: They only had a couple of inches all summer.

MIKE MYERS: We had about an inch, an inch and a quarter in July, and then about the same in June. They didn’t even get an inch in either of them.


Make sure to listen to the Premier Podcast, where everything agronomic is economic. Please subscribe, rate and review this podcast so we can continue to provide the best precision ag and analytic results for you. And to learn more about Premier Crop, visit our blog at premiercrop.com.

Yield Efficiency at a Year-End Grower Meeting with SciMax Solutions

“I think people are really good looking at a 10,000-foot view, but when you dive deeper into the economics and profitability, that’s where the rubber meets the road.”
– Landon Aldinger, Farmer, Iowa Falls, IA

PETER BIXEL: Good afternoon. My name is Peter Bixel with SciMax Solutions, and today we’re north of Iowa Falls and visiting with a client of ours, Landon Aldinger.

LANDON ALDINGER: Hello. This is Landon Aldinger. I farm around the Iowa Falls area with my father Mike Aldinger. I am a fourth-generation farmer in our family. We currently run a row crop operation. We have some beef cattle, some hog operations and also have a sales and consulting business here in town called Precision Farm Management.

KATIE DECKER: Tell me a little bit about how you got started with SciMax and why you started working with Peter.

LANDON ALDINGER: Yeah, so I would have met Peter through my father, who, I believe, the connection point was through Latham, correct? Yeah, Latham Hi-Tech Seeds offered a service that was called seed to soil. My brother-in-law Randy and myself and my dad and my dad’s Latham RSM kind of introduced us. Dad was actively working with SciMax at the time through Latham, like I said, but we’ve kind of grown our relationship together over the years, adding various products.

KATIE DECKER: Do you still farm with your father?

LANDON ALDINGER: Yeah. We have a full corn and soybean farm. We have a few fat cattle here up at my place. We own some hog buildings that we do odds and ends with. And then we have a sales and consulting business, where we sell a full retail line of herbicides, fungicides, insecticides, any crop protection products, and then also sell Latham Hi-Tech Seeds and Wyffels Hybrids.

DSC_2089

KATIE DECKER: Talk through how you guys work together.

LANDON ALDINGER: I call Peter and then he doesn’t call me back. No, I’m just kidding. I’m kidding.

PETER BIXEL: It was that way.

LANDON ALDINGER: No, it’s the other way around, usually. I use all the folks at SciMax to assist in creating that crop plan for the year, obviously. Planning from seed placement, a variable-rate nitrogen piece, our variable-rate seeding rates, just pulling all that data together and maximizing our potential profitability and efficiencies. Then, we get to this time of year, where we’re looking backwards and kind of addressing: “How did we do in analyzing that?” The analytical side is why I enjoy the relationship. It’s easy to go out and just pick corn and say: “I got 200 bushel, or whatever you got, and that’s great.” But what did you do to dictate that outcome?

KATIE DECKER: Do you have an instance of a problem you guys were faced with, and then once you started working with SciMax, how they helped you overcome that?

LANDON ALDINGER: Yes, my grandpa actually owned the fertilizer plant.

PETER BIXEL: They had a fertilizer plant, so their fertility levels were really good. As they’ve been pulling off more yield, it just helps Landon now that we’ve been watching the fertility levels by the yield that they’ve been achieving and just being cognizant of what those levels are and how to address them, using the tools to basically fix or continue to keep them where t

hey’re at. They’ve done a lot of litter. A lot of chicken litter too, as well, to help source a lot of that stuff, and then the hog manure that Landon mentioned. So I’d say just really concentrate on those fertility levels to make sure to keep them up because that’s the thing that I think helped Landon’s grandpa, dad and then him, just having that good base. That foundation has really helped set the operation up for success.

KATIE DECKER: How does SciMax really help you get the most out of the data that you’re collecting?

LANDON ALDINGER: Like I said, I think in any system there isn’t always just one variable for success that you can tweak or fine-tune. It’s taking a part of the entire system, what your manure management practices are, what your fertility levels are that he’s talking about, how you’re placing the seed, where you’re placing the seed at what rates. Same with nitrogen. And I think the ability to dive into each one of those segments of that system and analyze this worked with this other combination but didn’t work so well over here, you almost get a blueprint for going forward. I think, as we’ve seen hybrids evolve or their genetics evolve over time, we can really start to tailor-make it to the hybrids. That’s where I see the biggest focus for me, I guess, being a seed dealer, and I carry that onto my customers, too.

PETER BIXEL: Yeah, I think that’s helped Landon, knowing his hybrids inside and then just kind of putting out the practice on his own acres and then seeing: “Okay, if we push it to 38 or 40,000 or something, does it pay?” Maybe it doesn’t because, again, back to the good fertility, everything else is set. So, now if you change that one variable, did it pay? And he can take that to others to help their operation if they’re similar.

LANDON ALDINGER: Or a combination of variables, too. Sometimes that data gets lost in the noise, and it’s hard to kind of separate it out and see. So, I think their services have helped us that way immensely.

PETER BIXEL: This year has just been a challenge because you don’t have Ethan and Tyson going through, each one of them, individually. Two people at Premier go through it all, and I know they have a lot. They go through each one, verify and then, if there’s a question, they send it to their in-house statistician. Then, they send those out, so it’s been taking like a month to get those reports back.

LANDON ALDINGER: Yeah. Well, there’s a lot of stuff in there.

PETER BIXEL: Yeah, we just did it on population this year. That’s all that we looked at. We had two farms. Leto’s and Bradford, I think, were the two that we did.

KATIE DECKER: Can we talk a little bit more? Just go a little deeper into the decision making. How is Peter helping you make those decisions, both agronomically and economically, on your operation?

LANDON ALDINGER: I come from an angle of the seed perspective, being a seed salesman. I want to know everything I can about every hybrid and where it likes to live and how it likes to operate. We’ve done a lot. I think, probably, the bulk of the work that we’ve done with you is the variable-rate planting populations; that and the nitrogen piece for ourselves and customers. I mean, how many times do I call you and just on random stuff, too?

PETER BIXEL: Well, yeah, it’s not necessarily just about, I mean, from fungicide recommendations to product things. I don’t know. I’m just thinking out loud here, but just anything in general. What do I use in my operation? I’ll tell him what I use, but it doesn’t mean he has to or, by any means, needs to. It’s just good, I think. It’s the same way back from him to me, not just me to him. It’s just a sound barrier or somebody to talk through things with and see if your plan or if your strategy makes sense.

LANDON ALDINGER: I think maybe more than one key aspect of that data-driven decision is just forcing operators to think in those terms: doing trials and setting them up and comparing products. I’m looking at two fungicides right behind you, and we had head-to-heads out there, and we learned. I mean, we’re going to look at the data, but I can look at it just visually and see that there was a difference. I think people are really good at just doing the visual 10,000-foot view, but you really have to dive into it and then start doing the whole, from the economics and the profitability side, which is where it really comes down to rubber meets the road.

KATIE DECKER: Can you tell me a little bit more about the trials that you’ve been doing? You don’t have to give me any specifics on certain products or varieties or anything, but maybe why you decided to do the trial and some things that you’ve learned.

LANDON ALDINGER: I’m just thinking in terms of this last year because we probably had a little bit more, but there’s always the fungicide head-to-head. There are always new products, comparing them to old standards and then running the cost analysis of how they compare versus yield. Standard stuff. Varieties. We do a lot of head-to-head populations within those varieties. At Leto’s, we had the high-yielding stuff.

FBscimaxpeterandlandon

PETER BIXEL: Landon was tissue sampling every week and then, basically, had a plan put together of what to apply and when. It’s different from what he was doing on other acres to see if he could push it or what we’d see.

LANDON ALDINGER: Correct.

KATIE DECKER: What do you think is the value of working with Peter and SciMax, in general? Why would you work with them over a competitor or someone else?

LANDON ALDINGER: Right now, I would put it mainly on trust. We talk, probably, I don’t even know how often but quite often. He’s just a trusted advisor, and I don’t really like that term, but it is. I know I’m getting the honest truth when I call him and he gives me his recommendation. And if it’s something different than what I see, then we try to dive into: “Why are my results different than what your results are?” But I think there’s just a trust factor right now, and that’s why we’ve continued to partner with them for the long term.

Please subscribe, rate and review this podcast so we can continue to provide the best precision ag and analytic results for you.

Benchmark your Farm Data

Telling your customers they’re under-performing isn’t a great business model. Encouraging them to take part in agronomic benchmarking can sometimes have that same effect. Those at the top might enjoy the satisfaction of knowing they are the stars, but how do you gently push the below average customers to step up their game?

The problem with agronomic benchmarking is that the solutions to reaching better numbers aren’t always obvious.

When seed companies tell you the genetic potential of a bag of seed corn is 500 bushel per acre and it starts going downhill once you open the bag, it’s almost implied that they’ve done their part and you are the one who is failing to perform.

Comparing your yields to those in the counties you farm in might be okay unless you farm the poorest soils in each county. Then, you might resent someone who points out the obvious – that your yields are below the average. Comparing your yields to those of others that farm the same soils in your part of the state is better, but being labeled in the bottom quartile isn’t fair if you didn’t get similar rainfall.

Even if both soils and weather are similar, what about rotations? What about the cost of production? Maybe all those higher yields came at a high production cost?

So what are the keys to meaningful agronomic benchmarking? We’d suggest these as a few of the important keys:

  1. Realistically quantify the growing environment to get closer to apple to apples comparisons.
  2. Look longer-term – look for trends over multiple years. Everyone has a great or a bad year once in a while but looking at longer-term trends are more meaningful.
  3. The more depth of data, the more value in the benchmarking. Depth will provide you with more confidence in the comparison as well as more answers.

The best benchmarking services don’t just tell you where you rank – but they tell you why. What does the data say you need to change to perform better or to keep doing to stay on top?

The key is to never stop digging for the answer to “why?” It is easy in all data analysis to have “apples to oranges” comparisons and take data at surface value, but the key to good analysis is to keep digging deeper to get fair comparisons, thus creating the most educated and profitable agronomic decisions.

Visit our blog at www.premiercrop.com for more precision ag information.

New call-to-action

The Importance of Yield Efficiency, Group Data, and Benchmarking

As a farmer, you have so many decisions to make. It ranges from what inputs to use, when, at what rates, to what crops are the most profitable on different fields, to the logistics of how you’ll plant, spray, harvest, till (or not) your fields. Not to mention the management of grain handling and storage and any employees you utilize. You’re looking to build the most profitable business you can that is sustainable year over year.  

Continue reading