In this Premier Podcast episode, we’re talking with Matt Bowers, Premier Crop’s Eastern Strategic Account Manager and Kimberly Beachy, with ProTech Partners in Indiana. Matt and Kimberly discuss the top three examples of agronomics and economics.
MATT BOWERS: I am the Strategic Account Manager for the eastern business unit for Premier Crop Systems, and I recently joined the Premier Crop team earlier this year after working in the seed industry. I grew up in western Ohio on a family farm and currently reside in central Ohio with my family. And today, I’m speaking with Kimberly Beachy from ProTech Partners in Indiana.
KIMBERLY BEACHY: I am an agronomist at ProTech Partners. I work with growers mainly in southern Michigan and northern Indiana. I’ve been with ProTech just over four years and have previous experience in seed production and product stewardship. I grew up on a corn and soybean farm in Newton County, Indiana. Nice, good, black dirt like they have out in Iowa, I found my love of agriculture there. I went to Purdue and got a bachelor’s degree in agronomy and then continued my education at Iowa State. I have a master’s degree in seed technology and business through their online program. I enjoy being outside in my free time. We spend a lot of time outside on the playset with my husband and my daughter.
MATT BOWERS: Good. Well, I don’t have as much black dirt where I’m at in Ohio, but it sounds like a good background of growing up on the farm. Today, Kimber and I are going to discuss examples of “everything agronomic is economic.” And I was wondering if you could start out with telling us how ProTech Partners help their growers focus on the agronomics, as well as the economics.
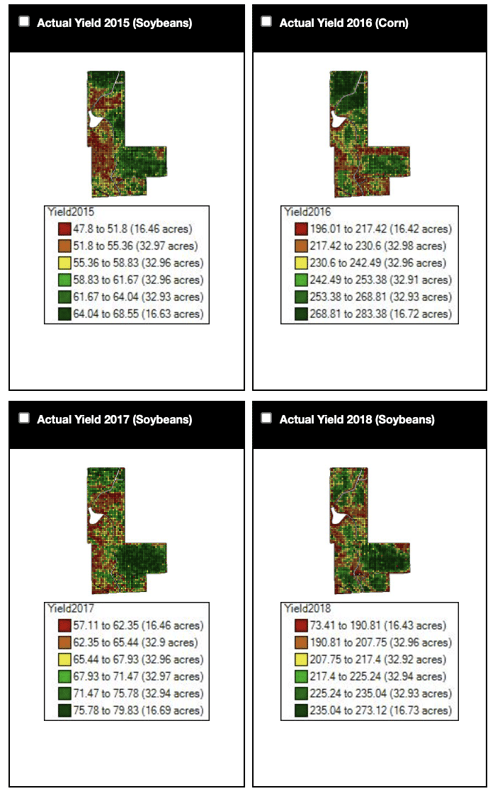
KIMBERLY BEACHY: Let’s first define those two things. What is agronomics? That’s everything that we do in the field that’s making good management decisions. It’s deciding how much fertilizer to apply and where we’re going to put it, planting rates, crop protection, tillage systems and how we incorporate all of this into the farm. All of those things is how we grow our crop. The economics side of it is the money. I mean, farming is a business, and just like any other business, you want to make sure that the money coming in is greater than the money going out so you get to farm again next year. That’s the goal for the farmers that I work with. They just want to do it again next year. So, how does ProTech focus on agronomics and economics? We do that by analyzing their data. And we use that knowledge to help them make decisions on their farm. We’ve been collecting data on the farm for years, not just in spatial data like yield files or with prescription mapping, but through grid sampling. It’s another spatial data collection, and also record-keeping.
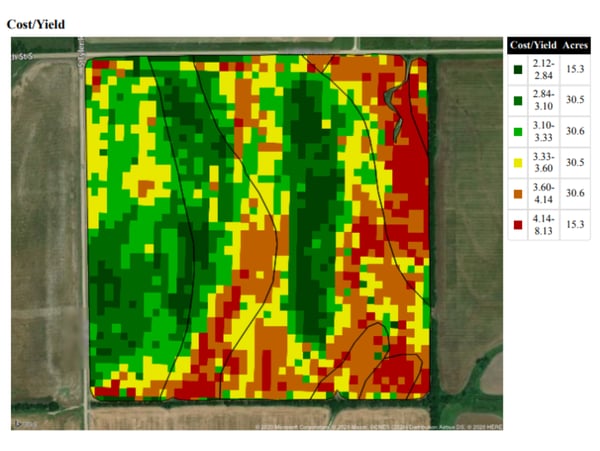
Knowing what we’ve done on the farm in the last five, 10, 15, 20 years can be really valuable knowledge as we plan into the future. But if we never take that data and use it to make decisions, then it’s not doing us any good. It’s important to take the time investment of collecting your farm data and made a return using your data. Our ProTech advisors work with the growers to analyze the farmers field data. We add their costs to the layers of data including their product cost, operations cost, management cost if they have any land-specific cost, and tie that to their yield file so we can really see what is making agronomic and economic sense on the farm. It’s really pretty easy to tell if something yields better, right? You see a bump on your yield monitor, but it’s a lot harder to know if that yield bump also had a little bump in the pocket book. I mean, if it paid for itself or if a decision we made is a cause to the yield bump, maybe we didn’t produce enough bushels to offset the cost. That’s where ProTech can step in and really drive that home, making sure we’re making economic decisions, not just sound agronomic decisions.
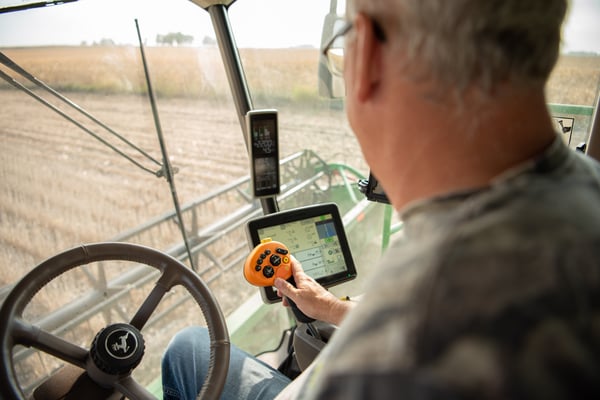
MATT BOWERS: Okay, so we’re not necessarily all about the bright green or dark green, I should say, spot in that yield monitor. We’ve got to see what’s tied behind there and what’s backing that up, right? It sounds like ProTech has a nice program to help growers really look into their farm as a business because that’s what farming is. It’s a business, right?
What I hear you saying, though, is that every pass across the field matters agronomically, but it also has a cost associated with it. And that’s something that we need to manage and look throughout the year. So, can you give me maybe your top three examples of “everything agronomic is economic,” in your opinion, when you’re going out and you’re meeting with your growers?
FIRST EXAMPLE OF AGRONOMICS AND ECONOMICS IS: PLANTING
KIMBERLY BEACHY: I think the best way to look at it and take us through this process is to think of the growing season. I want to touch on planting, fertilizer and also a crop protection fungicide pass. We’ll hit those in the order that they happen. So, first off, let’s talk about planting. That’s when we take the seed out of the bag. It has the highest yield potential that it’s ever going to have.
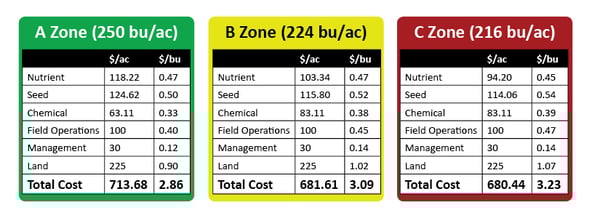
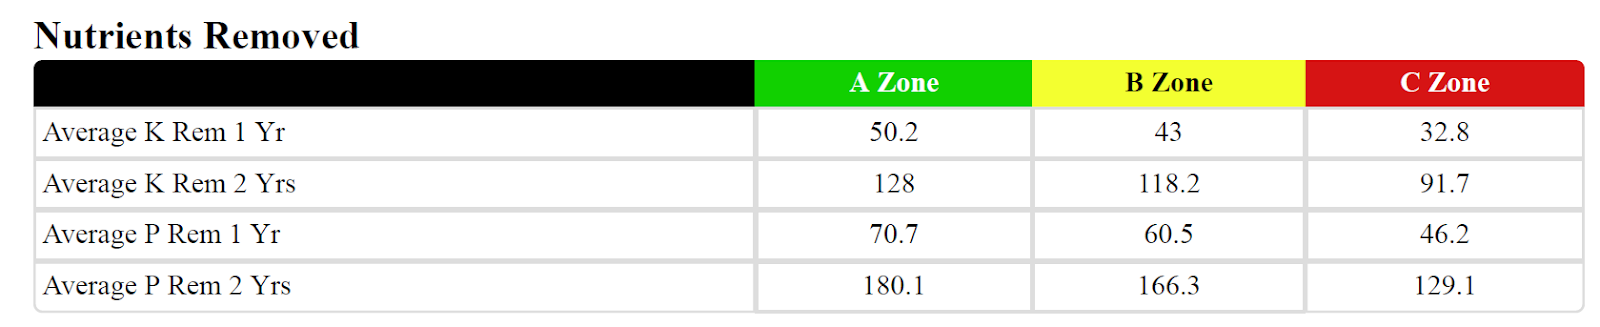
So, everything that we do is to try to protect that yield potential. Planting population is a big part of that. If you overcrowd your plants, you’re going to make them compete for resources, and you’ll reduce your yields because they’re competing with each other. There are not enough nutrients out there and not enough food to feed those plants, but on the flip side, if you have too low of a population, then you’re reducing your yield potential by not having enough out there in the first place. You can’t produce bushels of corn if you never plant the seed to begin with. So, with the planting side of it, tying agronomics to economics is about finding that right rate in the right part of the field, and we do that with management zones. Within ProTech, a management zone is not just a seeding rate like it is in a lot of other places. We truly manage the field and the operation off of those zones. So, we break our fields into high-producing areas, which are A zones, and lower-producing areas that just don’t do as well, maybe it’s a wet spot, or it’s shaded by trees, or there’s a family of deer that lives next door and likes to eat it all the time.
MATT BOWERS: You must be talking about Ohio there, then, because we have the deer spots, and every field is ringed with trees.
KIMBERLY BEACHY: Yep, and that’s why you just have that C zone around the outside of your field, then. But we have those areas, and then the middle, kind of those average-productivity areas, we’ll label as a B. It’s pretty consistent. Year in and year out, it does pretty well, but it doesn’t have the capability to be those rockstar areas of the field, where we’re going to see maybe even 400 bushels on a yield monitor when we go through them. So, we break our field into management zones, and then we manage nearly everything we do based on those zones. So, in an A zone — those are our high-producing areas — we’re going to push our planting populations in those areas. We’re going to plant more seeds because those parts of the fields have the capability to produce more bushels. In the C zones, we’re going to pull back our population because we know those spots, whether it’s animal feeding or shading, or it’s a wet spot or a sand hole, something causes it to not have the yield potential, and it’s something that we can’t fix. If we can get a part of the field from a C zone to a B zone, or a B zone to an A zone, with fertilizer or any management practice, we will do that. Those C zones are C zones because that’s just what they are. That’s the best they can do. So, by labeling it a C zone and understanding that part of the field is not going to produce as well, we can manage our risk there by lowering our planting population. That will save us money on seed cost because, to tie it back to the economics, by lowering our population, we have reduced seed cost, which helps our bottom line.
SECOND EXAMPLE OF AGRONOMICS AND ECONOMICS IS: FERTILIZER
MATT BOWERS: The fertilizer ties along with that, then, if we’re lowering our population where we’re lowering our fertilizer. Maybe we’re not lowering all-over cost, but we’re translocating those to the A zone, right?
KIMBERLY BEACHY: Yes.
MATT BOWERS: And moving those over and spending where our bang for our buck is more beneficial, right?
KIMBERLY BEACHY: Yeah, and I’ve had that conversation with a lot of growers. When variable-rate technologies came out, the discussion was: “Oh, it’s going to save you money. We’re going to reduce your fertilizer usage.” And we found that’s not the case. What we’ve done is we’re better investing that planting dollar or that fertilizer dollar. We’re putting it in the areas of the field where it needs it, where we can get a return on that investment. So, we’re really driving farming into that business idea, where we want to see a return on every dollar we spend. You want to see a return on every dollar you spend. But with farming, in general, if we’re doing a straight rate across the field, we’re treating every acre the same, and we know that that’s not the case. Every acre is not the same because when we drive through the field, even if you don’t use a yield monitor, you can see variation in the amount of loads you’re taking off. I mean, you can tell how good the corn is or how bad it is as you’re driving across the field. So, why would we treat that the same on our input side if we’re not taking the same amount off of it at the end of the day? And that’s how variable-rate technology lets us do that. And that’s why it’s so important to tie it into not just planting but also into your fertilizer, and that’s how we really do tie the agronomics to the economics in agriculture.
MATT BOWERS: So, your second reason — you’ve kind of got into that there because you’re tying it with the population, with your fertilizer and variable rate and our fertilizer rates, as well. Is that also — for you, with your growers — is that also with nitrogen in how you handle nitrogen?
KIMBERLY BEACHY: Yes. I started talking about it because it all ties together. I mean, that planting population decides a lot, and you do need to factor in your planting population when you’re determining your nitrogen rates. And I know Dan Frieberg uses this example a lot. If you invite more plants to dinner, you have to have enough food to feed them. So, if we have a higher population in our A zones, we need to account for the added food that they’re going to need, the added nutrients and dry fertilizer and nitrogen, especially. We need to increase that nitrogen rate in those A zones. And I think we can also push the nitrogen rates a little higher in the A zones because we have the capability to produce more bushels, not just because of the higher population but just because the ground is better. By pushing that, yes, you’re taking a little bit more risk, but it’s a smart risk. By pushing your nitrogen rates in your A zones, you have a better opportunity to have a return on that nitrogen dollar than you would if you were pushing nitrogen rates in your C zones. So, that’s really how we focus on it. It’s looking at our nitrogen, how our nitrogen is used in the field. We could go out and apply at a straight rate, but we’re going to be overfeeding our poor-production areas and underfeeding our high-production areas. Really, if we feed to the average, then we’re missing out on high-end yields, and we’re overspending on those low-end yields.
THIRD EXAMPLE OF AGRONOMICS AND ECONOMICS IS: CROP PROTECTION OR FUNGICIDE
MATT BOWERS: Great. Now, you had mentioned fungicide passes and looking at fungicides. And I know you and I have had some conversations based around fungicides and timing in years and how the weather is that year and what stage the corn or the soybeans are at. So, why don’t you touch on a little bit of that, as far as electing that pass and the cost and the benefits of what that would be.
KIMBERLY BEACHY: And I have a great example of that from this year. Where I’m at in northern Indiana and southern Michigan, we’re kind of in that epicenter of tar spot. It started here a few years ago. We’ve had really high infection rates in fields the last couple of years, and we can really see the value of fungicide. But we have to make sure we’re spending that money wisely, that we have to look at the year. So, to have a disease infect — I mean, in college, we learn about the disease triangle or, in a plant pathology class, you learn about the disease triangle — you have to have the host and the pathogen. Up here, we have that. We have corn, and we have tar spot. We have that pathogen, but what we don’t always have is the right environment. There are instances where applying just a plant fungicide pass is the right way to go. And I had plant fungicide passes in my high-production corn, especially with the high-production fields that are irrigated, because they’re going to have more leaf wetness from that irrigation water.
But where it’s a little harder to make those calls is on your tougher acre. I have a grower that has some high-production irrigated fields that his yields can be, I mean, phenomenal, averaging 250 or higher across the field. But he also has some ground where, if it doesn’t rain, he’s going to be happy to hit 100-150 bushels per acre because it’s really sandy, dry soil. And those are the acres that you don’t always think about as being important when it comes financially. But if you’re not making as much money off of it, then you can’t treat it. You can’t spend as much money on it, either. So, for the tar spot this year, one of those tougher fields that he has was planted at the end of May, beginning of June. When I did my last fungicide check on it, when I did my last scouting trip, it was the end of July, beginning of August. We didn’t have any disease out there. We, the grower and I, were looking at what’s in the field and looking at the weather that we had up to that point. It’d been a dry summer. It’d been kind of hot, so he’d already lost some yield potential there. And then, looking at the forecast, it was supposed to be hot and dry, so we weren’t going to have the conditions that were necessary for tar spot to really take off. So, we decided that it wasn’t economical to make that fungicide pass.
Well, fast forward a few weeks, he sent me a picture from a leaf in that field, and it had tar spot on it. And the weather changed, and it got a little cooler. It was rainier. We had some leaf wetness, extended periods of leaf wetness in that field, and the tar spot that was in the area took off on his corn. But at that point, it was too late in the season to make a fungicide application. So, that’s where, working with an advisor, it’s not just thinking about the agronomics. If I was just thinking about selling a product, I would say: “Yes, spray the fungicide.” If I was just thinking about what’s best for that corn, yeah, the fungicide is good, but we have to also think about what’s best for that farmer and what’s best for that farm as a business. And that’s where, this year, that fungicide application just didn’t make sense. And yes, we did have the disease come in, but we’re going to manage. Now we know that it’s in the field because tar spot does live in the residue. The spores can overwinter in the crop residues, so we know what we have to do to manage that for future seasons.
MATT BOWERS: And because it came in so late. And, yes, it was there, but economically, even if you sprayed at that time, you probably weren’t going to see the benefits of what you usually would, had that infection come in earlier in the season when that plant wasn’t already headed to maturity, right?
KIMBERLY BEACHY: Yes.
ANALYTICS HELP WITH AGRONOMICS AND ECONOMICS
MATT BOWERS: Looking at these examples, why are analytics so important to dive into once we’ve finished out the year? The combines run through. We’ve got some results coming in. Tell me about that.
KIMBERLY BEACHY: Analytics is how we look at that data. We pull your yield monitor data off. We look at everything you’ve done through the year, whether it’s fertilizer, lime, your planting, any other nutrients you put down or crop protection products. And we really dig in and see what the economic benefit was of that, if you had check blocks out there. For planting, built right into my planting maps, I’ll put in little test plots for the grower. It’s built right into the prescription, called a learning block. And we use that information to check higher and lower populations within a management zone to see if we have the right rate. Because yeah, I can go out and I can tell you: “Yep, you need to plant 35,000 under the pivot, and that’s what you’re going to do, and I’m right because I’m right.” But we need to prove that we’re right. And we need to prove that what we’re doing is the best thing that we can do, and there’s a lot that goes into agriculture. I mean, weather is a huge factor, and we can’t control everything.
Even if you are pretty locked in on what that population is, having different checks in a field through different years, you can use that historical data, then, to check and say: “Yeah, in this year, if we’re looking at a cold, wet spring, this is the best population for me to go with.” And we can learn that and look back on that data. Even if we don’t use it the next year, we still have that historical information. The nice thing about the learning blocks is it’s not just going to tell us what yielded better. I mean, it will tell us what had a better yield, the high or the low population, but it’s also going to tell us which one had a better return on the investment. So, did we produce enough bushels with a higher population to offset the added seed cost? We can find that out. Really, on our end, it does take some work, but it’s a lot easier than piecing through all of your data and trying to do it on your own.
MATT BOWERS: So, with that in mind, growers are busy. They are going from one thing to the next, and there’s always something to do, right? With analytics, sometimes, going through the data and sifting through it can be a headache and something that is so tedious that they’ve got better things to spend their time on out on the farm. So, is that something that ProTech Partners and yourself, that you guys can help manage and pull out the things that the farmer needs?
KIMBERLY BEACHY: We go get the data. We clean it up. We put it in the system. They just need to hit “record” when they’re running through the field and let us know what they’re doing, as far as the grower responsibilities. And then, I ask my growers. I have an idea of what I want to show them at the end of the year, once I’ve analyzed their data, but I want to know what they want to learn from it, too. So, I ask them throughout the season: “What do you want to learn? What questions do you have?” Because we have the tools within our system to ask any question we want, really. Any question that we ask we can find an answer to. It’s not just about figuring out what I think is best or my decision about: “Well, I think this is what we should do. I think this is the best option going forward.” That’s part of it, but there’s also teamwork with their grower there to decide what’s important to the grower. And they tell me what’s important to them, and then the best part is I go find the answers for them. And I come back with a nice, little, concise report and show it to them, and then we chat and make decisions from there.
MATT BOWERS: That sounds great. Yeah, not every operation is the same. Not every operation has the same goals. Everybody thinks everybody is after max bushels, and that’s not always the case. It depends on the grower, right? So, if you could take and tie this all in a bow and explain how it all comes together for planning for next year, how does that look?
KIMBERLY BEACHY: We start planning for the next year’s crop. We’re already doing that. As we start seeing harvest data, we’ve already taken and put all of the other activities from the year into our system. So, once we get that yield file, we’re able to get it entered and go and really start help driving decisions. How we do that, it comes down to what the grower wants to know. I’ll look at things — soil fertility — and make sure that we’re doing the right thing with our fertilizer because that’s a big part of my responsibility with my customers. It’s giving them fertilizer recommendations, giving them seeding recommendations. So, those are the questions I’m really making sure I want to answer, to prove that I have been doing a good job. And if I haven’t, if I didn’t have the best rate, well, what’s the best rate going forward for next year, so we can make changes into our crop plan for 2020?
It’s a “do it and check it” process. We go out and do something, and we check our work, and then we make corrections for the following year. And we try new things if we have something out there. As an example, I have a low-productivity field. One of those ones on the sand that didn’t yield 100 bushels this year on it because it was tough ground. It’s like a beach. And we had some low, what I felt was pretty low, populations. I mean, the field average was right around a 20,000 planting population. I put some learning blocks in there for checks down to 16,000, but I want to take that a step further next year. Just by being in the field and looking at the crop, I could tell that we were over. Our population was too high for a dry year. So, what can we do? We’ll lower it a little bit on our prescription next year, but we can then add in more learning blocks to test it even lower. And depending on how crazy the grower wants to get, we’ll maybe test the limits of his planter and see how low he can go.
MATT BOWERS: Right.
KIMBERLY BEACHY: Because that learning block is a small area. It’s a small area too, and it’s built right in. So, they just have to okay it on the front end when I create the map. Once that prescription is in their monitor, they just have to go. It’s very little thinking on their part, but we’re constantly checking our work. ProTech is different in the fact that our agronomists — we go in the fields. Most of our ProTech programs include scouting, so the agronomists are the ones going out in the fields doing the scouting. We’re also doing the soil sampling, creating the recommendations. And we’re not just seeing what’s happening on paper or on the computer screen. We’re out there living it in the field with the crop. And we do take pride in being able to check that for the grower. ProTech is different from other precision ag companies because we truly manage by our management zones.
It’s not just a seeding rate. So, when I talked earlier about how we tie our planting rates to our nitrogen rates, we’re also doing that with our dry fertilizer. We manage our dry fertilizer based off of those management zones, as well. We’re pushing fertilizer rates in the A zone, maybe looking for higher soil-test levels, reaching for higher soil-test levels. But in the C zones, where we’re not going to produce as many bushels, we don’t need as much. We don’t have as much crop removal, so we don’t need as much fertilizer in general. And that’s one of the things that sets us apart. We don’t just go out there and make a recommendation based on a country’s worth of knowledge. ProTech believes that agronomy is local. And what we do here in Indiana and Michigan is a lot different than what guys do in Iowa. I mean, go further out west into Nebraska and Kansas, where there are different crops, different amounts of irrigation, different soil types. We do what’s best for our growers here because that’s what’s best for our growers, and we know that based on our experience in the field, in this area.
MATT BOWERS: So Kimberly, what I hear you saying about ProTech is that you guys work on a sub-acre level. You’re not just looking at an entire farm’s collective yield data and results at the end of the year, or even just that field, but you’re looking at the results in each management zone that you guys set up. Is that what I heard you say?
KIMBERLY BEACHY: Yes, that’s correct. When we really dig into the data, we’re not looking at it by the home field versus the back 40. We look at the A zones across those two fields or across the fields on the whole operation and compare those A zones. And we also compare the B zones. And then we compare the C zones because we want to do apples-to-apples comparisons. And if you’re comparing a whole field against another whole field, there could be differences. One could have irrigation. Soil types could be drastically different. Then you’re not comparing apples to apples. So, by looking at it, by comparing those management zones to each other within a field, you really can narrow in on what is best for those particular acres.
MATT BOWERS: Great. Well, Kimberly, we’ve had some great information that you’ve provided us today. Hopefully, the growers have some good questions that they might be asking themselves about their own operation. And if they wanted to contact ProTech Partners or yourself for help with answering some of those questions that they might have and get in touch with you, how and where can they find you and get ahold of you?
KIMBERLY BEACHY: Well, I am on Twitter @Kimberly_Beachy, but I’m not very active. So, it’s probably easier to get ahold of me by email. That is kbeachy@frickservices.com. And then if you want to learn more about ProTech, you can follow us on Facebook and Twitter. Our Twitter handle is @ProTechAgronomy, and we have a website at protechpartners.net.
MATT BOWERS: Great. Well, thanks, Kimberly, and thanks, everyone out there, for listening. And, as always, remember to be safe out there and make it home tonight.
Thanks for listening to the Premier Podcast, where everything agronomic is economic. Please subscribe, rate and review this podcast so we can continue to provide the best precision ag and analytic results for you. And to learn more about Premier Crop, visit our blog at premiercrop.com.

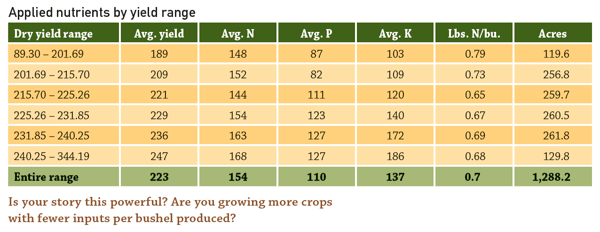
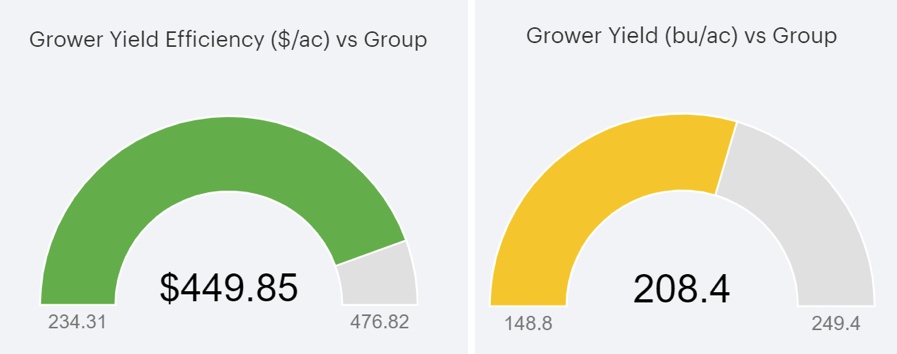
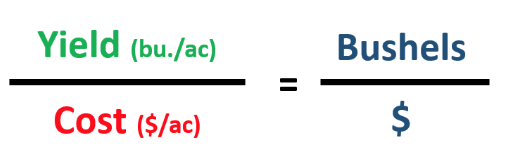
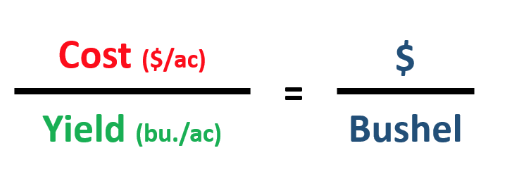
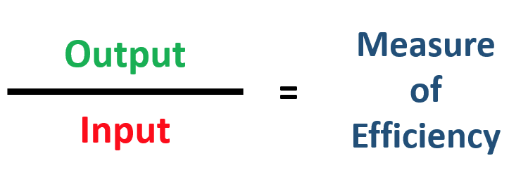 Here’s an everyday example of efficiency. My pickup’s gas tank holds 24 gallons and I can drive about 440 miles on one tank. My wife’s car has a gas tank capacity of 14 gallons, which gets her almost 480 miles of driving. One tank of gas in each vehicle results in only 40 miles difference in total output or miles traveled. However, when calculating efficiency these values equate to her vehicle being roughly twice as efficient as mine. If the capabilities (towing, hauling, etc.) of our two vehicles were the same it wouldn’t make sense to drive my pickup because the input expense is almost twice as much to return roughly the same output. This thought process can, and should, be applied to crop production.
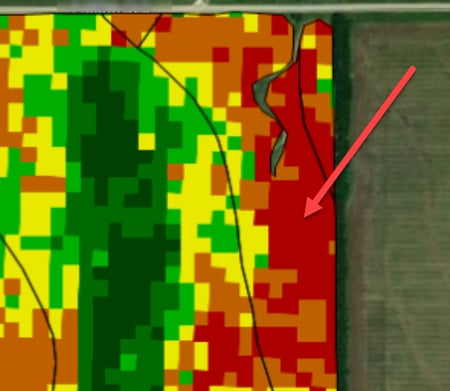
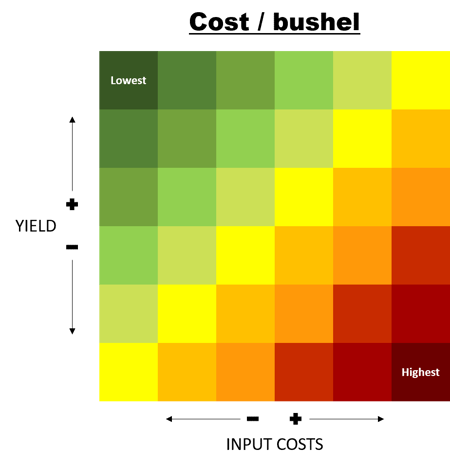 Understanding and managing variability within each field is key to improving efficiency (