Why You Need Farm Analytics Software

We can all probably think of a product, service, or brand we feel biased towards. Then think about how you make decisions on your farming operation. Do you have any bias on how different fields respond to a certain seed, fertilizer, or crop protection product? Allowing your bias to persuade field decisions can be very costly and frustrating. Your knowledge of your own farm is invaluable. Using farm analytics can enhance your decision making by removing or challenging the bias with objective analysis.

I am guilty myself. It is easy to make assumptions and decisions based on previous experiences. However, using Premier Crop’s analytics platform, you can begin to dissect the different yield environments on your fields.

WHERE TO START? 

You can start anywhere. Do you have computers or hard-drives full of unused files or binders full of printed maps? Organizing and analyzing this data, and using it to make more informed decisions could be the biggest ROI on your farm.  You don’t have to be an expert on computers or an IT wizard, all you need is a trusted partner to help take the complexity out of your data so you can validate or challenge your own assumptions in order to optimize profit. Looking to read further about how to start using the data you’ve already collected? Download our Five Steps to Get Started Guide.

WHAT ABOUT MY AGRONOMIC ADVISOR?

A traditional field agronomist who is providing scouting services and making product recommendations is still a valuable resource for your operation. The difference between an Agronomist and a Precision Ag Specialist is that an Agronomist has years of experience scouting for and monitoring the physical characteristics of your fields. A Precision Ag Specialist can take those physical characteristics and visualize them over your field and compare them to see how ALL of the layers are working together.  When you combine the two with a powerful farm analytics platform, you can really increase your return on investment!

I once had an experience working with a grower and his agronomist reviewing yield maps and grid sample data. During the discussion, the agronomist looked at me and said “You know, I have been scouting these fields for 20 years, and in one hour, you have just identified many of the key issues I have spent years identifying by presenting his data in an organized fashion and bringing these data layers together.”

DOES PRECISION AG PAY?

At Premier Crop we focus heavily on PROVING what you’re doing on your farm. We frequently encounter a situation where a grower has been frustrated with precision ag in the past. Their frustrations come from the fact that there is not a good analysis of the precision practices being  implemented. One example we commonly see, and have proven, is a $100/acre swing in profit by increasing yield and saving seed with variable rate seeding, simply by optimizing the seeding rate to unique areas of the field. The dollars that are left on the table can be shocking if you’re not implementing VR Seed and VR fertility practices, AND verifying “it works” by marrying your agronomics to the economics.

BRING IT ALL TOGETHER

Implementing a farm management system that organizes your most important farm information in one place can be eye-opening at first. You might be surprised that your original biases, thoughts, and intuitions may not have been as “true” as you thought. Premier Crop Systems simplifies and visualizes where to best spend your input dollar and how it can improve profits across all of your acres. We use Yield Efficiency to determine much is left to pay land and management after your costs are subtracted from total revenue.  Below you will see our Yield Efficiency by field across your farm. With this metric, we help growers determine which fields are making the most money.

Premier Crop Systems is proud to be the leading farm analytics platform since 1999. We continue to advance and improve alongside our partners and growers on a daily basis. Together, we help you gain more insight into your operation for confident and profitable decision making. Let us come alongside you to reduce the complexity and add another dimension so you can exceed your own expectations. Contact us now to schedule an information meeting.

Why do you need to start using farm analytics software? Here’s 4 reasons:

  1. Fully utilize the data you’ve already collected and use it to make decisions
  2. Take advantage of the benefits of having a team of agronomic professionals working together for your operation
  3. Optimize seeding, nutrient, and fertilizer rates to see swings in profitability and savings per acre
  4. Become confident in your decision making while reducing the complexity of data

    New call-to-action

5 Surprising Things About Ag Technology

Do you remember the 90s? I was an elementary student, probably about 7 when my parents bought our first computer. I remember listening to the dial up tone to get on the internet and play the math video games that my mom had found. I also remember the incessant pop ups that also came with 90s internet. Sometimes, that’s how I feel about precision ag these days. There are a lot of pop ups that are flashy and use all the right buzz words wanting you to ‘pick me, pick me, pick me.’ However, there are several things about precision ag that these companies often leave out of their messaging that can be surprising. 5 of those things that can often surprise people are:

  1. There are no magic algorithms
  2. Achieving higher yields isn’t the best way to measure success
  3. You don’t need to be a data scientist or technology expert to use your data and equipment to its full ability
  4. Hiring an advisor you trust will help you become a more efficient and profitable farmer
  5. You’ve never learned it all

iStock-1264516942-1

THERE ARE NO MAGIC ALGORITHMS

There is no such thing as a perfect magic algorithm. Finding the right product placement, rate, or timing is a constant trialing and evaluation cycle. It doesn’t have to be a headache of a process, though. A lot of our machines have rate control capability and trials that can be loaded right into the controller. At Premier Crop, we can automate these trials through what we call Enhanced Learning Blocks. These are randomized and replicated trials that will tell your machine to change rate, turn off, turn on, switch product, and whatever we want to test. Combining the data from the trial itself with weather data, soil samples, and applied fertility, we can start to gather what kind of agronomic environment this trial could be replicated on. They can also be aggregated to allow us to create response curves for products so we don’t question what that perfect rate might be.

ACHIEVING HIGHER YIELDS ISN’T THE BEST WAY TO MEASURE SUCCESS

As we gain better knowledge of product placement, rates, and timing, it is important to ask how we know when we have found success. Higher yield? That’s what many precision ag companies want us to believe. We can circle and map and see if it got us higher yield, but that’s only half of the picture. Agronomics are always important, but our decisions must also be advantageous to our pocketbook.

For example, let’s say this year I ran a potash trial on my field. In this trial, I had 3 different rates across an area of my field that has 280 ppm soil test K values. The rates we ran were 150 units of K, 200 units of K, and 250 units of K. That translates to 250 lbs of potash, 333 lbs of potash, and 417 lbs of potash, respectively. Our yield responses were then 225 bu, 248 bu, and 251 bu, respectively.

We continued to see an increase in each application, but do they all make sense economically for us? Let’s say that potash is $400/ton, application is $8/ac, and we sell our corn for $5/bu. Which is the best rate in these economic conditions? When we increased our potash from 250 to 333, we gained an additional revenue of +$90.33/ac. However, continuing to go from 333 lbs to 417 lbs, only increased our yield by an additional 3 bushels, we actually lost -$9.67/ac. Yield is only part of the picture, we need to take economics into account, too, especially as we move into a fall with extremely high fertilizer prices. Being confident in the input decisions we make eliminates the emotion that comes with seeing prices rise so fast.

Nutrient Efficiency-01-01-01

YOU DON’T NEED TO BE A DATA SCIENTIST OR TECHNOLOGY EXPERT TO USE YOUR DATA AND EQUIPMENT TO ITS FULL ABILITY

That was a lot of math we worked through in the last point for only one input decision. But, with the right technology and advisor working alongside you, you don’t need to be a math, tech, or data guru to make these decisions every single day. It’s important for you and your advisor to sit down and decide what your goals are moving into the next crop year. From there, determine what you could trial for the coming year. Question whether or not you can still push your fertility and see a return. Or consider backing down your seed in lower productivity areas without sacrificing yield. Perhaps you want to know if that starter rate you’ve been using is doing your crop any good.

HIRING AN ADVISOR YOU TRUST WILL HELP YOU BECOME A MORE EFFICIENT AND PROFITABLE FARMER

Having a trusted advisor help you along the way is a huge asset to your farm operation. Agronomy is complex, but using a software that can combine agronomic factors and delve into the relationships happening in your fields through trialing, customized rec equations for different parts of your field, or visuals of your economic and agronomic data married together can take your operation to the next level. Also, having an advisor that isn’t tied to certain products can increase your level of trust, because their number one goal is to make you a better farmer. Going forward, you’re going to want to have a data partner you can rely on to provide confident, unbiased advice in order for you to achieve higher profitability.

YOU’VE NEVER LEARNED IT ALL

The last surprising thing a lot of people don’t realize when they jump into the precision ag world is that there is never going to be a time we have all the answers. I had a grower last winter ask me, “I can see the immediate benefit of doing business with you but what is my long-term gain?” That is such a great question because it allowed us time to talk about expectations. For years, our founder Dan Frieberg has talked about the rain barrel, and finding the lowest stave that may be hindering your yield. But we often forget that once we have raised that stave, another becomes the lowest. This is a continuous process that we work on with you. There is always some way to improve yield, ROI, or efficiency. We are here to help you find it. Contact us today to get started.

farm efficiency

Use Agronomic and Economic Data to Make Management Decisions

At this time of the year, it’s easy to feel like yields are largely a function of weather – temperature and rainfall. Over the years in hundreds of grower meetings, I’ve heard that sentiment repeatedly. If you are inclined to think that way, think about this scenario.

Imagine a flat 160-acre field in your area, farmed by the same grower for 30 years, is going to be auctioned to the highest bidder. The field is unique in that it is all one soil type ( I know there is no such field in most areas – but we’re pretending so please play along). Pushing for the highest value, the auctioneer splits the field into two side-by-side 80 acre tracts – selling the field fast as two 80’s and then as 160.

The price received as two 80’s is higher, so the next year two different growers farm each of the 80’s. The entire field was soybeans the year before, so both growers planted corn in the first year farming their new purchase. Both will receive the same growing degree units and virtually the exact same rainfall. So, how much yield difference could there be between each of these two 80’s the following harvest?

Screen Shot 2021-08-05 at 2.24.22 PM

Over the years, I’ve used this example with growers in small group meetings and usually the answer is in the 40-50 bushel per acre range – sometimes as high as 75-80 bushels per acre difference!

How can there be that much difference? Simple. It’s because management matters. Our goal at Premier Crop is to encourage you to use your agronomic and economic data to make better management decisions.  With over 20 crop years in the books, we’ve seen it over and over again – similar soils and weather but dramatic differences in results. Usually, it’s not one decision, but the combination of multiple decisions.

Yield by Variety by Soil type-01

When it comes to hybrid and variety selection, it’s common to find 20-30 bushels per acre differences on the same soil type and same weather events. A starting place is to look at your own hybrid and variety performance data by soils – both at a field level and across your entire operation. Your data can be a guide for not only making next year’s hybrid and variety selections, but also where to place specific genetics. The more data you collect, the more you can make data driven decisions. Applied fertility rates, planting dates, planter performance, trait packages, soil test levels, planting populations are examples of some of the critical agronomic decisions you make every year. You might be able to hold Mother Nature accountable for the first 50% or even 75% of your yield results, but the other half (or less) and all the profit is your responsibility.

Farm Analytics Show Valuable Insights

I was meeting with a grower who asked the question, ‘Is the direction of Premier Crop going from a prescription company to an analytics company?’ My answer was: ‘Premier Crop has always been about analytics. We are not only a company known for analytics, but what to do with the information that is received within the data, in those analytics.

I could kill you with paperwork. But really, it’s about the reports and insights that I can take to be able to help growers make better decisions. The report I’m walking through today is our Management Zone Report. This report is almost like a report card for a grower because it showcases the cost per acre in each of the management zones. In this report, you’ll see that we’ve invested more dollars per acre for nutrients and seed. The chemical costs, operations costs, management and land are going to be flat rates, or they’re equal across each of these zones. When we get down to the very bottom of this report, we can see that we’ve invested $48 more in our A zone, our best parts of the field, than in our C zone. When we look at that break-even cost per bushel, or the amount it costs us to produce a bushel of corn, it’s $0.86 cents less in our A zone compared to our C zone, even though we spent more money to produce it. It’s amazing to actually be able to use this report to illustrate to a grower that variable rate does pay.

Let’s do the math on this report. If we’re yielding 200.2 bu/ac bushels in the A zone, and I’m using a selling price of $4.50 for corn, that would bring us to $900.90 of revenue per acre. If we take out our cost per acre of $717.57, that’s going to be $183.33 profit in that A zone versus our C zone yielding 150.9 bu/acre and revenue of $679.05, which is $9.64 revenue per acre. That’s $173.69 more per acre in your A zone.

Katie Farm Analytics Blog-01-2

Now, we an produce reports and pretty graphs, but it’s so much more than that. I’ve always laughed and thought: What other business takes a look at a pretty map or graph and says, “That’s really neat!” and puts it in a 3-ring notebook in their office without doing anything about it? This is where the agronomic advisor should come in, take that data and ask, “What can I do with this?”

Another part of this Management Zone report shows the soil test attributes, applied, and removed nutrients in each of these zones. As an advisor, I can very quickly look and see what the average applied nutrients were in these zones and the actual nutrients that were removed within these zones. With so many inputs (P, K, Seed, etc.) being variable rated, it helps me to get the complete picture and help growers make sense of what happened in their fields and how we can improve next year.

As we’re going into the fall with these fertilizer inputs — and, actually, all inputs — being what they are, growers are going to be concerned. I’ve been telling people for the last month, my worry is that when farmers get shown these prices, they could make some emotional decisions. In fact, those emotional decisions. In fact, those emotional decisions of cutting across every acre could be cutting profitability in the areas where they could be returning the most.

So the question is: how can we take this information to make a better recommendation or a better prescription for next year’s crop.

First, we have to figure out what we actually have control over. There’s so much in the data world and there are certain things we don’t have control over. So, let’s look at the things that we can help growers with. I’m not saying to starve out any area, but instead, reallocate. What does the grower’s pocket book look like for a given field? I chuckle when growers tell me that their yield goals are the same across every field. If you treat every field the same, you can’t tell me that yield goals or, on the flip side, removals, are the same on every field. We’re talking about removals spatially, with that yield file. That’s a huge variance.

When you’re in the combine, and you’re watching the monitor, you see those high areas of the field. Well, those high areas of the field are removing a lot more nutrients than when that monitor hits those red areas on the map. That means if there’s a big difference in yield, there’s a big difference in removals.

iStock-1180642027

Using that removal file as part of a grower’s nutrient plan or recommendation is going to be really big this coming year, in addition to establishing the goal for that field moving forward for this following year. What kind of a goal are we going to have based on input prices? I sent an email to one of my growers last week, and said: ‘We really need to talk in the next 10 days. If prices are going to remain as they are, what are you thinking for fall fertilizer?’ We’re going to need to put some on, what does it look like if prices stay this way? Then, how do we pivot as we move into harvest season and that sort of thing in order to prevent those emotional decisions? Growers with a plan don’t make emotional decisions. They’re a lot more confident and a lot calmer in fall and harvest time.

I share all of this to prove to you that variable rate clearly pays. So, what if you were to flat-rate this whole field? What would this look like? I mean, you would clearly be losing your money in the C zone, more than if you’re over-applying your nutrients. There’s a clear reason that these reports show that the profitability of variable-rate pays. Using something like Premier Crop and looking at the farm analytics is highly beneficial. If you are only using yield as your measure of success, you really don’t know how much money there is out there that you’re missing out on.

crop management

013: Nutrient Planning

anhydrous ammonia

Today we are talking with Dan and Darren about nutrient planning and its importance during this part of the growing season.

If you are enjoying the show, tweet us using #PremierPodcast.

DARREN FEHR: Good morning, Dan. We’ve done a number of these already, so we’re kind of cooking here in this podcast world. I want to talk this morning about nutrient planning. So, let’s start off this morning, Dan, by going through the process that our advisors have undertaken for several years. What is their approach to nutrient planning? You can talk about nitrogen separately from phosphorus potassium, but give our listeners a little bit of an overview of the nutrient planning process.

DAN FRIEBERG: 2021 nutrient planning is one of the first things that’s tackled because a lot of advisors want to get ahead of the curve. They want to be able to have had that planning discussion with growers before they get in the combine. Growers start identifying which fields go into what crop, and then the next piece is usually addressing nutrient planning. There are parts of the Midwest that really have drought. There’s a big chunk that’s also going to have wind damage where they might not harvest a crop. Those are additional considerations, but, for us, nutrient planning, especially in the fall, a lot surrounds phosphorus and potassium, and those are two of the three major nutrients.

Sulfur’s probably the other one that’s really become the fourth major nutrient. Sulfur and nitrogen are mobile nutrients, so there is some fall application in heavier soils. But, certainly, phosphorus and potassium would, a lot of times, be the first nutrients to hit the field. The approach depends on what kind of a crop you’re removing. But, certainly, a big piece of what we do is we use some type of spatial soil sample as one of the foundation pieces. A spatial soil sample can be a grid sample, where the field is divided into smaller sizes, and you have a lot of samples within a field. Two-and-a-half-acre grids are really, really common in a lot of areas.

In other areas, zone sampling might be more common where they divide the field into zones, and those zones could be driven by soils or historic imagery or EC conductivity. But the big thing is, a lot of times, instead of capturing one sample for an entire field, they’re capturing a lot more intense or site-specific samples.

DARREN FEHR: Let’s just start here, when our advisors are working through nutrient planning at this time of year. Pre-harvest, is the removal estimate based on estimated yield? How are we going about creating that first draft, if you will, of the nutrient plan?

DAN FRIEBERG: What feeds the crop is a combination of soil-supplied nutrients. This means there are nutrients in the soil that get released, and there’s fertilizer, or manure-supplied nutrients. So, what we’re trying to do is balance what the soil supplied versus what we supply with either manure or commercial fertilizer. If you think of low-testing areas, they should be more responsive to applied nutrients. This meaning you should get a bigger yield response in a lower-testing area than you do a higher-testing area.

Another piece of what we do is use yield files to actually capture the removals, and sometimes that’s last year’s yield file. It could be two years of yield removal if you’re on a two-year cycle. It could be just one year of yield removal. And for some people, literally, because we’re getting yield faster and faster, it can be this year’s yield file. Meaning, because we’re capturing yields every second, we’re able to calculate the phosphorus and potassium removal off that yield file. So, two of the major pieces would be using some type of spatial soil sample, and then using a yield file to not guess at removals but to calculate actual removals.

DARREN FEHR: I think there are nutrient prescriptions made on many millions of acres here in the Midwest and across Canada. What are some common mistakes that are made, or what are some things that growers should make sure went into their nutrient plan? You mentioned a couple: some type of a grid sample, some kind of a soil measurement to understand where we are, and the other one is attributing a yield file to overlay an understanding of productivity. What else is necessary that growers should ensure that their trusted advisor is including in their nutrient plan?

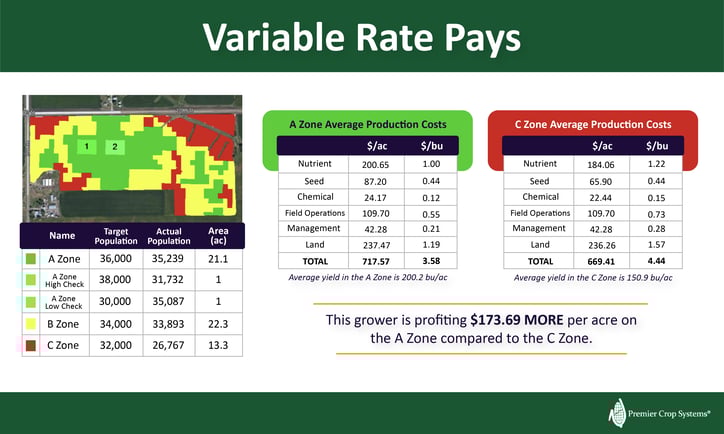
DAN FRIEBERG: Darren, we spend a lot of time on dividing fields by productivity level. We’re able to define is that there are some areas of the field that just respond to more nutrients. What we tend to do is have a different equation for each productivity area within a field. For some people, they go to the grower with three different equations, and it could be color coded or metal. However they describe them, they go to the grower with three different equations and prices by each equation for nutrients, and they say: “Pick between these three.” We’re like: “No, you can run three or four equations inside a field.” You don’t have to choose aggressive versus conservative for the whole field. You can treat parts of the field really aggressively and parts of the field really conservatively.

This is just all math. Having more complex equations is a big part of what we do. It really goes to just this idea. I mean, if you think about nutrients, in general, across the country and across entire countries, we tend to have recommendations that are a little bit “one size fits all.” What we’re able to prove is that the ideal combination of soil-supplied, which is what we measure through a soil test, and fertilizer, or manure-supplied, changes within field boundaries. It makes sense to us that some areas of the field just respond more to nutrients than other areas of the field, and we want to take advantage of that.

DARREN FEHR: We have talked a lot about agronomy as local in the past. And because we believe that, in site-specific recommendations, paying attention to every field, specifically in every different productivity area inside of every field, it makes it important to create unique prescriptions. And when you talk about equations, they are based on productivity, based on soil analysis, based on removal rates. When you think about the rate of nutrients that should be applied, how do you decide? How do you know if you have enough, too much or too little?

DAN FRIEBERG: For us, it comes back to being able to do trials in growers’ fields. Sometimes I sound like I’m critical of land-grant universities. I’m not. I’m a land-grant university product. Land grants were a big piece of educating and bringing science to agriculture, and they still are. They still have a really key role, but it’s this transformation. Instead of taking research that was done somewhere else, we’re actually able to put replicated trials in growers’ fields.

One of the things we hear all the time is you can’t get more local than my fields. That ability to use analytics to inform our recommendations, and then turn around and put a rate trial in different areas of a grower’s field, is a key piece of our strategy. Doing scientific trials within each part of each grower’s fields is just a big piece of our culture and this idea of continuous improvement.

Darren, you asked me earlier what some of the common mistakes are. In the area of variable-rate nutrient application, the I believe the single biggest mistake is that we’re going to test your field, and then we’re going to make variable-rate applications. And the map that looked like there was so much variation, it’s all going to be one color someday. We’re pulling down the high areas and building up the low areas. Four years from now, your field will all be one color.

The goal of variable-rate nutrient application and why you would do a soil test was never to achieve a part-per-million number. Even though equations use part-per-million soil test values, nobody gets paid by that. The grower doesn’t get paid because they got their phosphate to 30 parts per million or 25 or whatever the number is. The goal never should have been achieving a part-per-million number. The goal is to produce yields as efficiently as possible. In areas where nobody has been doing much sampling, and they’ve been doing uniform applications, we typically find that the lowest fertility areas are actually the highest yielding.

create a nutrient plan

And the reason they’re low fertility is those high-yield areas have mined down the nutrients. The field is treated uniformly. I put the same blend on every acre. I’ve done it for the last 10 years. The point is, you haven’t been removing nutrients as uniformly as you’ve been applying them. Those consistently high-yield areas have pulled down nutrients. The consistently low-yield areas have allowed nutrients to build up in the soil test. You capture that when you soil sample it, and that can be a foundational piece. But, what we also find is that those areas that are consistently higher yielding, it’s hard to keep up with them. The more you apply with certain nutrients, the better the yield.

Our point is never to try to even out the field and make it one color on a soil test map. Ours is all about: how do we generate more dollar return for every dollar we invest within those areas of the field? And if we never catch up soil test-wise, that’s great because if we never catch up, that just means we kept producing better and better yields as efficiently as possible.

DARREN FEHR: Since we started doing enhanced learning blocks…I don’t know, what are we in? Our fourth or fifth year?

DAN FRIEBERG: Yep.

DARREN FEHR: What is the insight that surprised you the most when you looked at how we advanced or accelerated that rate for nitrogen or other nutrients? Especially when you learned how much money we left on the table? Tell me how that journey has been for you.

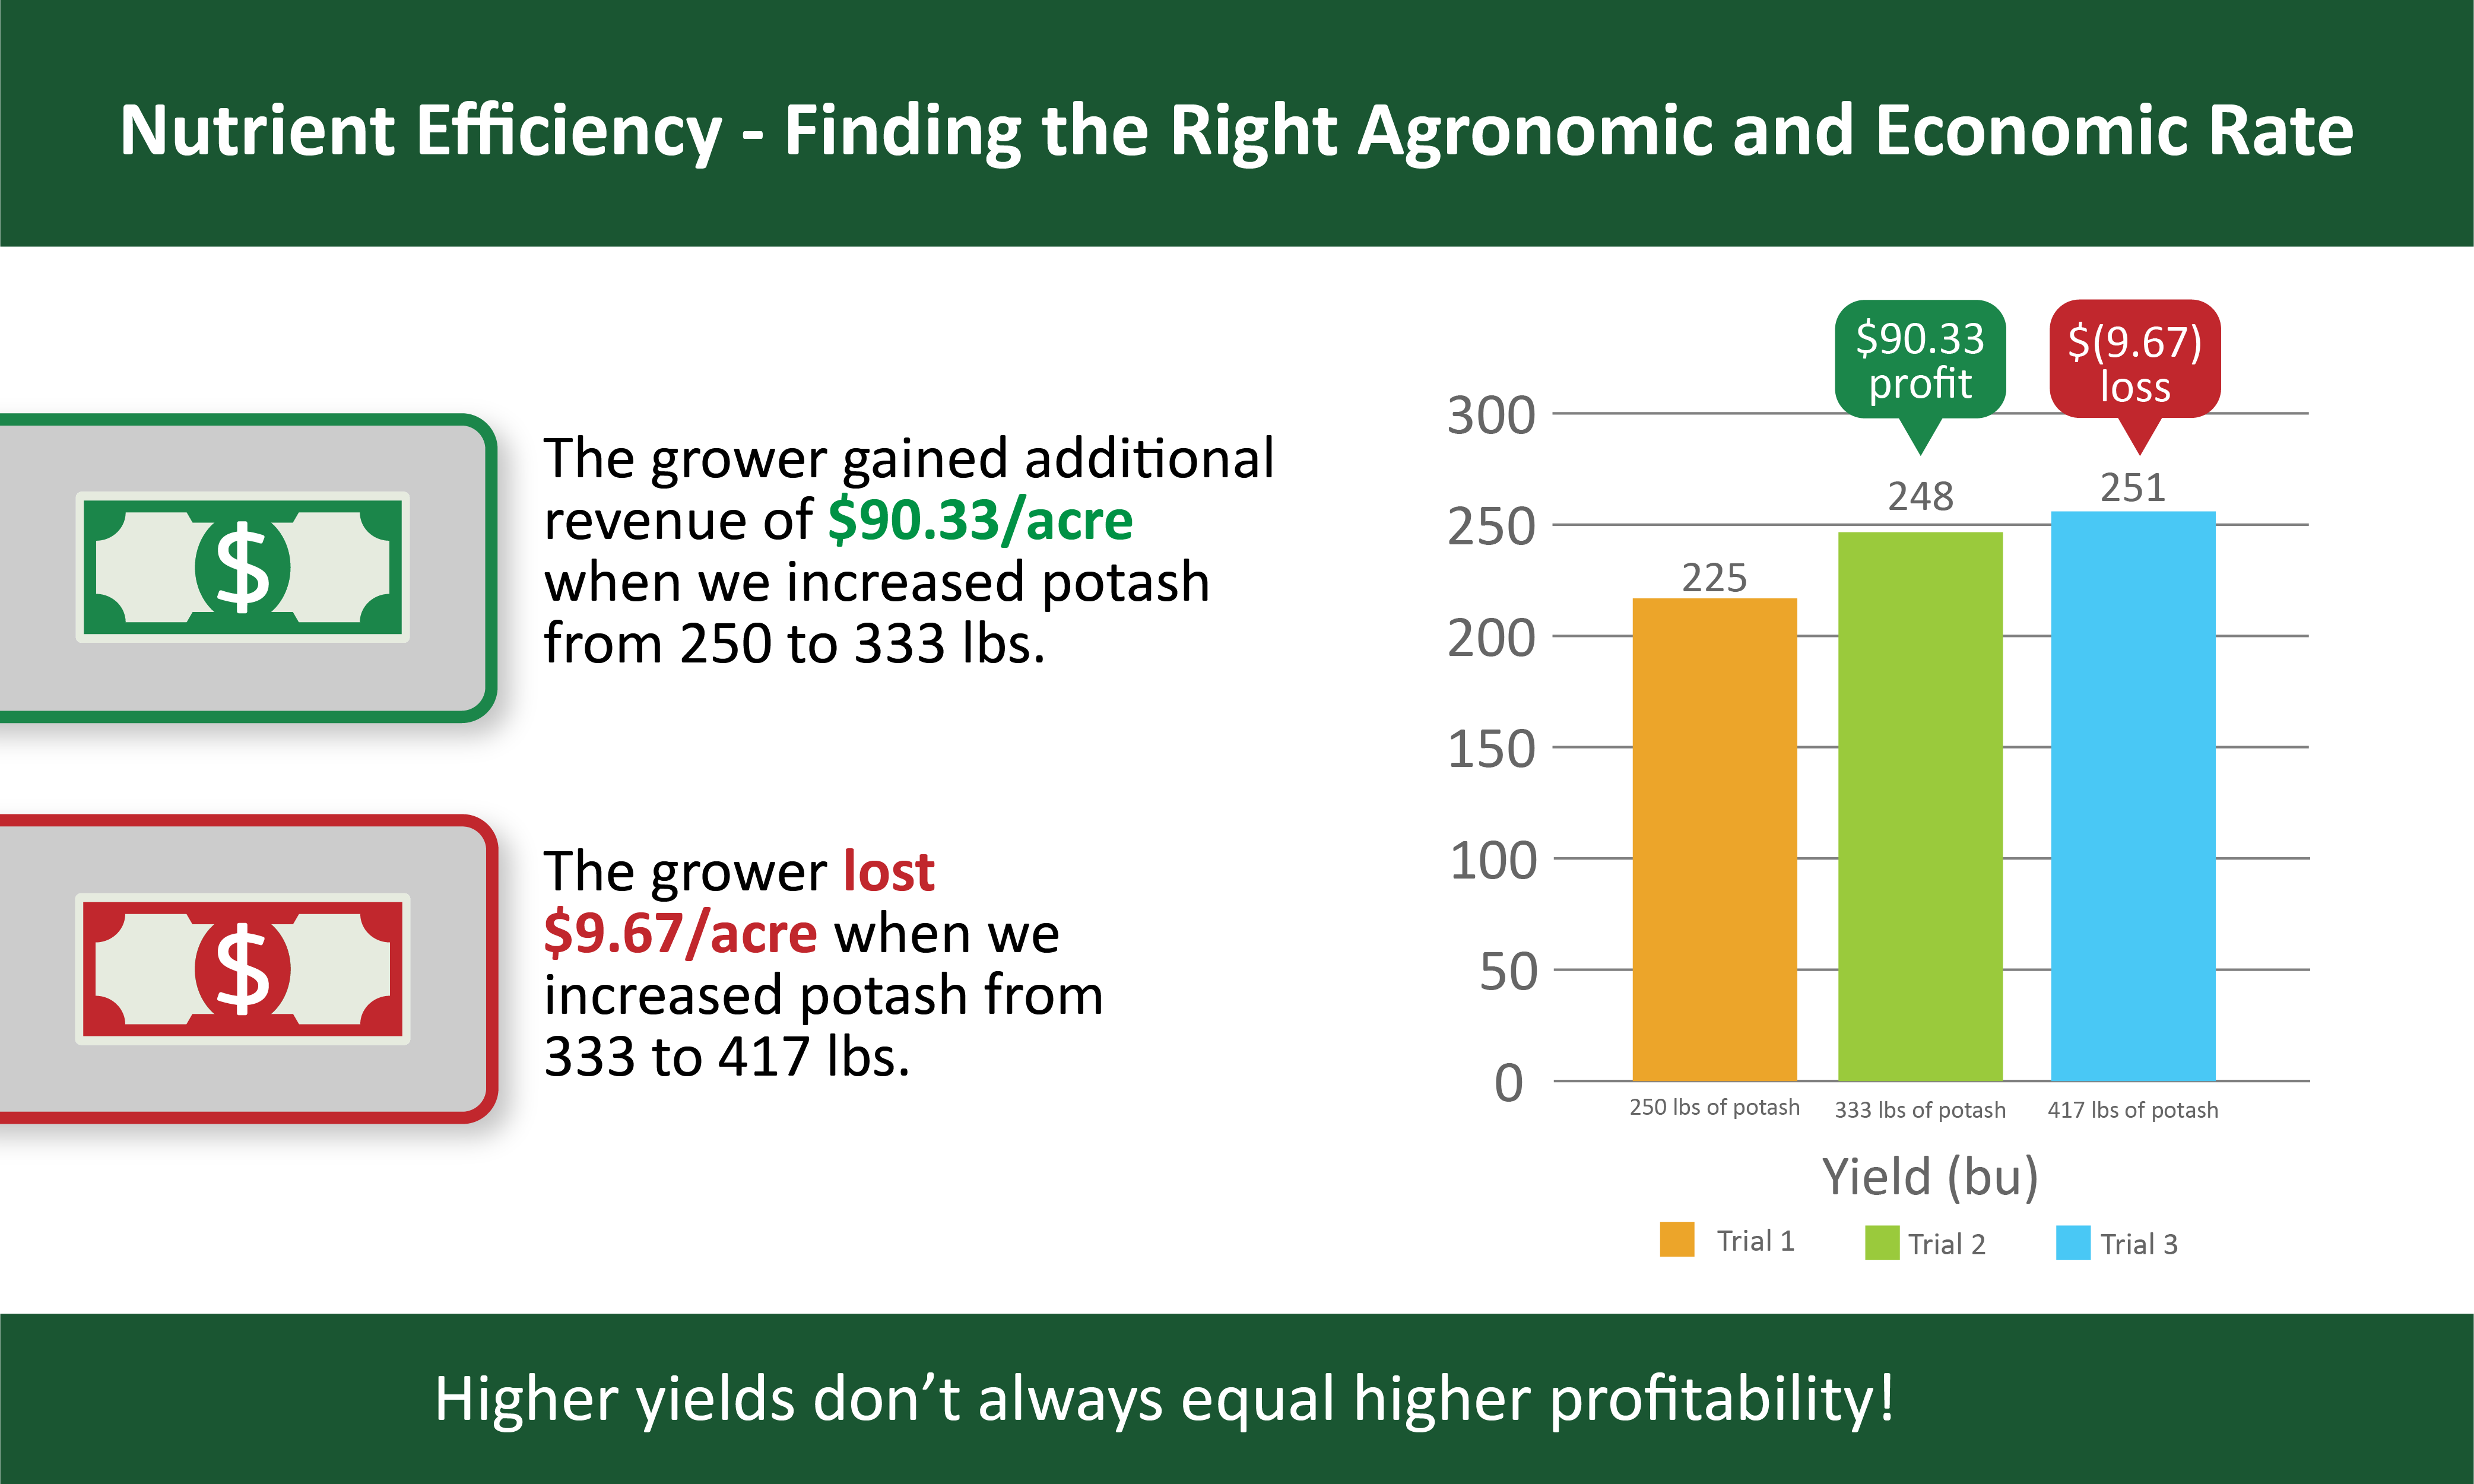
DAN FRIEBERG: The dollars per acre are way bigger. The dollar per acre returned to the grower is way bigger than I thought. I was obviously a really big advocate that everybody should be using the technology available to do better agronomy. I didn’t realize that the dollar-per-acre swings for the grower were as big as they are. We’re seeing 80 to 100 dollar-an-acre swings by single nutrients. When you realize there are that many dollars in play, it just leads you to want to do it better. We got to get even better at this. We’re just beginning to understand and to tap into what’s possible.

DARREN FEHR: We are also surprised by getting a yield response when we are ultra-aggressive on our rates. We’re still getting a yield response in some areas of the field that are very high-producing areas. We’re constantly surprised at how much yield response we can still get by being ultra-aggressive and applying a very, very high rate.

DAN FRIEBERG: But just think about what you said because it’s really key that everybody understands it. If you do that everywhere, if you take that attitude everywhere, you’re wasting dollars. What we’re talking about is there are areas of fields where everything is working. Everything is working, and those areas just seem to keep climbing, and you see it in trials. You see responses to being even more aggressive. So, it does surprise you.

DARREN FEHR: Okay. Thanks, Dan, for sharing a little bit of your insights today on nutrient planning for any of our listeners that do get a prescription created by their supplier or adviser. And if you want to take that to yield and prove it paid, contact us at www.premiercrop.com. This is kind of what we do. We take a prescription. We take the planning process and prove it out in their analytics, and we’d love to do it for you. So, thanks Dan, and we’ll talk again next week.

_____________________________________________________________________________________________

Free Resources: