Can “Unhealthy” Soils Consistently Produce Exceptional Yields?

In the early 1970s, I was fortunate to work for a farming operation that was serious about soil conservation. Serving on State Soil Conservation boards, building terraces, implementing no-till, when planters and weed control options were crude by today’s standards – they were soil stewards. Because of their mentorship, I’ve always taken soil conservation seriously.

In the 1980s, I found myself defending the use of commercial fertilizers. Those that attacked their use liked to describe them as “chemical fertilizers”. If you remember the Periodic Table of Elements in your first chemistry class – you know nutrients are chemicals. Phosphorus and potassium are minerals that mined from the earth, and nitrogen is made from the air (which is 78% nitrogen). Nitrogen fertilizer is a chemical and combining hydrogen from natural gas, with nitrogen from the air, to produce nitrogen fertilizer, was a significant scientific achievement. We have to be judicious in how we apply Nitrogen from all sources, but since it takes energy to create nitrogen fertilizer, it warrants additional attention.

What I understood then as I do now, is that we need integrated approaches to crop management to be both economically and environmentally sustainable. How we manage weeds, insects, nutrients – including organic nutrients, tillage, residue and crop rotations have serious consequences both for the environment and growers’ balance sheets.

One of the thoughts that’s been rumbling around in my head relates to soil health. In some circles, soil health tends to end up in a discussion about farming practices – almost a checklist of do’s and don’ts. Other approaches try to quantify soil health with a test. I tend to like the test concept because it starts to allow us to make comparisons from field to field, within fields, benchmark over time and eventually be able to quantify changes.

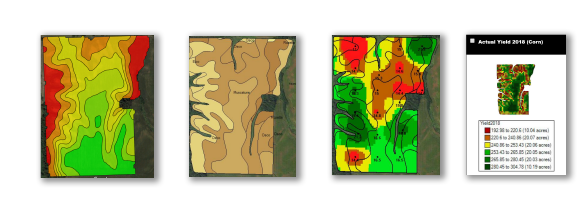
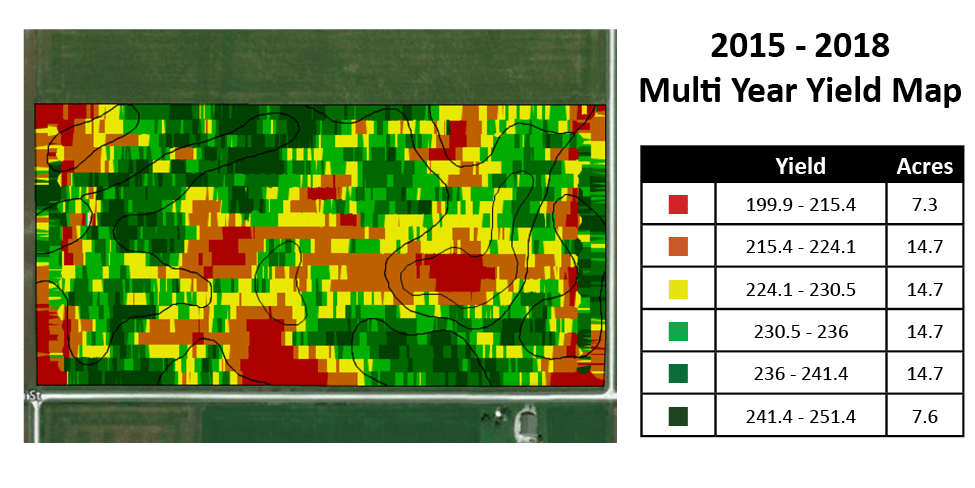
Our company, Premier Crop, is all about managing variability within fields and between fields to maximize a grower’s return on investment. We use yield files from calibrated yield monitors to measure our success both agronomically and economically. One of our tools empowers the user to build a multiple year yield map. I find that there are parts of fields that are amazing in their ability to consistently kick out exceptional yields. I understand that there are examples of “throw the kitchen sink” at production and have everything work perfect in a given year.

I’m not talking about a one-hit wonder. I’m talking about areas of fields that are exceptional yielding on consistent basis. Are those areas of the field “healthier” than other areas? Is it possible for them to be unhealthy and be so consistently high yielding?

multi year yield map

What do these high yield areas have in common?

  • Drainage is right – either blessed with naturally well drained or a combination of cultural practice and field tile.
  • They frequently have deeper A horizons (depth of top soil before clay or sub soil) and usually a higher % organic matter.
  • Usually pH is right – not too high but also not low. That makes sense to me, correct soil pH makes other nutrients, like phosphorous, more available and is needed for the bacteria that increase mineralization to be active.

I believe that nutrient cycling is better in these areas – that is soil supplied and fertilizer/manure supplied nutrients cycle to plant useable forms better than in other parts of the field. There is a strong relationship in parts of fields between consistently high yields and soil health. I believe you can have healthy soils that aren’t exceptionally high yielding (can be limited by other management choices). But I don’t believe you can get consistently high yields on unhealthy soils. If you’re trying to understand differences in soil health within your fields, I’d be inclined to start with a multi-year map.

You Can’t Manage What You Don’t Measure

Private colleges market their low faculty-student ratios to compete with the draw of big universities and the message is it’s a place where we know your name. Insurance companies compete by selling the value of an agent when you have a claim vs. a phone number to call – the message is you are more than a number. These savvy marketers know that “me matters” – at some level most of us value being treated as the individuals we are. Being treated as though we are all the same as our peers – whether by age, gender, race, economic situation or other demographic insults our sense of being unique in the world.

Pretending that what is different is all the same may be how things were, but it is not how they will be in the future.

Over 30 years ago when my career started it was common that we would drive into a field, randomly pull 20 cores of soil from within the field, mix the cores in a bucket, pour a one pound sample into a soil sample bag, send it to the lab and then “pretend” the lab results were representative of the field. We would then uniformly apply a blend of nutrients for each field that best matched those soil test results, pretending that one rate of multiple nutrients was right for that field and the crop to be grown.

Sampling and applying different blends for each field was an improvement compared to not sampling and applying the same blend to all fields.

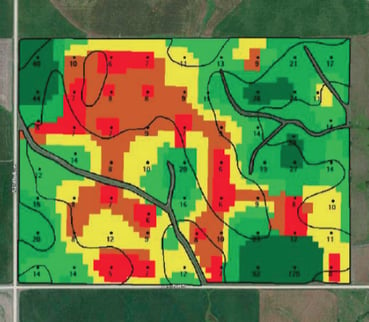
grid soil test map

While we now have the ability to easily measure variability within our fields and to manage each part of our fields uniquely, the reality is most growers don’t. Reality is, even in today, the majority of fields are still treated and managed as though they are uniform. Pretending that dramatically different geographies are the same, is still common with our agronomic recommendation system. State-wide recommendations may provide an average starting place but too often they are also the ending place.

I believe that will soon change. I believe precision ag will become agriculture’s fruit fly! Cancer researchers have discovered that at a molecular level, fruit flies share many of the common genes that are found in human tumors. A common cancer tumor with 200 mutated genes might contain 180 genes that can be reproduced in fruit flies. Researchers can order up strains with each unique mutation. Eventually they whittle the number of genes down to about ten that seem to matter. Those ten genes produce a cancerous growth in the fly that most closely resembles the one in the human being. They are basically able to construct a fruit fly that is personalized to each person’s cancer. Instead of treating cancer with a one-sized-fits-all chemotherapy cocktail, researchers are able to develop a very personal treatment that is best for each individual’s cancer.

Precision ag’s history has been about applying existing knowledge variably within diverse landscapes. The future will be about using spatial data to create new complex agronomic knowledge that can be used in the most site-specific applications possible. This will be a fundamental change – same as using a fruit fly to uniquely treat cancer!

Back to the Basics

I have never liked the warning “you don’t get a second chance to make a first impression.” It always seems to futile and irreversible. But one example that I encounter frequently relates to how variable rate applications were first positioned by the ag input industry. Years ago, when GPS was first allowing us to measure differences within fields and variable rate controller technology was being pioneered, the value proposition presented to most growers was “this will save you money.”

With the exception of variable rate applications of lime, that first value proposition seldom proved to be true. And because the “save you money” value wan’t obvious to growers, some growers gave up and reverted to straight rate applications of all inputs. At Premier Crop, we seldom talk about saving growers’ money on inputs. We realize that what we might save on one part of a field, we’ll likely spend on another part. It’s not about saving money. It’s about maximizing profit; being more efficient in how we invest all input dollars.

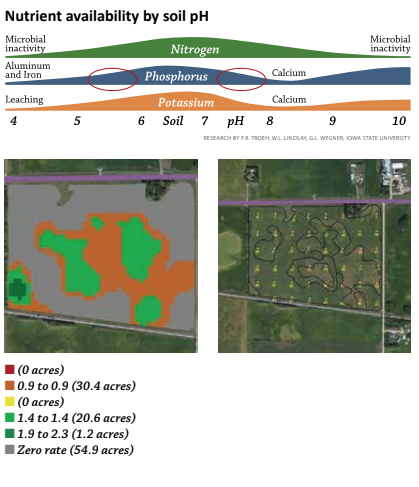
But that exception – variable rate application of lime – can be extremely significant in many areas and it’s worth exploring why it frequently saves so much. At some point in our farming history, most of us have seen this chart illustrating the relationship between soil pH and nutrient availability. Phosphorus (P) is a primary nutrient and a significant annual investment for most growers. Focus specifically on how phosphorus availability is influenced by pH. When I talk about why growers should know and pay attention to pH, I start with “P” availability. Correcting low pH’s helps unlock soil “P” reserves for the growing crop.

nutrient availability by soil phBut there are at least three other reasons variable rate lime applications make sense. In many parts of the country, fields also have high pH areas. Applying a flat rate of two tons of lime on a field that has any high pH soils, makes a bad agronomic situation worse as phosphorus availability is just as adversely affected on high pH’s as it is with low pH’s.

Another reason that is seldom talked about is organic matter mineralization. The bacteria that are needed for mineralization cycle aren’t active in low pH’s. Correcting pH can keep the soil’s natural nitrogen engine working well.

The third reason is an old one made new again. As we start to embrace IPM practices – crop rotations, herbicide rotations, cultural practices, etc. – to deal with weed resistance, soil applied herbicides will be part of the solution. And some of the most effective products have pH interactions, including carryover to other crops in your rotation. How will your advisors make the best recommendation without a pH map of each of your field?

There are many reasons to variable rate apply lime, but you can’t consider them without an accurate geo-referenced soil sample. It’s a great way to get started and the savings in lime cost by only treating the low pH acres will more than pay for the cost of the soil sample!

Three Top Examples of Agronomics and Economics with ProTech Partners

In this Premier Podcast episode, we’re talking with Matt Bowers, Premier Crop’s Eastern Strategic Account Manager and Kimberly Beachy, with ProTech Partners in Indiana. Matt and Kimberly discuss the top three examples of agronomics and economics.

MATT BOWERS: I am the Strategic Account Manager for the eastern business unit for Premier Crop Systems, and I recently joined the Premier Crop team earlier this year after working in the seed industry. I grew up in western Ohio on a family farm and currently reside in central Ohio with my family. And today, I’m speaking with Kimberly Beachy from ProTech Partners in Indiana.

KIMBERLY BEACHY: I am an agronomist at ProTech Partners. I work with growers mainly in southern Michigan and northern Indiana. I’ve been with ProTech just over four years and have previous experience in seed production and product stewardship. I grew up on a corn and soybean farm in Newton County, Indiana. Nice, good, black dirt like they have out in Iowa, I found my love of agriculture there. I went to Purdue and got a bachelor’s degree in agronomy and then continued my education at Iowa State. I have a master’s degree in seed technology and business through their online program. I enjoy being outside in my free time. We spend a lot of time outside on the playset with my husband and my daughter.

MATT BOWERS: Good. Well, I don’t have as much black dirt where I’m at in Ohio, but it sounds like a good background of growing up on the farm. Today, Kimber and I are going to discuss examples of “everything agronomic is economic.” And I was wondering if you could start out with telling us how ProTech Partners help their growers focus on the agronomics, as well as the economics.

KIMBERLY BEACHY: Let’s first define those two things. What is agronomics? That’s everything that we do in the field that’s making good management decisions. It’s deciding how much fertilizer to apply and where we’re going to put it, planting rates, crop protection, tillage systems and how we incorporate all of this into the farm. All of those things is how we grow our crop. The economics side of it is the money. I mean, farming is a business, and just like any other business, you want to make sure that the money coming in is greater than the money going out so you get to farm again next year. That’s the goal for the farmers that I work with. They just want to do it again next year. So, how does ProTech focus on agronomics and economics? We do that by analyzing their data. And we use that knowledge to help them make decisions on their farm. We’ve been collecting data on the farm for years, not just in spatial data like yield files or with prescription mapping, but through grid sampling. It’s another spatial data collection, and also record-keeping.

Knowing what we’ve done on the farm in the last five, 10, 15, 20 years can be really valuable knowledge as we plan into the future. But if we never take that data and use it to make decisions, then it’s not doing us any good. It’s important to take the time investment of collecting your farm data and made a return using your data. Our ProTech advisors work with the growers to analyze the farmers field data. We add their costs to the layers of data including their product cost, operations cost, management cost if they have any land-specific cost, and tie that to their yield file so we can really see what is making agronomic and economic sense on the farm. It’s really pretty easy to tell if something yields better, right? You see a bump on your yield monitor, but it’s a lot harder to know if that yield bump also had a little bump in the pocket book. I mean, if it paid for itself or if a decision we made is a cause to the yield bump, maybe we didn’t produce enough bushels to offset the cost. That’s where ProTech can step in and really drive that home, making sure we’re making economic decisions, not just sound agronomic decisions.

MATT BOWERS: Okay, so we’re not necessarily all about the bright green or dark green, I should say, spot in that yield monitor. We’ve got to see what’s tied behind there and what’s backing that up, right? It sounds like ProTech has a nice program to help growers really look into their farm as a business because that’s what farming is. It’s a business, right?

What I hear you saying, though, is that every pass across the field matters agronomically, but it also has a cost associated with it. And that’s something that we need to manage and look throughout the year. So, can you give me maybe your top three examples of “everything agronomic is economic,” in your opinion, when you’re going out and you’re meeting with your growers?
DSC_7460


FIRST EXAMPLE OF AGRONOMICS AND ECONOMICS IS: PLANTING

KIMBERLY BEACHY: I think the best way to look at it and take us through this process is to think of the growing season. I want to touch on planting, fertilizer and also a crop protection fungicide pass. We’ll hit those in the order that they happen. So, first off, let’s talk about planting. That’s when we take the seed out of the bag. It has the highest yield potential that it’s ever going to have.

So, everything that we do is to try to protect that yield potential. Planting population is a big part of that. If you overcrowd your plants, you’re going to make them compete for resources, and you’ll reduce your yields because they’re competing with each other. There are not enough nutrients out there and not enough food to feed those plants, but on the flip side, if you have too low of a population, then you’re reducing your yield potential by not having enough out there in the first place. You can’t produce bushels of corn if you never plant the seed to begin with. So, with the planting side of it, tying agronomics to economics is about finding that right rate in the right part of the field, and we do that with management zones. Within ProTech, a management zone is not just a seeding rate like it is in a lot of other places. We truly manage the field and the operation off of those zones. So, we break our fields into high-producing areas, which are A zones, and lower-producing areas that just don’t do as well, maybe it’s a wet spot, or it’s shaded by trees, or there’s a family of deer that lives next door and likes to eat it all the time.

MATT BOWERS: You must be talking about Ohio there, then, because we have the deer spots, and every field is ringed with trees.

KIMBERLY BEACHY: Yep, and that’s why you just have that C zone around the outside of your field, then. But we have those areas, and then the middle, kind of those average-productivity areas, we’ll label as a B. It’s pretty consistent. Year in and year out, it does pretty well, but it doesn’t have the capability to be those rockstar areas of the field, where we’re going to see maybe even 400 bushels on a yield monitor when we go through them. So, we break our field into management zones, and then we manage nearly everything we do based on those zones. So, in an A zone — those are our high-producing areas — we’re going to push our planting populations in those areas. We’re going to plant more seeds because those parts of the fields have the capability to produce more bushels. In the C zones, we’re going to pull back our population because we know those spots, whether it’s animal feeding or shading, or it’s a wet spot or a sand hole, something causes it to not have the yield potential, and it’s something that we can’t fix. If we can get a part of the field from a C zone to a B zone, or a B zone to an A zone, with fertilizer or any management practice, we will do that. Those C zones are C zones because that’s just what they are. That’s the best they can do. So, by labeling it a C zone and understanding that part of the field is not going to produce as well, we can manage our risk there by lowering our planting population. That will save us money on seed cost because, to tie it back to the economics, by lowering our population, we have reduced seed cost, which helps our bottom line.


SECOND EXAMPLE OF AGRONOMICS AND ECONOMICS IS: FERTILIZER

MATT BOWERS: The fertilizer ties along with that, then, if we’re lowering our population where we’re lowering our fertilizer. Maybe we’re not lowering all-over cost, but we’re translocating those to the A zone, right?

KIMBERLY BEACHY: Yes.

MATT BOWERS: And moving those over and spending where our bang for our buck is more beneficial, right?

KIMBERLY BEACHY: Yeah, and I’ve had that conversation with a lot of growers. When variable-rate technologies came out, the discussion was: “Oh, it’s going to save you money. We’re going to reduce your fertilizer usage.” And we found that’s not the case. What we’ve done is we’re better investing that planting dollar or that fertilizer dollar. We’re putting it in the areas of the field where it needs it, where we can get a return on that investment. So, we’re really driving farming into that business idea, where we want to see a return on every dollar we spend. You want to see a return on every dollar you spend. But with farming, in general, if we’re doing a straight rate across the field, we’re treating every acre the same, and we know that that’s not the case. Every acre is not the same because when we drive through the field, even if you don’t use a yield monitor, you can see variation in the amount of loads you’re taking off. I mean, you can tell how good the corn is or how bad it is as you’re driving across the field. So, why would we treat that the same on our input side if we’re not taking the same amount off of it at the end of the day? And that’s how variable-rate technology lets us do that. And that’s why it’s so important to tie it into not just planting but also into your fertilizer, and that’s how we really do tie the agronomics to the economics in agriculture.

MATT BOWERS: So, your second reason — you’ve kind of got into that there because you’re tying it with the population, with your fertilizer and variable rate and our fertilizer rates, as well. Is that also — for you, with your growers — is that also with nitrogen in how you handle nitrogen?

KIMBERLY BEACHY: Yes. I started talking about it because it all ties together. I mean, that planting population decides a lot, and you do need to factor in your planting population when you’re determining your nitrogen rates. And I know Dan Frieberg uses this example a lot. If you invite more plants to dinner, you have to have enough food to feed them. So, if we have a higher population in our A zones, we need to account for the added food that they’re going to need, the added nutrients and dry fertilizer and nitrogen, especially. We need to increase that nitrogen rate in those A zones. And I think we can also push the nitrogen rates a little higher in the A zones because we have the capability to produce more bushels, not just because of the higher population but just because the ground is better. By pushing that, yes, you’re taking a little bit more risk, but it’s a smart risk. By pushing your nitrogen rates in your A zones, you have a better opportunity to have a return on that nitrogen dollar than you would if you were pushing nitrogen rates in your C zones. So, that’s really how we focus on it. It’s looking at our nitrogen, how our nitrogen is used in the field. We could go out and apply at a straight rate, but we’re going to be overfeeding our poor-production areas and underfeeding our high-production areas. Really, if we feed to the average, then we’re missing out on high-end yields, and we’re overspending on those low-end yields.


THIRD EXAMPLE OF AGRONOMICS AND ECONOMICS IS: CROP PROTECTION OR FUNGICIDE

MATT BOWERS: Great. Now, you had mentioned fungicide passes and looking at fungicides. And I know you and I have had some conversations based around fungicides and timing in years and how the weather is that year and what stage the corn or the soybeans are at. So, why don’t you touch on a little bit of that, as far as electing that pass and the cost and the benefits of what that would be.

KIMBERLY BEACHY: And I have a great example of that from this year. Where I’m at in northern Indiana and southern Michigan, we’re kind of in that epicenter of tar spot. It started here a few years ago. We’ve had really high infection rates in fields the last couple of years, and we can really see the value of fungicide. But we have to make sure we’re spending that money wisely, that we have to look at the year. So, to have a disease infect — I mean, in college, we learn about the disease triangle or, in a plant pathology class, you learn about the disease triangle — you have to have the host and the pathogen. Up here, we have that. We have corn, and we have tar spot. We have that pathogen, but what we don’t always have is the right environment. There are instances where applying just a plant fungicide pass is the right way to go. And I had plant fungicide passes in my high-production corn, especially with the high-production fields that are irrigated, because they’re going to have more leaf wetness from that irrigation water.

But where it’s a little harder to make those calls is on your tougher acre. I have a grower that has some high-production irrigated fields that his yields can be, I mean, phenomenal, averaging 250 or higher across the field. But he also has some ground where, if it doesn’t rain, he’s going to be happy to hit 100-150 bushels per acre because it’s really sandy, dry soil. And those are the acres that you don’t always think about as being important when it comes financially. But if you’re not making as much money off of it, then you can’t treat it. You can’t spend as much money on it, either. So, for the tar spot this year, one of those tougher fields that he has was planted at the end of May, beginning of June. When I did my last fungicide check on it, when I did my last scouting trip, it was the end of July, beginning of August. We didn’t have any disease out there. We, the grower and I, were looking at what’s in the field and looking at the weather that we had up to that point. It’d been a dry summer. It’d been kind of hot, so he’d already lost some yield potential there. And then, looking at the forecast, it was supposed to be hot and dry, so we weren’t going to have the conditions that were necessary for tar spot to really take off. So, we decided that it wasn’t economical to make that fungicide pass.

Well, fast forward a few weeks, he sent me a picture from a leaf in that field, and it had tar spot on it. And the weather changed, and it got a little cooler. It was rainier. We had some leaf wetness, extended periods of leaf wetness in that field, and the tar spot that was in the area took off on his corn. But at that point, it was too late in the season to make a fungicide application. So, that’s where, working with an advisor, it’s not just thinking about the agronomics. If I was just thinking about selling a product, I would say: “Yes, spray the fungicide.” If I was just thinking about what’s best for that corn, yeah, the fungicide is good, but we have to also think about what’s best for that farmer and what’s best for that farm as a business. And that’s where, this year, that fungicide application just didn’t make sense. And yes, we did have the disease come in, but we’re going to manage. Now we know that it’s in the field because tar spot does live in the residue. The spores can overwinter in the crop residues, so we know what we have to do to manage that for future seasons.

MATT BOWERS: And because it came in so late. And, yes, it was there, but economically, even if you sprayed at that time, you probably weren’t going to see the benefits of what you usually would, had that infection come in earlier in the season when that plant wasn’t already headed to maturity, right?

KIMBERLY BEACHY: Yes.


ANALYTICS HELP WITH AGRONOMICS AND ECONOMICS

MATT BOWERS: Looking at these examples, why are analytics so important to dive into once we’ve finished out the year? The combines run through. We’ve got some results coming in. Tell me about that.

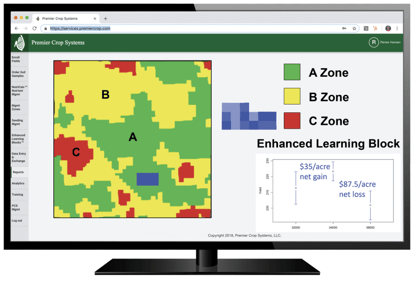
KIMBERLY BEACHY: Analytics is how we look at that data. We pull your yield monitor data off. We look at everything you’ve done through the year, whether it’s fertilizer, lime, your planting, any other nutrients you put down or crop protection products. And we really dig in and see what the economic benefit was of that, if you had check blocks out there. For planting, built right into my planting maps, I’ll put in little test plots for the grower. It’s built right into the prescription, called a learning block. And we use that information to check higher and lower populations within a management zone to see if we have the right rate. Because yeah, I can go out and I can tell you: “Yep, you need to plant 35,000 under the pivot, and that’s what you’re going to do, and I’m right because I’m right.” But we need to prove that we’re right. And we need to prove that what we’re doing is the best thing that we can do, and there’s a lot that goes into agriculture. I mean, weather is a huge factor, and we can’t control everything.

Even if you are pretty locked in on what that population is, having different checks in a field through different years, you can use that historical data, then, to check and say: “Yeah, in this year, if we’re looking at a cold, wet spring, this is the best population for me to go with.” And we can learn that and look back on that data. Even if we don’t use it the next year, we still have that historical information. The nice thing about the learning blocks is it’s not just going to tell us what yielded better. I mean, it will tell us what had a better yield, the high or the low population, but it’s also going to tell us which one had a better return on the investment. So, did we produce enough bushels with a higher population to offset the added seed cost? We can find that out. Really, on our end, it does take some work, but it’s a lot easier than piecing through all of your data and trying to do it on your own.

MATT BOWERS: So, with that in mind, growers are busy. They are going from one thing to the next, and there’s always something to do, right? With analytics, sometimes, going through the data and sifting through it can be a headache and something that is so tedious that they’ve got better things to spend their time on out on the farm. So, is that something that ProTech Partners and yourself, that you guys can help manage and pull out the things that the farmer needs?

KIMBERLY BEACHY: We go get the data. We clean it up. We put it in the system. They just need to hit “record” when they’re running through the field and let us know what they’re doing, as far as the grower responsibilities. And then, I ask my growers. I have an idea of what I want to show them at the end of the year, once I’ve analyzed their data, but I want to know what they want to learn from it, too. So, I ask them throughout the season: “What do you want to learn? What questions do you have?” Because we have the tools within our system to ask any question we want, really. Any question that we ask we can find an answer to. It’s not just about figuring out what I think is best or my decision about: “Well, I think this is what we should do. I think this is the best option going forward.” That’s part of it, but there’s also teamwork with their grower there to decide what’s important to the grower. And they tell me what’s important to them, and then the best part is I go find the answers for them. And I come back with a nice, little, concise report and show it to them, and then we chat and make decisions from there.

MATT BOWERS: That sounds great. Yeah, not every operation is the same. Not every operation has the same goals. Everybody thinks everybody is after max bushels, and that’s not always the case. It depends on the grower, right? So, if you could take and tie this all in a bow and explain how it all comes together for planning for next year, how does that look?

KIMBERLY BEACHY: We start planning for the next year’s crop. We’re already doing that. As we start seeing harvest data, we’ve already taken and put all of the other activities from the year into our system. So, once we get that yield file, we’re able to get it entered and go and really start help driving decisions. How we do that, it comes down to what the grower wants to know. I’ll look at things — soil fertility — and make sure that we’re doing the right thing with our fertilizer because that’s a big part of my responsibility with my customers. It’s giving them fertilizer recommendations, giving them seeding recommendations. So, those are the questions I’m really making sure I want to answer, to prove that I have been doing a good job. And if I haven’t, if I didn’t have the best rate, well, what’s the best rate going forward for next year, so we can make changes into our crop plan for 2020?

It’s a “do it and check it” process. We go out and do something, and we check our work, and then we make corrections for the following year. And we try new things if we have something out there. As an example, I have a low-productivity field. One of those ones on the sand that didn’t yield 100 bushels this year on it because it was tough ground. It’s like a beach. And we had some low, what I felt was pretty low, populations. I mean, the field average was right around a 20,000 planting population. I put some learning blocks in there for checks down to 16,000, but I want to take that a step further next year. Just by being in the field and looking at the crop, I could tell that we were over. Our population was too high for a dry year. So, what can we do? We’ll lower it a little bit on our prescription next year, but we can then add in more learning blocks to test it even lower. And depending on how crazy the grower wants to get, we’ll maybe test the limits of his planter and see how low he can go.

MATT BOWERS: Right.

KIMBERLY BEACHY: Because that learning block is a small area. It’s a small area too, and it’s built right in. So, they just have to okay it on the front end when I create the map. Once that prescription is in their monitor, they just have to go. It’s very little thinking on their part, but we’re constantly checking our work. ProTech is different in the fact that our agronomists — we go in the fields. Most of our ProTech programs include scouting, so the agronomists are the ones going out in the fields doing the scouting. We’re also doing the soil sampling, creating the recommendations. And we’re not just seeing what’s happening on paper or on the computer screen. We’re out there living it in the field with the crop. And we do take pride in being able to check that for the grower. ProTech is different from other precision ag companies because we truly manage by our management zones.

It’s not just a seeding rate. So, when I talked earlier about how we tie our planting rates to our nitrogen rates, we’re also doing that with our dry fertilizer. We manage our dry fertilizer based off of those management zones, as well. We’re pushing fertilizer rates in the A zone, maybe looking for higher soil-test levels, reaching for higher soil-test levels. But in the C zones, where we’re not going to produce as many bushels, we don’t need as much. We don’t have as much crop removal, so we don’t need as much fertilizer in general. And that’s one of the things that sets us apart. We don’t just go out there and make a recommendation based on a country’s worth of knowledge. ProTech believes that agronomy is local. And what we do here in Indiana and Michigan is a lot different than what guys do in Iowa. I mean, go further out west into Nebraska and Kansas, where there are different crops, different amounts of irrigation, different soil types. We do what’s best for our growers here because that’s what’s best for our growers, and we know that based on our experience in the field, in this area.

MATT BOWERS: So Kimberly, what I hear you saying about ProTech is that you guys work on a sub-acre level. You’re not just looking at an entire farm’s collective yield data and results at the end of the year, or even just that field, but you’re looking at the results in each management zone that you guys set up. Is that what I heard you say?

KIMBERLY BEACHY: Yes, that’s correct. When we really dig into the data, we’re not looking at it by the home field versus the back 40. We look at the A zones across those two fields or across the fields on the whole operation and compare those A zones. And we also compare the B zones. And then we compare the C zones because we want to do apples-to-apples comparisons. And if you’re comparing a whole field against another whole field, there could be differences. One could have irrigation. Soil types could be drastically different. Then you’re not comparing apples to apples. So, by looking at it, by comparing those management zones to each other within a field, you really can narrow in on what is best for those particular acres.

MATT BOWERS: Great. Well, Kimberly, we’ve had some great information that you’ve provided us today. Hopefully, the growers have some good questions that they might be asking themselves about their own operation. And if they wanted to contact ProTech Partners or yourself for help with answering some of those questions that they might have and get in touch with you, how and where can they find you and get ahold of you?

KIMBERLY BEACHY: Well, I am on Twitter @Kimberly_Beachy, but I’m not very active. So, it’s probably easier to get ahold of me by email. That is kbeachy@frickservices.com. And then if you want to learn more about ProTech, you can follow us on Facebook and Twitter. Our Twitter handle is @ProTechAgronomy, and we have a website at protechpartners.net.

MATT BOWERS: Great. Well, thanks, Kimberly, and thanks, everyone out there, for listening. And, as always, remember to be safe out there and make it home tonight.

Thanks for listening to the Premier Podcast, where everything agronomic is economic. Please subscribe, rate and review this podcast so we can continue to provide the best precision ag and analytic results for you. And to learn more about Premier Crop, visit our blog at premiercrop.com.
What Can You Do With Your Farm Data?

“We know there are dollars left on the table on every acre, it’s just a matter of finding it with your farm data.” – Lance Meyer, Kansas

LANCE MEYER: Hi, guys. My name is Lance Meyer. I’m an advisor here in eastern Kansas, actually located in the little town of Wellsville, just southwest of Kansas City. I’ve been with Premier Crop for about a year and a half now, and I work with growers kind of all over Kansas. I’m mainly focused here in east-central Kansas, but I get out west and up north a little bit, so kind of all over.

RENEE HANSEN: Yeah, and Lance, where did you go to school?

LANCE MEYER: Of course, K-State. I mean, is there any other school? I think I’m the only K-State grad with Premier Crop right now, so it makes me feel pretty good. I went to K-State, did ag technology there, minored in agronomy and ag business. With Premier Crop, now I’m doing what I love and pretty much exactly what I went to school for. It’s going great.

RENEE HANSEN:  Today, we’re talking with Lance about the “why” behind your field map and how data and agronomic data can really help you move forward and help you be more profitable in the years to come. So, Lance, I’m just going to ask you some questions. Just tell me a little bit about what you have seen within the last year and a half while at Premier Crop, or even when you were in school, noticing different spots in the field through data. Can you explain that a little bit more?

LANCE MEYER: Well, first of all, it’s great that people are recognizing that there are these spots in the field. In precision ag, at Premier Crop, we call that variability, and that’s ultimately our main goal. It’s to manage that variability, and Premier Crop has a bunch of different tools. Some examples that a grower might see differences in soil fertility: that could be organic matter, pH or just your soil-supplied nutrients. That’s really different all over Kansas. That’s one great thing about Kansas. You get kind of the whole diverse picture. So, in eastern Kansas, we could deal with some pretty acidic soils, and then, as you move farther west, you get into some really high-pH environments. So, there are a lot of different things there that are going on. Another thing here in Kansas: as you move farther west, you have historically high potassium in the soil. That’s a couple of things we deal with in Kansas, some other examples: weather also plays a big factor. We have a lot of irrigation out west. There’s some surface water irrigation here in eastern Kansas. Then, you also get into those very drouthy environments out west and a lot of dry-land farming. That can play a big factor in it. Some other things: different genetics are used in hybrids, that sort of thing. Stuff that works here in eastern Kansas is not going to work in western Kansas, in most cases. There are some big differences also in crop protection products. Different hybrids respond to different fungicides. We noticed a lot about that this year, that some hybrids respond greatly to fungicides, and then some not so much. There’s a lot of variability across the state, and that’s one thing that I’m here to help manage and make the best decision for the grower.

farm data map layers

RENEE HANSEN:  We say, within Premier Crop, that agronomy is local, but farmers say it too because we have this vast information of data within our system. Ranging from Canada, down south to Oklahoma, East to Ohio, all the way to Colorado. And it’s so important that looking at data locally, specifically in Kansas, is so significantly different. What would be the importance for a grower to start using their data when working with you?

LANCE MEYER: Like I talked about, there’s so much variability. Even across the state, but even in each county. Working with growers in eastern Kansas versus western Kansas, I mean, agronomy is completely different, and that’s really what I love about Premier Crop. You don’t have to be an expert on anything because we are using the data, and it’s pretty much screaming at us, telling us what we need to do. The Premier Crop software is really a big part of that, along with our industry agronomy experience. But the farm data really gives us the analytics and the insights, telling us what we need to be doing for each grower.

RENEE HANSEN: Yeah, so you talked a little bit about the software Premier Crop and, coupled with what you are able to offer, what tools does Premier Crop have to help a grower learn and why?

LANCE MEYER: For the businessman farmer of today, the guy that really enjoys using his data but might not necessarily have the time to do it. The operations that we work with are CEOs of their farm operation. Our advisors work with the grower to collect the farm data, manage the data, organize the data and make sense of the data, letting the farmer farm as they want to, without any time invested. We take care of everything, from variable-rate recommendations, cost tracking, to delivering the analysis in an easy way that the grower can understand, because we all know that looking at data can be pretty overwhelming and hard to make sense of. So, that’s a big piece of what we do, delivering farm data in a way that it’s easy to understand for the grower.

RENEE HANSEN: Yeah, I feel like some of the growers that I talk to in the field, just even around here in our area, even some of my friends that we’ve reached out to, I feel like they just don’t know where to get started. That is the hardest point, to just make that leap to get started with data. What would you say is the first thing? How easy can it be?  We take care of it, but what are some of the first steps that they need?

LANCE MEYER: Managing farm data is actually, really, pretty simple. The baseline of everything that we do is tied back to a yield file or that yield map. So, that’s essentially the only thing that we need to get started, that one or two years of historical yield data. I don’t know the stats on that or whatnot, but I think there are some 80% of growers out there that are capable of collecting yield data or are collecting yield data. They just don’t actually know it. I would think that the number’s actually higher than that, given the amount of people that I talk to and the conversations I have with people. You just have to have some yield data to get started. There are also other layers that are great. Having soil data will give us more insights, but the baseline is just yield data, and that’s the majority of growers out there.

RENEE HANSEN: And it can be so overwhelming because there are so many different layers of data, from soil sample data, yield data, planting data, as-applied data, and adding that all up yourself, the brainpower can be exhausting.

LANCE MEYER: You’re exactly right, and that’s our ultimate goal, to help take that lift off your shoulders. I tell growers all the time: “I’m sure the first thing they want to do after they get in from a long day is sit down at their computer and manage all this stuff.” And they’re like: “Yeah, no. That’s not what I want to be doing.” That’s just another little piece of the pie, I guess, the value that Premier Crop ultimately brings.

RENEE HANSEN: Especially when it’s “go time,” when it’s planting or harvest time. There’s probably something they need to be working on, rather than messing around with data.

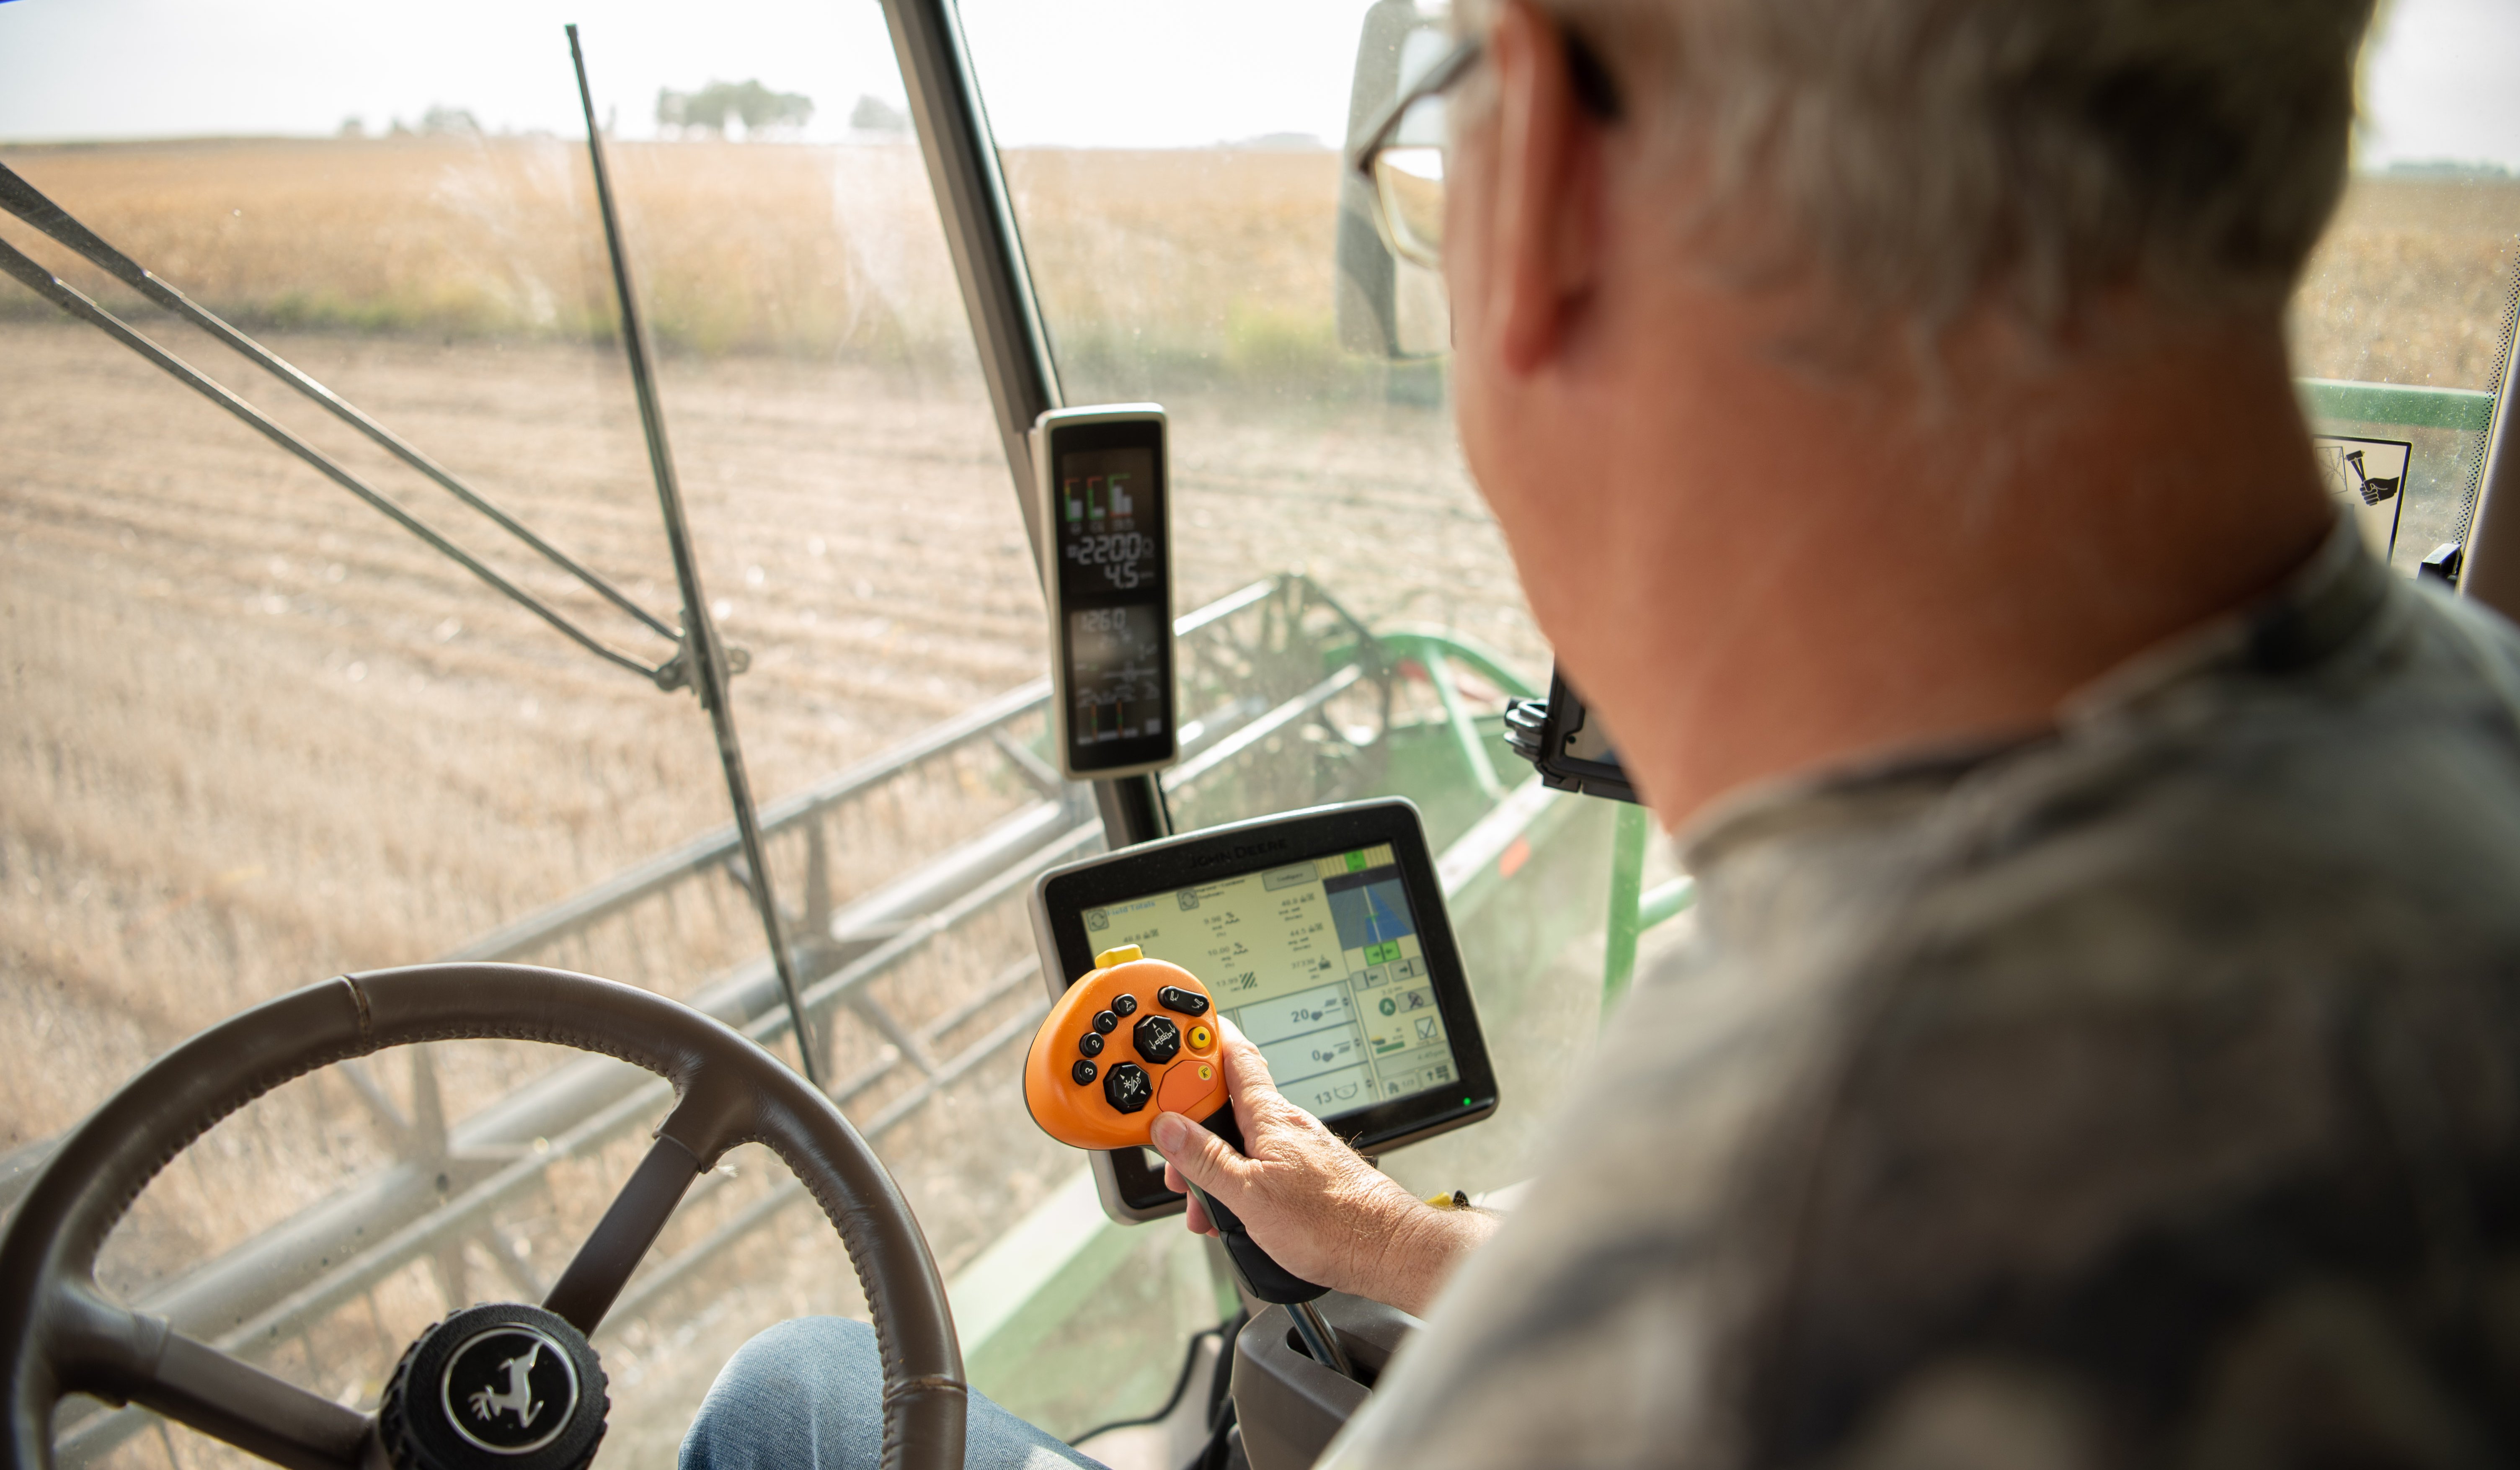
LANCE MEYER: Yep, and helping with the monitor and all the technical stuff like that is big, too. Growers tell me all the time. When you get a problem in the monitor, and you’re sitting in the field for one or two minutes trying to fix something, that seems like an eternity for a grower sitting there, wanting to get going. I mean, that’s ultimately what they love doing, running the equipment. So, having a little bit of a setback due to the technical stuff can be a big deal.

RENEE HANSEN: When it’s “go time,” it is a race against the clock, no matter what is going on.

LANCE MEYER: That’s right. It doesn’t matter where you are. That’s everybody out there.

yieldmonitor

RENEE HANSEN: Another thing with the tools that Premier Crop is offering we’ve been talking a lot about yield efficiency. Lance, I want you to talk a little bit about yield efficiency. What does success look like when looking at all of these maps from historical yield, ultimately leading to yield efficiency?

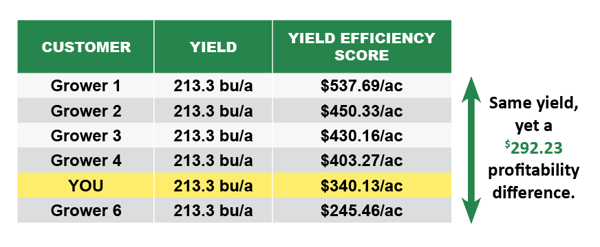
LANCE MEYER: With the yield efficiency piece, here at Premier Crop, I mean, we’re essentially redefining the success metric for today’s farmer. For so long, we’ve been focused on yield, but now we bring this concept of yield efficiency that a lot of people might not understand, but we’re helping people get there. Yield efficiency is, essentially, the amount of money in return from your crop that you have to pay land and management costs at the end of the day. So, obviously, yield is the number-one driver of yield efficiency. As long as we can drive higher yields while still lowering our break-even cost per bushel, we’re becoming more profitable, and profitability, for me, is success with my growers. These maps that Premier Crop gives us, they’re really our report card for the season, and that’s how I like to describe it with my growers. As long as we’re lowering that break-even cost per bushel and driving higher yields, like I just mentioned, I call it a successful season, whether it’s $10 an acre or $100 an acre farm profitability. We know that there are dollars left on the table on every acre, so it’s just a matter of finding it with your farm data. Like I said, if it’s a smaller amount or larger amount, I consider that success with my growers.


Yield efficiency score showing profitability


RENEE HANSEN: Do you have a specific example? Do you have a great success story that you saw this year?

LANCE MEYER: There’s actually one big takeaway that really stands out from 2020 and also in 2019. And that’s on the fertilizer side, and managing our fertilizer investment. Make sure that we’re taking into account our crop removals when we’re making fertilizer recommendations. It’s a simple concept, but it’s hard to get across. Every year we grow a crop on a piece of land, we’re taking off nutrients in the grain. The soil supplied nutrients through that crop, and we remove that off from the amount the plant took up. As we stated above, our main goal is to manage our variability in yield. Within that variability in yield, we’re taking off different amounts of nutrients in different parts of the field. If we’re applying our fertilizer the next season to account for the field average and crop removal, we’re ultimately under-applying in a lot of the field and over-applying on a lot of the field, also. This is actually a conversation I had with a soil sampling company, SoilView, Craig Struve, yesterday. He had a slide from Colorado State that says: “95% of the time, you’re going to be over-applying or under-applying fertilizer on your removal if you’re just applying that field average.” That’s why at Premier Crop, using the actual yield file, is exactly what we’ve taken off the field to replace it the next season. We use this equation so we’re not mining down these better areas of the field and then over-applying in the worst areas of our fields. That’s one big example, I guess. That could be, like I said, $50 to $100 an acre right there. That’s one big thing that I found for this season, anyway. Like we said, a lot of growers can do this with their variable-rate technology they have, but they just might not necessarily understand it or believe it pays at this point.

RENEE HANSEN: Thank you so much Lance. Thanks for listening to the Premier Podcast, where everything agronomic is economic. Please subscribe, rate and review this podcast so we can continue to provide the best precision ag and analytic results for you. And to learn more about Premier Crop, visit our blog at premiercrop.com.
Does Carbon Sequestration Pay?

“I believe that if we really want soils to be that carbon sequestering part, we need to be explaining to agriculture and producers this whole dynamic of carbon and how it’s going to benefit them in ways that they really haven’t thought about very much.” Dr. Jerry Hatfield

DAN FRIEBERG: Great to have you with us, Jerry. It couldn’t be more timely to be talking to an expert. There’s just so much buzz right now about carbon credits in agriculture. Could you just give us any perspective you want to share? I know you probably have talked about this for decades, but for everybody else, it’s kind of the latest buzz, and there’s just a lot of attention to, all of a sudden, soil carbon or how we can sequester carbon.

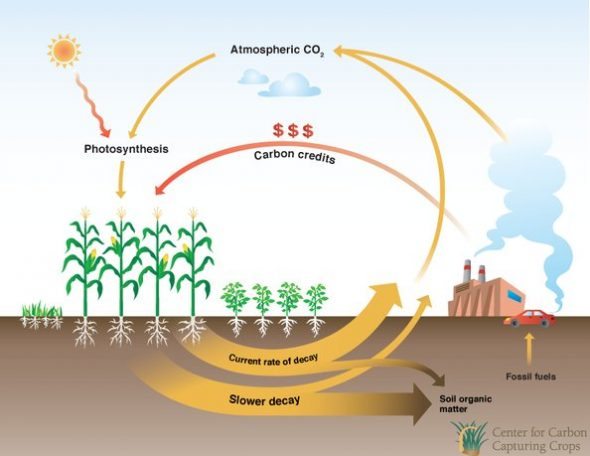
JERRY HATFIELD: I mean, if you look at soil carbon and sequestration and all this, we kind of have this interesting view of carbon. We have all this carbon in the atmosphere. When people say we’re going to sequester it in the soil, I think they magically think it’s going to go from the atmosphere into the soil and be stored there. But you have to realize that in agriculture, we take carbon dioxide and we combine that with sunlight to create carbohydrates that are where plant growth comes from. When we put it into the soil, it’s basically because we’ve transported it from the leaves down into the roots, and then we take those root exudates and feed the microbes that put that carbon into the soil. So, it is a very active process and requires that we have a living plant to be able to do that. The only way in which we pump CO2 from the atmosphere is with deep wells where people actually just dump and pump air down into the deep earth, but in agriculture, it’s really a very active process. And because it is an active process, we have a combination of sequestration, as well as cycling, because a lot of it gets sequestered into soil organic matter. It gets built into those aggregates, but a lot of it is really recycled very, very quickly. We have microbes that chew it up, and they put it into aggregates, and then they decompose and it gets recycled. We have to realize that, in agriculture, we do build it up over time, but it’s a very dynamic process and has all these different implications for us in terms of improving our soil structure, improving nutrient cycling, improving all these other things. That really is where the value of carbon is coming from.

soilcarbonImage from reneweconomy.com.au

DAN FRIEBERG: When we till soils, do we expose soil carbon to the atmosphere? It seems like a lot of the attention is obviously around not tilling. What’s the tillage relationship to sequestering carbon?

JERRY HATFIELD: If you look at this, just imagine that what we have going on in the soil is we take the roots. There’s an estimation that about 40% of that organic material is going out of the roots as root exudates, which is basically sugars that are feeding the microbes. Of that, a large percent is going into CO2 that’s trapped in that soil volume. So, when you till, all you’re doing is basically releasing a lot of that CO2 that’s been trapped in there, and then it goes right back to the atmosphere very quickly. The other part is that when we till, we expose a lot of that soil to the air. The microbes really begin to change that organic material and digest it very quickly, so we see another puff of CO2. We actually have two mechanisms when we till, but that immediate release is really, I think, just trapped CO2. Then, the longer term is the spring of activity of the biological community that respires, as well.

DAN FRIEBERG: Some extension person was saying that if we no-tilled, if every acre in the world was switched to no-till, we could reverse climate change. That’s obviously a huge advocate for no-till, but it was almost like this single change in practice could change climate. I mean, it’s that impactful.

JERRY HATFIELD: I’m not sure I buy that it’s that impactful, and don’t get me wrong. I think that no-till is part of this, but if we think about no-tilling corn and soybeans across Iowa, we’ve still got a large part of that growing season in which nothing is happening. I mean, we may not be disturbing it, but we’re not feeding that microbe. When we really want to build organic material, we’ve got to capitalize on capturing solar radiation and CO2 and putting it in there. So, we need that extended crop rotation to be able to really change that. Personally, I don’t believe that no-till by itself is the path. I think it’s one component of the system, but I don’t think it is the panacea, saying that if we kept everything else and all we did is change tillage that we solve climate change. I don’t believe that’s really the case at that point.

DAN FRIEBERG: A lot of growers and advisors are familiar with cover crops from a nutrient perspective. Just having a growing plant to grab nitrate as part of a nutrient strategy in the upper Midwest is a way to make a leaky system less leaky, but what you’re talking about is the additional benefit of cover crops to the soil carbon.

JERRY HATFIELD: From the carbon capture perspective, just think about it this way. If we don’t have a growing crop out there, we’re not capturing sunlight. Just look at Iowa, from the time in which we plant that corn and soybeans in the spring until we harvest them. Then, if you look from last frost to when that corn plant really comes up, and then from maturity until it really freezes in spring, we actually have about a third of the solar radiation that’s available to grow something. So, a cover crop is really, thinking about it, all we’re doing is using that photosynthetic process to capture a lot of carbon out of the atmosphere. In doing so, we obviously affect the nutrients. We affect the water, but I think we’ve got to start putting it into a much larger perspective of: “What are we doing in terms of the dynamics of carbon, nitrogen, water, all simultaneously?”

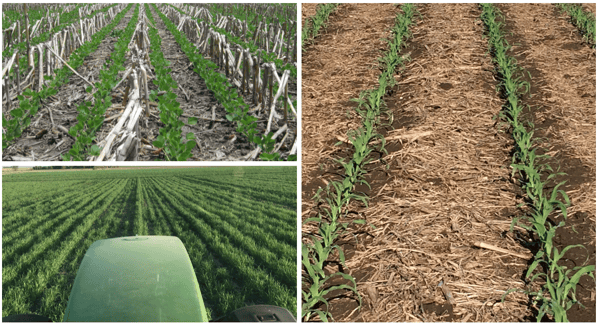
Screen Shot 2021-02-16 at 4.38.41 PMUpper Left: No-till; Lower Left: Cover Crop; Right: Row spacing
DAN FRIEBERG: As we talk about this, people go to soil health. I mean, they talk about soil health. The frustration for me, sometimes, is soil health tends to be practice-defined, like what practices do you implement? I know there’s different tests and other tests, that we’re trying to quantify soil health through a test, but when it comes to soil carbon, I know some of these programs are talking about soil testing as a part of that. They’re obviously talking about more than organic matter. So, there is a soil carbon test, right?

JERRY HATFIELD: We’ve had a soil carbon test. I mean, we look at organic material. You can look at soil organic matter. You can look at particulate organic matter. You’ve got a lot of this soil CO2, which a lot of the tests are based on. It’s basically, I believe, a surrogate for the amount of biological activity we have in the soil because those are respiring organisms that generate CO2. So, you’ve got all of these pieces coming together, and I don’t know. When we talk about soil health, I think we need to stand back a little bit because I think everybody says: “Here’s a soil health test.” Well, what do we want that test for? Because a lot of the components of soil health, I think, need to be much more related to soil function: supplying water, supplying nutrients, supplying support, lack of compaction within that. I think we need a much more holistic view of what we want our soils to do and not get hung up on saying: “What’s the perfect test?” I think that’s what confused a lot of people. “Oh, what’s the one test that I need to go out and run in my field to determine if I got soil health?” Well, you can look at how well that plant is growing. You could look at water infiltration. You could look at a number of different parameters. Just like in us, when we go to the doctor, he just doesn’t say: “Well, I’m going to look at your left earlobe, and that’s the indicator of health.” I mean, you look at the blood tests that they run. You look at the heart rate. You look at all these other things, and those give us a metric of health. I think it’s the same thing in soil. If we want to use that same analogy, it’s a suite of practices that give us a direction towards functionality. The other thing is that not every soil within the field is going to respond the same, just like every human doesn’t respond the same to what we do. Soils are going to respond. If we had a really sandy soil in that field compared to clay soil, and we do the same thing on top of them, we’re going to see different rates of response just because of the parent material that’s there. So, I think we need to get that understanding out there, that it’s a dynamic process. It’s also a process that has a lot of moving parts to it, and there are certain attributes that put us down that path, but there’s also going to be different rates of responses we go on, as well.

DAN FRIEBERG: I suggested one time that yield might be a surrogate for soil health, but it was really me trying to say there are areas of the field that just are so consistently high-yielding. To me, it’s probably how they mineralize nutrients and how they hold water and all that. It’s like some of these really consistent high-yield areas. Something is going on underground that is phenomenal, and it’s just “you’re in, you’re out,” and everything’s working.

JERRY HATFIELD: I think that, as we understand more and more about spatial variation within fields, we are seeing parts of that field that are the consistent high-yielding zones of that field. I’m always intrigued by the consistent high-yielding parts of that field that are legacy barnyards, where the cattle lot was. People say: “Why, that was 50 years ago. That was there.” So, what changed in that and all of this? The other part of this is we have consistent low-yielding parts of the field, as well, and I think that we can learn a lot by probably looking at the outliers. Why are those high-yielding spots the way they are? Why are those low-yielding spots the way they are? Then, you’ve got the zone that Bruno Basso and the group at Michigan State have come up with. We’ve got low-yielding stable zones. You’ve got high-yielding stable zones, and then you have unstable zones that really are dependent upon what the weather is during the growing season. Some years they may be high. Some years they may be low, but I do think that one of the pieces in this, in terms of soil health and these high-yielding parts, is those also tend to be much more stable zones in terms of year to year. They don’t have those big fluctuations, and those low-yielding parts don’t have fluctuations either, but they’re really non-profitable zones. These unstable zones, I mean, they could be 280 bushels one year and 120 the next year, and you go: “What happened besides the weather? What’s in that buffering capacity in soils?” I think that we need to be back thinking about what triggers that soil to be able to do that because, sometimes, it’s raining basically the same across the field. How do we begin to tease that out? I think a lot of us are trying to figure out some of these dynamics. Is it all biological? Or is it physical? Or is it chemical? In reality, it’s all three of those things coming together, but I think that if we want to move agriculture forward, in terms of efficiency and profitability, that we need to start looking and maybe examining from different viewpoints of the system.

DAN FRIEBERG: Yeah, it’s every geography. As we grow as a company and we get in states we haven’t been in before, we just always know that agronomy is local. There’s not a one-size-fits-all, but north-central Iowa, Jerry, those zones, they flip back and forth a lot. A lot of times, they’re the potholes, so they tend to be low-lying areas. They’re organic matter rich. They’re nutrient rich because, seven years out of 10, they’ve got too much water. So, nutrients have built up, just from lack of crop removal. Then, you get a dry year, and they are off the chart. They have so much organic matter and so much water-holding capacity that they will be the best part of the field in a really dry year. They’re the unstable ones that flip back and forth.

JERRY HATFIELD: Well, and then we get them flipped back and forth. You mentioned the water and everything. You pick it up in the spring, and then you struggle getting a population in that part of the field. Sometimes it gets drowned out, but if we can get that crop to start growing, I mean, it has nutrient-cycling capacity and water-holding capacity that is right off the charts.

DAN FRIEBERG: Jerry, going back to the carbon credit thing, will no-till kind of be a foundation for somebody to get carbon credits?

JERRY HATFIELD: I believe that no-till will be part of that process. I think it’s some of the work that Don Reicosky has done, and Morris showing that it’s basically the amount of tillage that you do. If we’re doing full-width tillage, we have a lot of CO2 going in. You’re doing strip-till. No-till is really pretty small. We’re going to have to have some tillage to magically get that seed and fertilizer into the soil. It’s a matter of the width of that and how we disturb it. In the soil, actually, the biology responds very quickly to a lot of the different things, but I do think that reduced tillage is part of this overall process. We see a lot of impacts when we till in the fall, CO2 being released into the atmosphere, that basically we release as much back as we stored the whole summer. We basically reset the counter to zero at every fall when we do intensive tillage. So, if we want to build it up, we’ve gotta get that piece out of the system. I think that will become part of it. I think that diversifying crops and getting more carbon from the atmosphere into the soil is another part of that. We could say, well, if it’s no-till, we just go to fallow without any tillage, and I guarantee you we won’t change the carbon any. We won’t release any, but we won’t store any because we need that biological system as part of it.

DAN FRIEBERG: Awesome. Is there any scientific debate about any of this? Is the science pretty locked down, as far as the carbon sequestration in farming systems?

JERRY HATFIELD: There is a great deal of debate, and I don’t think it’s going to go away. Part of this is people see different responses, and part of it’s climate-driven. If you think about that same practice that we have in Iowa and transport it to even southern Missouri, all we do is change the climate, and we won’t see near the response because we’ve had a temperature change. We have a lot more respiration going on. We have warmer soil temperatures. We have a different rainfall pattern, so we see all these different pieces. That’s one piece that adds variation to it, and then a lot of this goes back to these zones within fields. I mean, we see different responses. So, I think in a lot of our monitoring and everything, we need to recognize that there are different soils instead of looking at the field average and saying: “What are those different pieces, and how are they responding?” Then the argument is over: “Are you accruing carbon in the upper six inches of the soil, in terms of that magic plow layer? Are you putting it down deep?” Then, what form of carbon are we measuring? Are we measuring soil organic matter? A lot of this is in this particulate organic matter, which gets cycled very quickly, that a lot of people don’t measure. I think the scientific debate is going to continue along this path, but I think that we’re eventually going to settle in and say: “Here are some of the attributes around this, and let’s look at these attributes and not get hung up on saying that I use a red machine or a green machine to plant our crop.” I would think that’s where a lot of this gets in, and the same thing in terms of measurements. Did you make this measurement? Did you make that measurement? I often tell producers. They ask what the perfect soil health test is, and I say: “If you want to know if you’ve got soil health, just go out and look after your field after a two-inch heavy rain because if you can’t get two inches of rain into the soil, you don’t have soil health.” You’ve got all the aggregates that are stable. You’ve got infiltration going on, and everything else, and they go: “Well, yeah.” It’s kind of an aggregation of lots of different things that is there, and so it gets them to thinking about what they’re really looking at out there. Same thing in terms of yield that you mentioned. One of the pieces that I think if you see soil health, and why yields are a pretty good surrogate for that, is that when we improve our soil health, we see a lot more efficiency of nutrient supply and water supply late in that growing season. So, we see that plant maintain its green leaf area longer in the grain-filling period, both for corn and beans, even for wheat, as we begin to look at it. I think there are things that we could get producers interested in just looking at, to say: “What are some of the indications going on that you’re making a change in your system?”

DAN FRIEBERG: Do you see carbon credits as potentially a way to help pay and make the economics even for switching to cover crops and less tillage?

JERRY HATFIELD: If we can get the value of carbon credits up enough. I mean, I was just looking at some data the other day that were really good systems, maybe half to eight-tenths of a ton of this. If we’re only offering $15 a ton, that’s $12. It costs you $30 to put in a cover crop, so you’re still on the negative side of that, even though you can get the value over time. I think we’ve got to give back to producers. Again, back to your zoning question of saying, how do you really begin to look at profitability across the field, and saying, how do I look at increasing profitability in those poor parts of the field? Is that reducing fertilizer applications because you’re not getting return on doing other things? You could trade that input of fertilizers for the cover crop to be able to improve those. I think we need a different strategy about how we really go about implementing conservation practices across the field and accounting for the value of them and the potential impact, short-term and long-term. I think that therein lies some of the imagination that I think we ought to be using relative to farming systems. We tend to look at our conservation practices as kind of a generic sort of suite. We’ll just lay these on the field out there, but in reality, I think we need to be much more structured in thinking about how they’re going to work and how they could be implemented in much more of a dynamic way but also a way in which I think they would have much more of a lasting impact.

RENEE HANSEN: If a farmer is really skeptical of the whole carbon sequestration, what does he have to do? And is it going to benefit him?

JERRY HATFIELD: If you look at carbon from a benefit perspective, I don’t think we’ve talked enough about the benefits of carbon. We talk about carbon relative to carbon markets. We talk about sequestration but the value of putting carbon back into the soil. I often use this analogy, that if you get into carbon for the carbon market perspective, it’s like new running board money for your pickup. But if you get into improving carbon for the agronomic and efficiency piece, it’s new pickup money. That’s the orders of magnitude that we’re talking about because we see that improvement in yield stability. We take those low-yielding parts of the field out. I don’t think we’ve explained to producers the real value of carbon and why that’s so critical as part of the field, in terms of nutrient cycling, water infiltration and storage, even overall vigor of the crop. I think when we put those metrics around it, producers begin to see that these real changes are out there, but often we just sell it from the standpoint of carbon sequestration. It’s going to do good for the climate, which it does, but for the producer, they don’t care a whole lot about that. So, when we put it into that perspective of what it means for them, then I think it really becomes an important part of their decision process, and I think it’s an educational effort, as well.

Screen Shot 2021-02-16 at 4.46.24 PM
RENEE HANSEN: Absolutely. I think that the value just hasn’t been seen or believed by them yet to understand. There’s so much talk about carbon credits that they’re questioning, “Is this for real? What do I need to do?” It’s just another payment back to the grower. What do they have to do to get it, and what do they have to do to achieve it?

JERRY HATFIELD: Well, I think that a lot of this, in terms of achieving it, is that we need to realize that there are a suite of practices. Just don’t say, well, as we’ve talked about that, the only way you can get there is no-till. That’s one component. Reduced tillage is one component of the system, crop diversity and putting more crop longer through the growing season there. Even adding bio-based fertilizers, manures, compost, things like this, do a major impact on this because, ultimately, what we’re talking about is allowing the biological system within the soil to do its thing, in terms of capturing carbon and putting it into soil aggregates, putting it into organic matter. All those are the things that go on, and it really becomes a very fascinating puzzle that we’re trying to put together. To me, there is no one thing that is the magic solution. This is a very complex problem that we need to look at, and as we’ve talked about, it’s not something that you can say, even across a given field, across a given 40-acre field, that you’re going to see the same result if you did the same thing. So, I think we need to think a lot more judiciously about how we go about achieving our goals and looking at how practices and pieces and responses fit together. I think that’s part of that whole maturity of really evaluating our system and figuring out where we want to go and how we want to get there.

DAN FRIEBERG: Jerry, in order to change soil carbon, what’s a realistic timeframe? This is a long term. In the relative, it’s not something that changes very fast, right?

JERRY HATFIELD: Well, we actually see changes in carbon within one growing season. Now, measurement-wise, it gets a little difficult to pick that up, but we can see it because of changes in color. We can see changes in aggregates near the surface. Those are kind of the unstable parts of this. The stable parts are really much more in that two-to-five year timeframe. We really want to see depth changes. With depth, we’re talking about plus-10, and I think we’ve got to realize this, but things occur quickly. I was looking at some of the dynamics on root exudates relative to microbial activity, and those often occur within minutes of changing this. So, you look at all this, and I think we’ve got to realize that we’re dealing in a set of different time constants all the way across our platform. It goes back to the thing on soil health. What parameters are really changing within that? Because we know some parameters are going to change a lot more quickly than others. We see aggregate changes within a growing season. They’re not very stable, but they are changing. So, it’s a matter of what’s that time cost to get it to be much more of a stable aggregate?

RENEE HANSEN: Yeah, so if a grower wants to start implementing some of these, there’s nothing set in stone right now, of what management practices they should follow?

JERRY HATFIELD: No. I think when we go back, and we talk about why there’s so much controversy within the science community, it’s that there’s not a common set of practices. A lot of people, and this is one of my frustrations, really have not accounted for the fact of all the weather variation that occurred during their experiment. Sometimes, it’s the rainfall patterns that we talked about with the heavier soils, that we get these wet springs, and then we get dry summers. That really influences the response. Sometimes, we get dry springs, rarely, but we get wet summers, even more rare. I think that part of this is we’ve got to figure out how to start normalizing a lot of the different characteristics that are out there, and even in terms of cover crops. I mean, we talk about this. So, if you run a monoculture cover crop of rye, how large was that rye crop? People say: “Oh, I planted a rye cover crop.” Well, was it 3000 pounds of biomass? Or was it 500 pounds? Just because you had a cover crop doesn’t mean you all had the same efficacy. If you’ve got a cover crop cocktail with a small grain and a legume and a brassica mixture, what was the real biomass that was generated out of that? So, I think there needs to be a lot of normalization of, instead of just saying we did this, what was the real efficacy? Just going back to Dan’s comment in terms of yield, we need to look at the productivity of our cover crop system over time, and we have tools to be able to do that. I think that starts putting us on much more of an equal footing of saying: “Why do we see these responses across different places?” Well, it could be because we had different levels of input across that we didn’t even characterize.

RENEE HANSEN: So, overall, when it comes to carbon sequestration, does it pay for the farmer? Should they start doing it today?

JERRY HATFIELD: I think it does. I think it pays in lots of different ways. We start this path towards carbon sequestration. We change our infiltration rates. Let’s just start about: “What are we really trying to do in our agriculture across the Midwest?” It’s that we want to take as much precipitation and put it back through that crop to create yield. When we’ve got a soil that’s pretty fragile, and we have low infiltration rates of less than a half-inch per hour, if we can just improve the infiltration rate up to two inches per hour, then we get a lot more rain into that system. If I can get rain into the soil, I can store it, but if I can’t get it into the soil, it’s just runoff. So, I think we start with that, realizing that our whole goal in agriculture is to do two things. One is to capture sunlight, and one is to put as much water through that plant as possible. If we get our soil set up so that we’re doing those things, it’s going to pay dividends to us, so let’s think about that dynamic. Then, ultimately, you’ll end up saying: “Well, I’ll recycle more nutrients. I’ll do all these other things to kind of buffer against the weather variation that’s going on out there.” That’s the path that I think we need to be explaining to producers, of what carbon really is doing at various steps along the way. I believe that if we really want soils to be that carbon sequestering part, we need to be explaining to agriculture and producers this whole dynamic of carbon and how it’s going to benefit them in ways that they really haven’t thought about very much.

Nitrogen Strategies for your Fields

“It convinces growers to spread those nitrogen pounds out over the course of the season or minimally making more than one application, and they see improved efficiency. We’re talking about less pounds of nitrogen to produce a bushel of corn, and we generally see higher yields at the same time. So, it becomes a win-win.” – Mike Manning

RENEE HANSEN: Hey, Mike, welcome to the Premier Podcast. Today, we’re going to talk about helping a grower have a nitrogen strategy. So, first, I know you’ve been on the podcast before, but can you just quickly introduce yourself and tell us what you do at Premier Crop?

MIKE MANNING: Hi, Renee. Good to catch up again. Mike Manning, Premier Crop Systems. I’m our Nebraska Account Manager and Agronomic Information Advisor. I support some of our retail partners in a few different areas and work directly with a good set of growers across the state of Nebraska.

RENEE HANSEN: Thanks for that intro, Mike. Also, I know there are a lot of people who follow you out on the Twitter world, and you’re known as who on Twitter?

MIKE MANNING: DataManning. You can find me on Twitter @DataManning.

RENEE HANSEN: Perfect. Great. Well, thanks for that introduction. So, let’s go into this nitrogen strategy and why we believe that a grower and why you believe and work with growers who should have a nitrogen strategy. Let’s just take it from the first step of planning and having a plan and a strategy when it comes to nitrogen.

MIKE MANNING: Well, you hit it right on the head. First, we have to have a plan about how we’re going to go about applying our nitrogen or what our season-long plan is for nitrogen management. The simple answer is there is no one-size-fits-all solution, especially when it comes to nitrogen management. It needs to fit into your rotation. It needs to fit into your logistics, your available labor, how you’re going to manage different cultural practices and other tools that you have at your disposal, whether that’s equipment limitations, irritation or rainfall limitations, yield potential. All these dynamics play together. One I’ve left out there would be topography and soil types. Also very important. A lot of nitrogen plans probably have fallen under that cultural practice of what a specific area has been accustomed to doing. Some examples of that might be 100% of total expected nitrogen needs applied in the fall with anhydrous ammonia or spring-applied anhydrous ammonia. I’d say, really over the last 20 years, you’ve seen more of a move towards split application of nitrogen. There’s a fair amount of research that’s come behind that’s, I would say, pretty widely accepted in the industry now that split application of nitrogen is much more common than it ever used to be.

With what I work with in Nebraska, it’s almost universal. I know that’s not the case in some of the rainfed states and different management systems and on different soil types. I wouldn’t even say growers that are limited to owning their own equipment. Even one split application, maybe anywhere from 50 to 75% of their nitrogen upfront in the spring pre-plant or early post-plant and, then, a single side-dress application. Probably, more commonly, what I see for that nitrogen delivery method is some form of upfront pre-plant. Pretty common to come back with a weed and feed pass, where we have 32 or 28% nitrogen, potentially some Thio-Sul mixed in with an early post-planter, early post-emergence application. Then, perhaps another trip back across the field with a coulter bar at about V5. In the great state of Nebraska, with our irrigation, we tend to put it on season-long. We’d like to fertilize through our pivots, generally, at about 50% of our total N needs.

RENEE HANSEN: So, Mike, you’re talking, I mean, you’re going right into application timing. How does somebody plan for their application timing? Obviously, in Nebraska, they do have the capability to do that because they are working with a pivot, but for the rest of those who don’t have some kind of irrigation system, how do you plan for those different application timings? What are you looking at to make that plan? Are you using data from the past? Can you do it year one after you use the data, or do you need to be in a system for numerous years to develop a bigger plan, a bigger strategy?

MIKE MANNING: You’ve asked some multifaceted questions there. So, let’s kind of break that down one by one. Let’s just go. Let’s say we’re making the decision to go between a single application, like we historically have, and two applications. We’re going to split some portion of our total nitrogen pounds. The best way I explain it to growers is that our corn crop has a season-long nitrogen requirement. The closer that we can supply our synthetic nitrogen to that growing crop, or to the crop as it’s growing through the course of the season, the better efficiency we’re going to have. There are definitely places in Iowa and Illinois with very high organic matter, very strong holding capacity and some very nice flat-level fields. Dan Frieberg shared it many times in the past. Well, we kind of call it our surrogate data. Why are we seeing, in the group data, these 100% nitrogen fall-applied ammonia always showing up as the highest yielding in the database? Well, we were making those applications to some of our best fields that we could go place all that nitrogen at that time, in the fall, how to be available. And there are prime acres to begin with. The acres that were receiving a split application, or had some other balance of nitrogen pounds throughout the season, were those rolling hills mixtures of sand and clay and just more marginal acres that needed to be managed with a different stroke anyway.

Probably one of the biggest things I see, as it convinces growers to spread those nitrogen pounds out over the course of the season or minimally making more than one application, they see improved efficiency. And by improved efficiency, talking about pounds of nitrogen to produce a bushel of corn, and we generally see higher yields at the same time. So, it becomes a win-win. To what I think was one of your second questions: how many years of data do we need to have, or how do we arrive at our total nitrogen requirement? Again, we can kind of break that apart in a couple of different pieces. For somebody that is making a single application, I would say just take a couple of fields and plant a split application. Again, how does that fit into your labor and logistics workflow? For growers that own their own equipment with the sprayer, it’s pretty easy to convert. Not too much more difficult to incorporate a weed and feed side-dress nitrogen going on with your post herbicide. For guys that hire it out, that hire their spraying out, it might make sense for them to acquire a coulter bar and go make an application in season. Or at least go rent one and try it. Take a handful of fields and just try it for a couple of years. Now, if you have 6% organic matter on perfectly flat earth, you’ll probably completely disagree with me. If you farm anything other than that, I would put my money on split applications just about every time.

RENEE HANSEN: The split application is really becoming more popular. You mentioned that in the beginning of this podcast, that you’ve definitely seen the trend move the line more towards split applications. So, you did mention this also about nitrogen efficiency based off of the field. So, can you talk about why having a plan, a nitrogen strategy, how that makes you more efficient with your nitrogen to gain more yield?

MIKE MANNING: Combination of factors. I’d say, bottom line, it does. A split application helps us be more efficient, but if we’re measuring the results off of our farm, we can actually see what those real efficiency values are. With Premier Crop, we talk about zone management a lot, managing fields by zones. Zone management makes sense. Just for my standard disclaimer on that, we’re not talking about zone soil sampling. We still have a grid soil sample underneath of that. One of our favorite methods for arriving at Management Zones is principally looking at historic yield data. For the most part, the best area of the field has always been the best area of the field. The poorest area of the field has always been the poorest area of the field. Using other pieces of spatial data to maybe augment that, whether that’s grid sample data, EC, EM data, soil survey maps, where applicable. We can use that to help augment and guide zones.

So, now we think of our traditional Premier Crop ABC management zone approach. We start seeing efficiencies. You start breaking that out year over year, especially in those corn years. If I see consistent efficiency of, say, 0.75-0.8 pounds of synthetic nitrogen per bushel produced in my A zone, maybe 0.9 or 1.0 in my B zone and maybe anywhere from 1 to 1.2 pounds of nitrogen in my C zone, I see that consistency. We can confirm our zones. A, we know our zones are behaving how we believe they ought to be behaving. B, we’ve dialed in management, probably with a variable-rate seeding approach, as well. And C, now we can start incorporating these nitrogen efficiencies that we’re observing within the field. That becomes, well, A becomes an efficiency driver. And, all of a sudden, let me do some quick math. If I’m producing 280 bushels in my A zone, but my efficiency is at 0.7 pounds of nitrogen, I really only needed 196-200 pounds of synthetic nitrogen in that A zone. In that C zone, that’s at 1.1, and it’s producing 225. I probably needed 240-250 pounds of nitrogen in that C zone. At the end of the day, it’s spatial management. As things change in the field, we’re adapting our management to it and, then, marrying economics and efficiency back to it. Now, it also ties right into sustainability. We’re being a lot more — we’re just being smarter with how we’re applying fertilizers on our fields.

RENEE HANSEN: Mike, that was going to be my next question to you, and I think you already answered it. When it comes to nitrogen and efficiency, it couples the economics, so profitability for the farm and sustainability to the land.

MIKE MANNING: Absolutely. It’s agronomics, economics and the sustainability piece. Agronomically, we’re producing good bushels. Economically, we’re doing it very efficiently. Sustainability-wise, we are being good stewards of the land and being good stewards of our fertilizer resources.

RENEE HANSEN: Lastly, can you talk a little bit about what Premier Crop is doing with what we call Enhanced Learning Blocks and possibly what you can do with a nitrogen strategy?

MIKE MANNING: Sure. So, Enhanced Learning Blocks, I’m pretty passionate about Enhanced Learning Blocks. I’ve been using them widely since 2016. I haven’t done a ton with nitrogen, but there’s certainly an opportunity to do that. So, an Enhanced Learning Block we’re taking builds off the traditional Learning Block concept.

Screen Shot 2021-04-20 at 4.44.41 PM

Let’s take a two or three-acre block in a known area of the field, and let’s change our rate. Let’s go up or down. Well, enhanced learning blocks enabled us to introduce both randomization and replication. So, instead of testing a single rate in a two or three-acre block, let’s test three or four different rates and then replicate it five times. So, now, in the case of nitrogen, if I was, say, on a side-dress application, I was coming in with 30 gallons of 32%. Let’s pull up 28.005. So, if I was at 30 gallons there, I’m looking at about 90 pounds of nitrogen. Within that enhanced learning block, maybe it’s about four acres in size now. Let’s test rates at 20 gallons, 25, 30 and 35. Or 25, 30, 35 and 40. This system — we build it into the prescription system — enables that application to execute in the field. Then, we can have statistically valid nitrogen response results to review at the end of the season, and that becomes very powerful. What is the right rate? Obviously, one trial one year from one field is not going to answer the question for your entire farm, but it starts you down that path of learning. In many cases where I use Enhanced Learning Blocks with my growers, we have multiple blocks where you have anywhere from one to five blocks per field, and we replicate that on just about every field they farm. So, they’re building a research quality data set off of their own farm with their precision equipment. I’ll leave it at that. Nitrogen management and how nitrogen behaves in the soil, in the environment, and how it performs agriculturally, agronomically for us, is probably one of the most complex aspects of agronomy. Again, just to reiterate, there is no one-size-fits-all solution, but it is about tailoring and optimizing things that best suit your farm.

RENEE HANSEN: And that’s why having a nitrogen strategy and building that with an agronomic information advisor like you, Mike, is really helpful because you have the knowledge. You see the data, and you can help the grower learn, year over year, how to best get the best profitability and sustainability on their land.

MIKE MANNING: Absolutely.

RENEE HANSEN: Thanks for listening to the Premier Podcast, where everything agronomic is economic. Please subscribe, rate and review this podcast so we can continue to provide the best precision ag and analytic results for you. And to learn more about Premier Crop, visit our blog at premiercrop.com/blog.

Learn more about soil health.

Use Agronomic and Economic Data to Make Management Decisions

At this time of the year, it’s easy to feel like yields are largely a function of weather – temperature and rainfall. Over the years in hundreds of grower meetings, I’ve heard that sentiment repeatedly. If you are inclined to think that way, think about this scenario.

Imagine a flat 160-acre field in your area, farmed by the same grower for 30 years, is going to be auctioned to the highest bidder. The field is unique in that it is all one soil type ( I know there is no such field in most areas – but we’re pretending so please play along). Pushing for the highest value, the auctioneer splits the field into two side-by-side 80 acre tracts – selling the field fast as two 80’s and then as 160.

The price received as two 80’s is higher, so the next year two different growers farm each of the 80’s. The entire field was soybeans the year before, so both growers planted corn in the first year farming their new purchase. Both will receive the same growing degree units and virtually the exact same rainfall. So, how much yield difference could there be between each of these two 80’s the following harvest?

Screen Shot 2021-08-05 at 2.24.22 PM

Over the years, I’ve used this example with growers in small group meetings and usually the answer is in the 40-50 bushel per acre range – sometimes as high as 75-80 bushels per acre difference!

How can there be that much difference? Simple. It’s because management matters. Our goal at Premier Crop is to encourage you to use your agronomic and economic data to make better management decisions.  With over 20 crop years in the books, we’ve seen it over and over again – similar soils and weather but dramatic differences in results. Usually, it’s not one decision, but the combination of multiple decisions.

Yield by Variety by Soil type-01

When it comes to hybrid and variety selection, it’s common to find 20-30 bushels per acre differences on the same soil type and same weather events. A starting place is to look at your own hybrid and variety performance data by soils – both at a field level and across your entire operation. Your data can be a guide for not only making next year’s hybrid and variety selections, but also where to place specific genetics. The more data you collect, the more you can make data driven decisions. Applied fertility rates, planting dates, planter performance, trait packages, soil test levels, planting populations are examples of some of the critical agronomic decisions you make every year. You might be able to hold Mother Nature accountable for the first 50% or even 75% of your yield results, but the other half (or less) and all the profit is your responsibility.

Fall Tillage Practices and Cover Crops

In my area of Iowa, primarily in Mitchell County, the adoption of strip-till has been huge. There were three or four people that started in the early 2000s, along with my dad, that were pretty vocal about what they were seeing and what kind of benefits they were getting from reducing tillage and going to a strip-till pass. I would love everybody to switch to strip-till and then to no-till down the road, but I understand not everyone is in that mindset. Many growers want to keep doing things the way they have always done things. That’s not always bad, but from a long-term farming standpoint, I believe there are benefits to doing things differently when it comes to soil health and keeping soil around for the next generation of farmers. It’s a mindset change, and it has to be the grower’s decision. 

Continue reading