Dig Deep into Data

One of the services Premier Crop provides growers with is community or group data analysis from a regional basis. Growers can confidentially and anonymously share their field data with other growers in their region though written data-sharing agreements. Group data analysis compliments field- and grower- level analysis; growers receive actionable field intelligence they can use on their own fields.

At Premier Crop, we are constantly challenging growers and their advisers to dig deeper into their data. For example, a few years ago one of our customers, a grower we will call Bob, wanted to use data to make decisions on trying to capture the 40-cent-per-bushel early harvest pricing premium his local ethanol plant was offering. Bob’s data analysis considerations started out with the yield penalty for planting earlier-maturity hybrids in his area.

Current and historic data analysis of his and other grower’s data in bob’s adviser’s 100,000-plus acres of multi year group-data database showed a consistent 15 bushel per acre penalty (185 vs. 170) for planting early maturities over the past five years. The adviser and the grower calculated that he needed a 35-cent-per-bushel premium to break even.

Bob’s second question was whether the yield penalty was universal across all soil types. His adviser added soil type to the relative maturity query and the results showed a 10-bushel disadvantage on the lighter soil types, which was about 25% of the grower’s operation. The overall yields weren’t as high on the lighter soils, which might be part of the reason why the penalty was lower.

Planting earlier maturities on lighter soil-type fields dropped the break even premium to 23 cents per bushel – offerings potential $30-per-acre advantage to planting and early-maturity corn and capturing the premium.

The adviser suggested they do even deeper and look at planting date, as well. The adviser’s instincts led to and even more powerful discovery. The reward to earlier planting was (18 bushels per acre) more significant on the lighter soil types than the normal and heavier soil types (10 bushels per acre).

premiercropblog_databyyieldandsoils

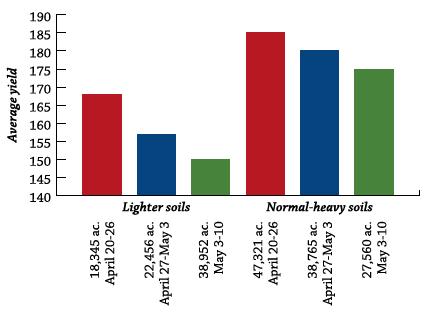
That latest discovery didn’t make senses first. Like many growers, Bob liked to plant his “best” fields first – the best being those with the highest yield potential. Because the lighter soils had less yield potential, they tended to be treated as secondary ground. But as Bob and his adviser considered what the data analysis was showing they realized that later planting dates meant pushing pollination back into the hotter and drier weeks of summer. The lighter soils didn’t have as much water-holding capacity as the normal and heavy soils, which were better able to handle stress without losing yields.

So, do you think Bob planted earlier maturity corn on his lighter soils first and captured the early harvest fall premium? More than likely, but I’m not positive. However, I do know the entire process led to the purchase of an additional planter. The planting date analysis was so overwhelming it was easy to justify the addition of equipment needed to plant all his acres earlier. As convincing as the analysis was on the lighter soils, Bob was unwilling to potentially lose 10 bushels per acre on his best soils by switching planting order.

And imagine his delight in being able to use data to justify to his wife why buying more equipment was the right answer!

Got Data?

1. In what parts of your operation, are you looking for actionable data to help mae a tough decision? Keep digging into your data. More than likely, the “first layer” is only a step in the right direction. Although it may take more time, digging into a second and third data layer may provide discoveries that are well worth the effort.

2. What areas of your operation can you gain efficiencies? Ask you trusted advisor to help you dig through some not-so-obvious data layers to find savings.

Success in VR Seeding

I try very hard to not fall in the trap of “geek” talk. It’s a special challenge, as we are a company full of geeks! Even though we hire a lot of “normal” people, within a year we typically convert them into farming geeks/nerds. They still look normal, but they aren’t. I describe what we do as the collision of agronomy and technology. It’s the technology side that leads us to becoming geeks.

One word I’ve tried so avoid overusing is “spatial” – rhymes with racial – defined as relating to space and the relationship of objects within it. Precision ag tools allow us to map spatial differences within a field; yields and fertility are common examples. For many, maps have been a powerful way to visualize the spatial variability that exists in most fields. For some, these maps confirm that we’ve always known to exist – significant differences within fields. For almost a decade, Premier Crop and our customers have experienced terrific success in creating value for growers with variable-rate seeding prescriptions. Our process is simple. Create management zones by identifying the best part of the field, where you want to be more aggressive (A zones). C zones or other lower letter zones are usually used for lower-yielding areas, where being more conservative with seeding rates might be warranted. B zones end up with the “average” part of the field – neither great nor limited.

premiercropblog_variablerateseeding_managementzone_population-1

Now with millions of acres successfully and profitably variable-rate seeds, one observation worth sharing is that is is very rare to a management zone to run in a straight line from one end of a field to the other. This management zone map is the rule, not the exception.

In our company’s early years, we did plenary of strip trial approaches where treatments and checks ran across the entire field. But we came to understand that most strip trials are running treatments across tremendous spatial variability, which is frequently ignored in the analysis. Averaging the results for treatment strips and ignoring the effect of spatial differences tends to mask what is really happening. Gains in the A zones can be “averaged” down by the results from C and D zones.

For many, analyzing variable-rate planting with strip trials has resulted in conclusions that aren’t positive for the practice. Our results and experiences have been the opposite. Using higher and lower Learning Blocks within management zones and analyzing yield results has led to even faster adoption.

How to Use Management Zones

Management Zones are defined as, similar agronomic areas in a field that are created from a combination of layers. These similar agronomic areas can be used to manage inputs and data to analyze better efficiency and return on investment to your farm.  At Premier Crop we offer a user-friendly way to bring these layers together in one platform and help you make confident decisions from your data.

Create Zones – How you create zones depends how you intend to use the zone once it is created. There are many valuable data layers, the more layers and confidence you have, the better the zone and more useful it will be. If you are new to data management and have not collected many data layers, a few simple layers such as soil test attributes, one to two years of yield data, and even a NDVI image can get you started. As you build data layers such as yield and soil fertility you can start defining management zones to be more accurate. The more history you have the more refined the management zone will be to give you more confidence for variable rate prescriptions such as planting and fertility.

get started with management zones

Using Management Zones –   Management zones have been the catalyst in creating yield synergy across hundreds of thousands of acres in our system. Yield synergy is defined as applying the right rate of multiple products to achieve a higher return in specific parts of the field, rather than applying more or less of one product at one rate on a whole field. Developing the right rates is calculated by incorporating your management zones into all of your prescriptions. Each zone will have a specific calculated rate per product to be applied based on its productivity. If we know that you have a high yield environment, we have proven with our replicated randomized trials, called Enhanced Learning Blocks, that we can increase fertility, population, and crop protection products in these areas to push that environment to a higher yield. We also have experienced in lower producing zones, not only a savings on input costs, but also yield increases due to less plant crowding with lower plant population and better use of fertility management. Now that is a huge win for your bottom line!

create yield profit from management zones

Analysis:  This is where Premier Crop is different because we analyze how your management zones and prescriptions performed. We prove if the products, population and rates were profitable. Management zones can have little value if you don’t have a good platform to analyze them.  Once you build your zones, Premier Crop can take a deep dive to understand how each zone is delivering value across your field and your farm. Our management zone reports can identify what variables are affecting yield and profitability, we prove if the rates worked. Premier Crop generates an easy-to-read report that shows what you did in each zone agronomically and how yield responded. We then break it down to see what the top correlating factors are in each zone to identify what we can continue to improve. Utilizing Premier Crop’s cost/bu analysis per zone helps you understand your field’s true ROI and prove that by increasing or decreasing input dollars in the right areas of the field can make you more margin.

corn cost per bushel by management zones

Management Zones can provide great value to your operation when created, implemented and analyzed correctly. Premier Crop Systems platform is built to meet any grower where they are to create management zones using their data.  Whether you have years of data, or a 60-year-old soil map, we can help you be more profitable. Don’t get stuck using a system that can’t provide analysis of its work or prove your results. Premier Crop Systems is proud to be your partner on your path to higher profits.

Real Agronomic Complexity

Several years ago, I had customers tell me we could grow our company a lot faster if we had something like their planter monitor that flashed the dollars being lost from poor singulation. We needed something visual on a display, changing as growers moved across their fields to get their attention. Something cool.

Back in the days of overhead projectors, I remember seeing a slide of rain barrels with each stave labeled with a different nutrient and various heights. I later learned that the rain barrel illustration is centuries old, made famous as Liebig’s law of minimum: Plant growth is controlled not by the total resources available, but by the scarcest resource or limiting factor. The message of the rain barrel is that over-applying one nutrient won’t pay if another nutrient is more yield-limiting. For example, applying the latest micro nutrient blend isn’t likely to do you any good if your phosphorus and potassium levels are low. The rain barrel was a great illustration of the need for balanced fertility.

In the real world, the crop production rain barrel has many other staves that can be just as yield-limiting as nutrients: hybrid and variety selection, insect control, seeding rate, disease management, tillage compaction, crop rotation, planting date, soil type, drainage, and the list goes on and on. Identifying and managing what is profit and yield-limiting in parts of each field is the ultimate goal of analyzing your data.

premiercrop_blog_agronomiccomplexityrainbarrel

Your inputs aren’t just nutrient, seed and crop protection products. Your only choices extend to your equipment choices and data recorded from your equipment can represent additional staves in your crop production rain barrel. Singulation, downforce and downforce margin are additional data layers that companies like Premier Crop now analyze, along with “normal” data layers collected with your planter, like seeding rate and logged hybrid or variety. But what does your yield data say about the relationship between singulation and yield?

How do you explain what seems to be profoundly obvious in the planter cab as the monitor flashes negative dollar amounts, when it’s no longer apparent at harvest when comparing that planting data to your yield results? One obvious answer is that your planter data is more refined than your yield data. Your planter monitor can tell you how each row or your 24-row planter is performing, but your combine head aggregates 12 rows into one yield measurement at the yield monitor.

But there may be other reasons why idea singulation doesn’t always seem to be driving your yield results. As important as getting the picket-fence-perfect stands is, in many situations, singulation may not be the variable that is most yield-limiting – the lowest stage in that fields or part of a fields rain barrel.

I am a believer that agronomic common sense and real-world observations tell us that avoiding doubles and poor seed spacing is critical to higher yields. But they are only a few staves in a very complex agronomic rain barrel, and the dollar signs flashing on the monitor screen are only real if proper seed placement is your lowest stave. Searching for profit-limiting variables will lead you to collect and analyze as many layers as possible, and to create “deep” data sets for each of your fields. Anything less would be to pretend that what is truly complex, is not.

The Best Tools to Increase Farm Efficiency

Some questions that get asked often about precision ag, and precision tools in general, are “what makes sense for my operation?” or “how do I get started?

The best way to answer these questions is by evaluating your current situation.  How you respond to the following questions should guide you toward your next logical ‘precision ag steps’.

  1. Do you have spatial soil samples (grid or zone) on any of your fields (<4 years old)?
    Are you making variable rate fertilizer applications based on these samples?
  2. Does your combine, or your custom harvester’s combine, have a GPS equipped yield monitor?
  3. Is your planter equipped or capable of variable rate seeding?
  4. How are you evaluating or verifying your current production?
  5. How are you evaluating or verifying the efficacy of your precision ag tools?
  6. How are you evaluating the economic return of your farm? Individual fields?
    “across your entire operation?  Agronomically, and economically?

I consider a good spatial soil sample the foundation of precision ag.  By definition, precision ag is all about site-specific management; measuring, analyzing, and managing field variability.  As mentioned in our previous blog post, Buyer’s Remorse, states the definition of precision is; the quality, condition, or fact of being exact and accurate. What better way to start that with a spatial sample?

Two predominant methods prevail in the spatial soil sample world; grid sampling and zone sampling.  In my experience, I consider the 2.5 acre grid sample the best ‘right-size & high resolution image’ of soil fertility you can collect.  While other grid densities and zone approaches work in different geographies (and can meet your needs in different growing environments…dryland Kansas or dryland Saskatchewan wheat come to mind), the 2.5 acre grid sample offers what I consider the best match of agronomics and economics.  It typically provides the “Goldilocks” scenario of high sample resolution, enabling you to see what’s going on within the field, while being cost effective for the grower.

grid soil sample benefits

grid soil sample benefits at 2.5 acres

Your number one priority with any spatial soil sample is to measure the variability of soil fertility within a field.  Regardless of how uniform a field may appear (table-top flat, same soil type, negligible topography change), universally, soil fertility is variable, ceteris paribus.  More importantly, through your years of farming that ground and perhaps yield monitoring, you know yield is also variable.  By measuring and understanding this variability, you can begin formulating successful variable rate fertility plans (VRT).

Spatial soil sampling and VRT, in and of themselves, may not save you money at the outset.  However, they will make you more efficient in the long run by reallocating the fertilizer dollar where it needs to go within the field.  In almost every flat-rate situation – we over-apply our poor areas and under-apply our best areas. This leads to input waste in the poor areas, and uncaptured yield potential in the best areas.  By adopting a sound VRT approach, and working with a trusted agronomic advisor, we can optimize both our fertilizer spend and our overall yield potential.

variable rate technology benefits and roi

In future articles, we’ll discuss the benefits of variable rate seeding, determining the right seeding rate, yield data, Management Zones, and whole-season systems based approaches, that incorporate all aspects of VRT, VR seeding, in-field trials, and comprehensive yield, agronomic, and economic analyses.

Getting Started with Variable Rate Prescriptions

The Greek philosopher, Heraclitus, is quoted as having said, “there is nothing permanent except change.” If that is the case, why do we fight it so hard? I believe the answer is because we are comfortable with where we are. In our comfort zone, we know exactly what to expect day in and day out, but in our desire to be comfortable, we remain exactly the same. If we don’t continue to learn and apply our new learned knowledge, how will we get better?

If we continue to stay the same with our farming operations, we know the likely yield outcome of our current practices. This can be a comforting thought but in our desire to be comfortable are we actually getting left behind?

there is nothing permanent except change in agriculture

Knowing what will happen with what we are currently doing is not the same as knowing if we could be doing better? Let’s talk about fertilizer, specifically. We know that each year we put on X amount of fertilizer and get X amount of yield. How do you know if that is your optimum rate? Could you put on more and receive more yield? Could you back down and not lose yield? Are there areas of the field where each of those scenarios would work? Do you know what the economic gain or loss is in each of these scenarios? Do you think switching from flat-rate application to variable-rate application is too hard? I’m here to tell you, it’s not hard and you can start working your way to answering these questions today.

Before we get into the easy process of starting to variable rate, let’s discuss the reasons WHY you should have a variable rate fertilizer and the 4R nutrient strategy. For those who don’t know, and as a refresher for the rest of us, the 4Rs of nutrient application are Right Source of fertilizer applied at the Right Rate at the Right Time and in the Right Place. All of these practices make us good stewards of the land which provides for us, but it’s also important from a data perspective to understand how these different practices affect our operations, our fields, and our bottom line.

four Rs of nutrient stewardship

Fertilizer is one place we have an opportunity to be more efficient with the inputs and dollars we have to invest on our acres every year. If you are flat-rating your fertilizer, you are likely leaving dollars on the table. Getting started with variable rate fertilizer does not need to be a painful process, especially with a trusted advisor to walk with you through the process.

The first step to getting started variable rate applying your fertilizer is to get a clear understanding of what your goals are for each field, or even better, developing a unique zone within a field. Do you want to fertilize for your yield goal(s) in each zone for the coming year? Or do you want to fertilize based on what your yield removed the past year? Maybe you want to fertilize to build to a certain soil ppm over 2-4 years? Or some combination of all of the above.

Once you and your advisor have decided on a course of action that supports your goals, together you will create or select an equation, called a prescription, to run on the field. This is where you might be hesitant of what the equation kicks out, what if it is a lot more than what you have been applying in the past or not as much as what you would normally apply? Fear not, again, this is not a painful process. We can adjust the equation to match the average ppm you would put on the field if you were flat-rate applying fertilizer. So if you are used to putting on 100 lbs of MAP, we can adjust the prescription to match the total amount of product, average units of nutrient, average cost/ac, or total cost.

Phosphorus prescription can be adjusted

By adjusting the prescription this way you are not applying any more or any less fertilizer than you have historically applied and are spending the same amount of money that you normally would. However, what is different is that we are being smarter about WHERE we are applying fertilizer based on WHERE it is going to give you the best return to reach your goals.

premiercropactiveprecvariableratetechnology

Now that you have invested in the variable rate method, it’s important to validate the rates you are applying. This is what Premier Crop does different than any other company, we test and prove the prescription to make sure it is the right rate. This is continuous learning like Heraclitus mentions, there is always change, so learn from it and adapt. Premier Crop will tell you if it is  the optimum rate for that area of the field and how you need to change. Again, this is very easy to do in the Premier Crop system using our testing trials called, Enhanced Learning Blocks. Enhanced Learning Blocks allow us to easily test fertilizer product rates (and much more) on your own acres to find optimum rates in each area of your field. It takes no extra work on your part to execute, all you have to do is farm, and it provides powerful insights to be more efficient and build confidence that you are investing your money wisely. It also confirms the right rate in each right place of your field.

Being confident in your investments, along with being a good steward is as easy as setting your goal, running an equation, adjusting it to your comfort level, and checking your work. All of this process is made even easier with the help of a Premier Crop Advisor. What are you waiting for?

Share Your Farm Data?

It’s hard to avoid hearing about the promise of “big data.” Thanks to Edward Snowden’s revelations, it is also easy to spin conspiracy theories. There are many big-data analytics examples cited, such as Amazon and Netflix. They suggest books and movies we may enjoy based on what we have “liked” in the past or what other people who seem similar to us like. Google, the National Security Agency and others evidentially collect data bout what we search, what and whom we email, and much more.

There seem to be several “values” from big-data analytics. Many companies’ goals are to monetize data through better value propositions to their customers, like selling advertising, how they position products, differential pricing, etc. Another goal is to reliably predict behavior. For example, Bob shares a common background and behavior as Tim, and Tim likes this brand; therefore, Bob must like it as well.

Reliably predicting behavior, better product value propositions and differential pricing are all examples of how companies could use your agronomic data. For example, your field soils are X, Y, Z and hybrids A, B, C outperformed hybrids Q, R, S on 85% of the X, Y, Z soil; therefore A, B, C is the best possible value proposition for you. That fact that your soils are X, Y, Z is “public knowledge” – because the soils database is public.

But a company might say, ” to really perfect our value proposition, we need your non-public agronomic data. Why don’t you send us your historic yield data, your fertility data, your management information, etc.”

What can it hurt? After all, they only want to help you. The reality is, we all share “our” data with other companies, either intentionally in exchange for a benefit or inadvertently because we wanted a cool app, and sometimes the trade-offs are worth it.

For me, the difference between consumer data sharing and sharing your geo-referenced agronomic data is profound. Your reading choices might influence what advertising you see; your agronomic data is your “business” data. There is nothing anonymous about GPS data.

Anyone with a tractor guidance system has heard about the different levels of GPS accuracy. Any of those accuracies are more than sufficient to provide site-specific data about your fields when you use a documentation system.

For Premier Crop, building a partnership to use data to make better agronomic decisions has always begun with this foundation: the grower owns the data, data is only pooled with permission, and even pooled data belongs to the growers who shared data. But Premier Crop’s history and operating principals don’t mean that’s the right way or the only way to use data to benefit growers.

premiercropoptixgroupdata

Sharing your data with seed, crop protection, nutrient or machinery suppliers can make business sense. These companies sell you products that are important to your business and profitability. Sharing your data to help them provide better recommendations may be well worth any trade-off. Most important is to think through those trade-offs and each partnership proposal.

Got data?

1. What are the partners going to do with the data? Perhaps more importantly – what will they assure you (in writing) they will not do?

2. Some of your partners may be fearful of missing out on the “next big thing” if they provide the wrong answers to your questions. What questions are you asking?

Learn more about data analytics here.

Discovering the Value of Efficiency in Farming

This blog builds on the information I shared in “What is Efficiency in Farming?”.  If you haven’t already, I recommend reading it first. If you have read it, here are a few bullet points to jog your memory.

  • Efficiency can be defined as achieving maximum productivity with minimum wasted effort or expense.

how to be more efficient in farming

  • Crop production efficiency (breakeven $/bu.)  is often overshadowed by one of its components: output (yield)
  • Understanding efficiency values (breakeven $/bu.) within your operation is important for making agronomic decisions as well as marketing grain.
  • To improve efficiency, inputs must be managed spatially (variable rate).  Flat rate additions or reductions in inputs can have a significant negative impact on efficient production, as yield is variable across the field.
  • Yield is a key component of the efficiency, but knowing what it takes to achieve a specific level of production takes you to the next level of understanding profitability.

improve corn yields and profit

Building from the topic of farm efficiency, let’s talk about margin. Unlike the efficiency calculation, which is a ratio, margin is expressed as a difference or variance. Revenue – Expense = Margin (Profit or Loss)

Being more efficient directly leads to improved margins or higher profitability.

Premier Crop’s Yield Efficiency Score is a new metric that incorporates both efficiency and margin into the calculation. The image below shows how a Yield Efficiency Score is calculated.

Yield Efficiency score to calculate farm margin

The two circles on the left side of the graphic represent Yield and a Benchmark Selling Price for the crop.  Multiplied together, gives us our revenue value. The remaining circles represent four categories of agronomic cost information. The Yield Efficiency Score is calculated by generating the revenue value (Yield x Benchmarking Selling Price) and then subtracting our variable input costs; nutrient, chemical, seed, and operational.  The result is the Yield Efficiency Score, which is a dollar amount (per acre) returned to land and management. You can also think of it as how much money you have left over to cover both land and management costs.

In the example calculation below we are leaving both land and management costs out.  A Yield Efficiency Score of $473.90/acre means that you have that much leftover to cover both land and management costs.  If the producer in this example is paying $300/acre cash rent, the simple calculation shows $173 leftover to cover management costs.

Yield efficiency score calculation

The efficiency aspect of Yield Efficiency Score comes into play when we analyze the information spatially, or within and across varying agronomic environments.  Harvest yield values change within a field, which equate to different revenue values. Input expenses also change with any variable rate applications. Harnessing this spatial variability is key to understanding how to drive for higher profitability in your operation.

By now, you might have a few questions related to Yield Efficiency Score.  Below are a few common questions I get asked regarding the new metric.

1) Why is Yield Efficiency Score a better metric to use for agronomic analysis? All yield is not created equal! What does it take (or cost) to produce a bushel of grain?  The combination of spatial agronomic data, both yield and inputs, and a benchmark selling price creates a new way to look at agronomic data.  Yield Efficiency Score is a $/acre value, and it is not crop-specific, which means it can be used in many different ways.

2)  Why don’t you include land and management costs in the calculation? Land costs can make up a significant percentage of total production costs in a cash rent scenario, and not all farmers want to assign an opportunity land cost to owned ground. Management costs can be challenging to calculate because different farmers have different family living expenses and varying management costs. Below is another example, now showing the impact land and management costs have on breakeven $/bu.

Each scenario has the same yield value, nutrient cost, seed cost, chemical cost, and operations cost.  As Land costs change, so does breakeven $/bushel. Notice that the Yield Efficiency Score does not change.

yield efficiency vs breakeven cost per bushel

Breakeven $/bushel is a very important value, but it doesn’t always provide the best agronomic apples-to-apples comparison.  This is especially true when you’re benchmarking against other farming operations that may value Land and Management costs differently than you.

3) How can I use the Yield Efficiency Score metric on my own farm?  

The opportunities to utilize your Yield Efficiency Score are endless.  As you become more familiar with the metric, you’ll think of many ways to incorporate the calculation into decision making on your farm.  Here are a few:

  • Crop comparisons – Because Yield Efficiency Score is crop-neutral, you can utilize it to compare agronomic information across crop types.  The example below compares an operation’s soybean Yield Efficiency Score to its corn on corn Yield Efficiency Score. Logistics, machinery capacity, time, storage, and many more factors are part of the crop rotation decision, but Yield Efficiency Score can be a great metric to reference and utilize in that decision.  Areas of the country that double-crop or have more sophisticated rotations will be able to utilize this metric even more!

Soybeans following Corn:

soybeans following corn yield profit

Corn on Corn:

Corn on Corn yield profit

  • Benchmarking your owned vs. rented ground – How do you currently compare your fields to each other? How does your owned ground compared to rented?  How does Landlord A’s ground compare to Landlord B? Would some fields perform better with improved drainage?  How do you have this conversation with a landlord? Being able to analyze your fields’ Yield Efficiency Scores, independently, allows you to group them into different categories and still have an apples-to-apples comparison.  This enables you to make more informed enterprise decisions on your farm.

yield profitability by field comparison

  • Hybrid / variety comparison – Historically, yield has been the basis for comparing hybrid and variety performance.  The example below shows two hybrids with identical yields, but nearly $40 / acre difference in Yield Efficiency Score.  Without utilizing the Yield Efficiency Score metric, a farmer or agronomist isn’t prompted to investigate or compare the two hybrids because output (yield) was the same.

premiercropblog_yieldprofitbyhybridvariety

Using our Yield Efficiency Score, to analyze the efficiency and margin, within each of your fields, will provide new insights on how to better manage your operation. When combined and compared against regional group data (anonymously), you will have robust metric for benchmarking outside of your own operation.

farm efficiency

Measure Financial Impacts of Agronomic Decisions

In farming and a pandemic – having the right denominator matters

Almost everything related to the Covid-19 pandemic frustrates me. From the ease at which the rich and famous can get tested while “normal” people are told just to stay home, to the media’s biases from opposite perspectives.

I live in Iowa, and earlier in the week, our governor and the state epidemiologist held a press conference on Covid-19. Part of their messaging was that not everyone that has the Covid-19 symptoms needs to be tested. The state epidemiologist said that 80% of us won’t have severe symptoms from Covid-19 and will recover fine at home.

I understand those messages and know they are being echoed across the country. We have a shortage of test kits, so it makes sense to use them for the most vulnerable cases.

But since our business, Premier Crop, is all about using data to drive decisions, I also understand that having quality data, and in this case, the right denominator matters.

Here is an example of recent Covid-19 analytics for the world.

11,277 deaths (numerator)/258,419 confirmed infections (denominator) = 4.36% world death rate

What if the “Iowa message” on who needs to get tested (for understandable reasons) is being repeated across the US and around the world? What if we are dramatically under counting/testing the infected population?  What if, at the time of that analysis, there were actually one million people with the Covid-19 infection in the world and the death rate is significantly lower?

is there such thing as bad data

I don’t have an “agenda” in the Covid-19 debate, but I get data analytics. How you measure is directly connected to how you manage. Bad data equals bad analytics equals mis-informed and sometimes wrong decisions. The ‘denominator’ matters!

Let me share an ag data analytics example below from one of our dashboards – benchmarking one of a grower’s 58 individual fields vs the entire farm operation. This field’s seed cost per acre (the denominator) was one of their highest at $107.34/ac – their seed costs/acre ranged from $97.48/ac up $112.03/ac. But when evaluated using, what I would argue is the right denominator, seed cost/bushel produced, this field was almost their lowest at $0.47/bu produced.

seedcostsperacre

How many conversations with lenders this winter have ended in frustration because of a one-sized-fits-all per acre spending limit on inputs. I think it’s time that we change how we measure our farming business.  Everything agronomic is economic and we can measure and manage both.

We can help you use your precision ag equipment and your data to stretch your input investments to the maximum in each part of each of your fields.

The pandemic analytics we are seeing every day in the news can have the effect of de-humanizing the sorrow and heartache that families are feeling as they battle illness and sometimes lose loved ones. We are privileged to work with many multi-generational family farms and we know how important that older generation is to the farm and to the family. Stay safe and keep all of your loved ones safe.

Determining the Right Seeding Rate

As the calendar turns to April, and the 2020 planting season nears, many producers are finalizing planting plans. Your planting operation (hybrid and variety selection, seeding rate decisions, and the execution of it all) will lay a critical foundation for your 2020 growing season.

Of all the fieldwork we do in a given year, planting is one operation we only have one chance to get right (assuming you’re not a fan of replanting). Aside from properly setting up and configuring the planter itself, one of the most important decisions growers can make is determining the best seeding rate for each of your hybrids and varieties.

Historically, and still common today, seed selection and seeding rate decisions have been based on a wide variety of available resources.  These frequently include seed plot data, ag retailer/coop trials (often in conjunction with major seed suppliers), seed advisors, and ‘neighbor input’, as well as a variety of seed company rate calculators available online. While a diverse selection of resources are available, how do you know if these seeding rates are actually suitable for your farm?

In 2005, as GPS-based variable rate planting entered the equipment market, Premier Crop introduced the Learning Block™ concept. Learning Blocks are  2 – 4 acre blocks placed in specific areas of the field (unlike strip-trials), giving growers and advisors the opportunity to test and verify responses to different seeding (and/or fertility) rates in a low-risk, easily executable experiment (IE +/- 3,000 seeds/acre). Combined with Management Zone based VR seeding, these Learning BlockTM trials opened the door for growers to measure and build their own population response datasets on their own farm. Importantly, Learning Blocks, also provided insight as to where those population changes should take place within the field.

In 2016, Premier Crop Systems unveiled a new tool called Enhanced Learning Block™ (ELBs)*.  Building upon the traditional Learning Blocks concept, ELBs allow for testing multiple rates within the same block, all while incorporating the hallmarks of traditional experimental design; randomization and replication. These randomized and replicated trials increase confidence in the trial results, which ultimately guide better decisions. Perhaps most important, growers and advisors can execute research quality trials, with their own equipment, and within each of their own fields.

How important is knowing the right seeding rate? Does it really produce any more yield? Does it really save me any money?  Am I any more efficient than I was before? The examples below illustrate the importance of determining, and knowing, the right seeding rate for each hybrid and variety on your farm.

In this field, we have two ELBs, each testing four populations, and replicated 5 times within each block.  Comparing the target rates to the as-planted rates, illustrates the equipment is very capable of executing the trials.

premier crop grower seed trials hybrid population

Reviewing the post-harvest analysis below, we instantly see the seeding rate had a significant impact on yield (for this particular hybrid, in this particular geography).

Does seeding rate impact yield? The yield difference from 32,000 seeds/acre to 35,000 seeds/acre is 11 bushels/acre!premier crop yield difference with 32000 seedspremier crop scientific data whisker chart


“DOES PLANTING THE RIGHT RATE SAVE, 
AND/OR MAKE ME MORE MONEY?”

Dollars and Cents

Accounting for seed cost, and using $3.50/bu grain price, knowing to plant this hybrid at 35,000 seeds/acre v. 32,000 seeds/acre is a $29/acre decision!

38,000 seeds/acre is technically the winner in this trial. However, is the additional seed investment risk (3,000 seeds @ ~$9.40/acre), worth the relatively modest gain?

Also, we see that pushing too far, to 41,000 seeds/acre, results in ~$35/acre loss compared to 35,000 or 38,000 seeds/acre.

premier crop seeding rate winner

premier crop whisker chart seeding rate net gain

The examples I’m discussing come from an irrigated Nebraska corn and soybean operation that has successfully executed over 175 ELB trials since 2016. In this case, the grower likely has more research quality, hybrid specific population response data, generated from their own fields, than the seed companies.

You can start building your own knowledge base for your own farm by incorporating Enhanced Learning Blocks™, and working with a trusted Premier Crop Partner, or Premier Crop Agronomic Advisor.  Aggregating your own ELB results can take your on-farm knowledge to the next level.

HYBRID A POPULATION RESPONSE

premier crop hybrid a population response

HYBRID B POPULATION RESPONSE

premier crop hybrid b population response

Contact Premier Crop to test your seeding rates. Our agronomic information advisors can help you build own ELBs in your own fields.


NOTE: *ELBs can go anywhere! They are not region specific. Our Partners and Advisors have placed over 3,000 ELBs the last two years in the US and Canada. ELBs can be used to test a wide variety of products including Fertilizer, Crop Protection, and Seed through a variety of application methods.

    • Dry Fertilizer Applicator
    • Planter
      • In-Furrow and starter – multiple rates or on/off
    • PRE and POST fertility
      • Sprayer, strip-till,  coulter bars, drop nozzles etc.
    • Crop Protection – Ground Applied
      • Fungicide
      • Biologicals
      • Other yield enhancement products