“Part of the value of what they get in the Premier Crop program is being able to see beyond their own operations. A lot of times, hybrid and variety is the very first thing they look for.”
– Dan Frieberg
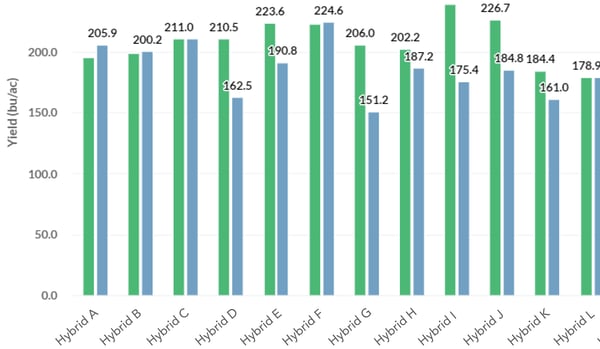
DAN FRIEBERG: I always think, from a grower’s perspective, that the first analysis that you do is your own. It’s what your own results were from that crop year. What worked and what didn’t? It’s understanding analytics by hybrid or variety across their operation. The reason that it’s really great at a grower level is that, sometimes, a hybrid or variety in data shows up having done really poorly at a grower level, but the grower knows where it was planted. They have the benefit of knowing that the reason that number did badly, or looks bad, was because I planted it on my three worst fields. It may have been that they picked the number intentionally that had more defensive characteristics because those are really difficult fields. So, I think just looking at how your numbers did on your own operation is maybe a starting place.
TONY LICHT: Maybe to build off of that, Dan, from there, once I do the analysis on my own operation, then I want to think about: “How did it do for others around me in a like environment, somewhere pretty close to me?” Because if it happened to do poorly for me, but I find out it did well for others, where did it do well for others? How can I correct that?
DAN FRIEBERG: Amen. Every grower in the system has the option of whether they want to be part of seeing anonymously beyond their own operation. Today, they all want that. Part of the value of what they get in the program is being able to see beyond their own operations. A lot of times, hybrid and variety is the very first thing they look for. They want to see beyond what their own experience was.
TONY LICHT: And depending on the number of hybrids or varieties they’re planting, sometimes if it’s planted on a small amount of acres, they completely forget about it. I mean, you think about the larger-acre hybrids, and it’s like: “Oh, I forgot about those new ones I planted. How did they shake up against the rest of my line?”
RENEE HANSEN: I mean, you’re talking about expanding beyond the operation, in a sense benchmarking against other areas or like areas. Can you explain or elaborate a little bit more about how Premier Crop utilizes the hybrid and variety selection with data? What does that potentially look like? Or what is the conversation with the grower?
DAN FRIEBERG: Renee, it’s kind of unlimited sorts. Initially, a lot of people might focus on soil types. If they have dominant soil types, it might be just hybrid and variety performance on different soil types. In some markets, for example, pH can be a huge driver on soybeans. High-pH areas or low-pH areas can have a huge swing, and varieties respond differently in those environments. Those would be two examples of how people get started, but they probably don’t stop there. They look at things like planting date or harvest date. So, if you’re a large operation, what inevitably happens is you end up with some fields that you know are going to be harvested last. So, for those numbers, Renee, they might drill down on late-harvest data. They’re trying to pick numbers that they know will stand and hold the ear late into harvest because some field has got to be harvested last, and a lot of growers literally plan. They plan their harvest by the way they plan their planting. There are certain fields that are always going to get planted first. In the case of harvest, there are certain fields that are going to be taken out first. It might be the ones that are closest to the bin site. They want to get the bins. They want to get the dryer going, and so there are certain fields that will come out early. A lot of times, those fields that come out early will probably get more of a racehorse number that doesn’t have to stand. It’s the highest yield potential because they know they’re going to get it before they get very far into harvest.
TONY LICHT: As-applied fertility can also be another environment they may want to look at, as well. How did I treat this group of corn hybrids differently on as-applied nitrogen, maybe split treatment or in-season treatment, versus just “all in the fall” kind of a concept? Are there differences amongst the hybrids and varieties now? How did they react to the environment they were in, whether it be as-applied fertility or soil test fertility?
DAN FRIEBERG: What we do is just adding another source of analysis to what a grower considers. A lot of times, their decision is if something did exceptional for them, they’re probably going to plant it again, obviously. They’ll look beyond their own operation to see and make sure it wasn’t a fluke or see how it held up in other environments. One of the advantages we have is that we can tend to see the hybrid and variety performance in different growing environments in the same year, meaning that you might’ve been in a really dry area, but you can go look and see how it did in a normal area. Or you happen to be unfortunate and you got hit by the wind, and so, sometimes, you want to jump out of your area because your own data isn’t as meaningful, just because you had something that happened that didn’t make your data quite as useful.
TONY LICHT: I was just going to say that’s a great point. Case in point: the wide area this year that got hit by the derecho. Those folks don’t lose data for a year. They still have the ability to build on data, albeit from a little bit further than their real local geography. It might be from 20 miles away in an area that was not hit. It could still be considered a like-agronomic environment.
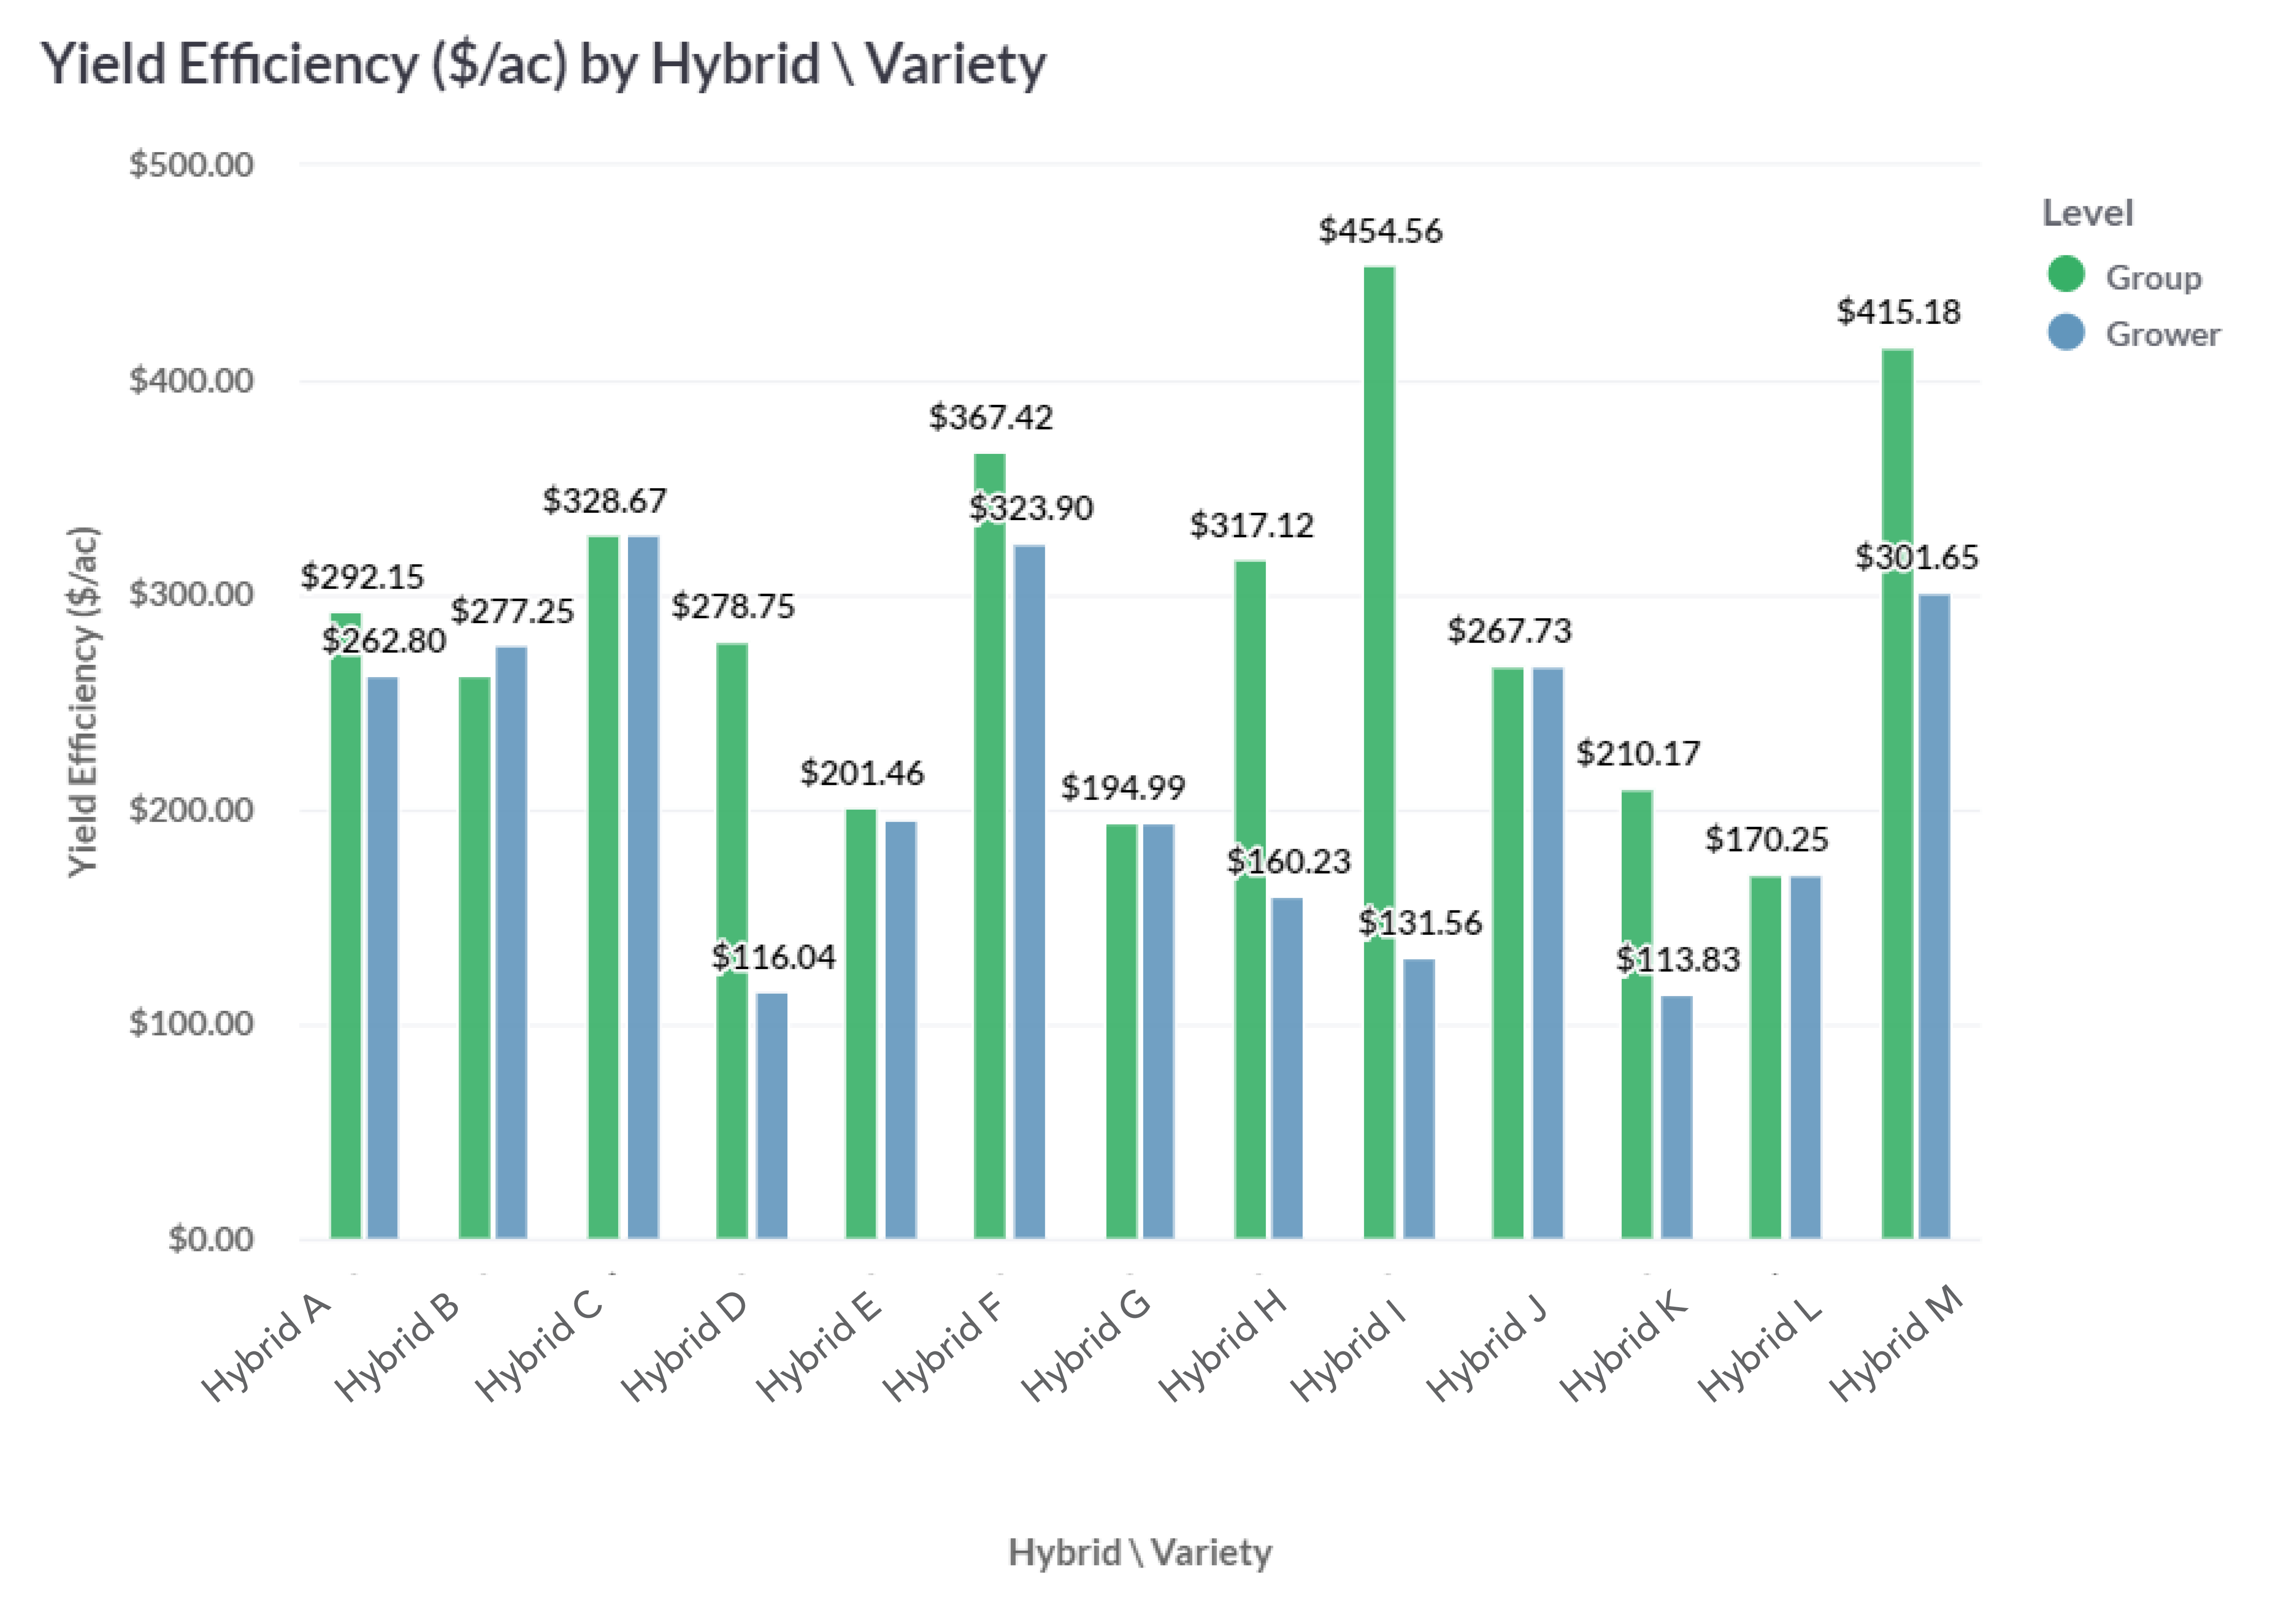
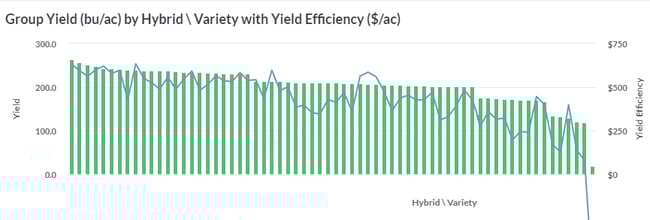
DAN FRIEBERG: There are really big dollar swings because we’re measuring the economics and the agronomics. The reason people focus on it a lot is, at the end of the year, there are just really big dollar swings on a per-acre basis. It could easily be a 100 dollar-per-acre swing in return to land and management or what we call yield efficiency. You can just see really large swings. When you start analyzing that way, from my perspective, it probably leads to having a strategy where you call more aggressively. I grew up on a livestock farm and the term “cull,” “culling the herd.” In the livestock industry, you’re just constantly eliminating the low producers. When you’re making genetic selection, you’re eliminating the bottom 20 percent or whatever. In the case of hybrid and variety selection, I think, sometimes, we need to be more aggressive about calling some of the poor performers out if we’re really focused on trying to drive the highest returns.
RENEE HANSEN: You both were talking about data. Can you elaborate a little bit more on the data features that Premier Crop measures hybrid variety with?
TONY LICHT: Everybody always thinks of just yield by hybrid and variety, but there are a lot of other attributes that come along with that hybrid: relative maturity on the chemical resistance or the seed disease resistance, as far as rootworm traits, non-rootworm traits. All those things come along with it. So, the conversation goes beyond not just a yield by hybrid, but maybe there was a specific trait that really helped drive yield, or a certain plant date helped drive yield. What are the trends I can see across my farm from a given year, and then also across a series of years, as well?
DAN FRIEBERG: Over the years, you’ve lived through some of the trait issues, just where we had areas where the rootworm trait wasn’t holding up. We ended up going through several years where needing a rootworm insecticide was a big part of the strategy and a big return for growers.
TONY LICHT: Absolutely. As a grower, do I need to do a double approach here? Not just the trait, but seed-applied insecticide, and where? And what can I expect from those people that have been utilizing that? What has the success rate been for them, to determine immediately, like: “Okay, well, here’s kind of a return on investment I can expect to get back out of this.”
DAN FRIEBERG: The trait thing probably also comes up as people shift in herbicide strategies. Renee, people would use the data to try to quantify differences in herbicide if they’re considering Liberty or if they’re needing to rotate strategies from any kind of a pest management or weed management strategy. That’s another piece where they drill down in data a lot, just to try to find the best performing genetics, as they’re switching strategies.
RENEE HANSEN: So, what would you say is the benefit to having all of this data to a grower who is utilizing Premier Crop Systems versus somebody who isn’t?
DAN FRIEBERG: It’s even the growers we work with, Renee. We are one part of how they make decisions in the seed world because, a lot of times, they have seed sellers who they really trust. They have long-time relationships in local communities with seed advisors. So, a lot of times, the seed advisor is there, too, and most growers will want to plant 20 percent of their acreage to something that’s new because every year there are new genetics coming out. Unless it’s been planted commercially, we don’t have any data on the new numbers. A lot of times, that’s what happens. Their local seed advisor or seed seller is positioning what they know about the new genetics from plots and what they’ve seen in small quantities as it got planted in the pre-commercial years.
TONY LICHT: A team can definitely help that grower out. We’ve always said that agronomy is local. So, that local knowledge with that seed advisor, combined with a lot of data points from a given area, can just help amplify the value proposition for the grower in getting the right seed on the right acres.
RENEE HANSEN: Yeah, and since we have a lot of data in our system, we clearly have seen. Over the years, with all of the data in our system, have you seen trends? And what are they?
TONY LICHT: There have definitely been trends in certain geographies of a stronger yield correlation by later maturing hybrid. But within that, there are all these “gotchas,” where there are a few early-season hybrids that perform within those environments very, very well — whether it be later maturing hybrids going further north or earlier maturing hybrids going south. So, definitely looking at not just a multi-year, but looking within and across those different years individually, trying to pull out those trends of what hybrids can be moved around either north to south to accommodate diversifying a grower’s portfolio.
DAN FRIEBERG: In the early years, you could literally see in the data. Sometimes, when companies had trouble with trait insertion, the non-traited versus the traited, you could actually see a yield decrease. I mean, companies are getting way better at that. I don’t think it’s as big an issue as it might’ve been in the early years.
TONY LICHT: When new traits come to the market, growers will definitely want to ask the question: “How do the new traits compare to my existing operation? Or how much more do they bring to the table for me?”
DAN FRIEBERG: Growers drill down on that really quick because what tends to happen is new traits come at a price. Usually, the company is wanting a premium for them. They’re trying to weigh that. Is that extra seed investment worth it? Am I actually getting a higher return?
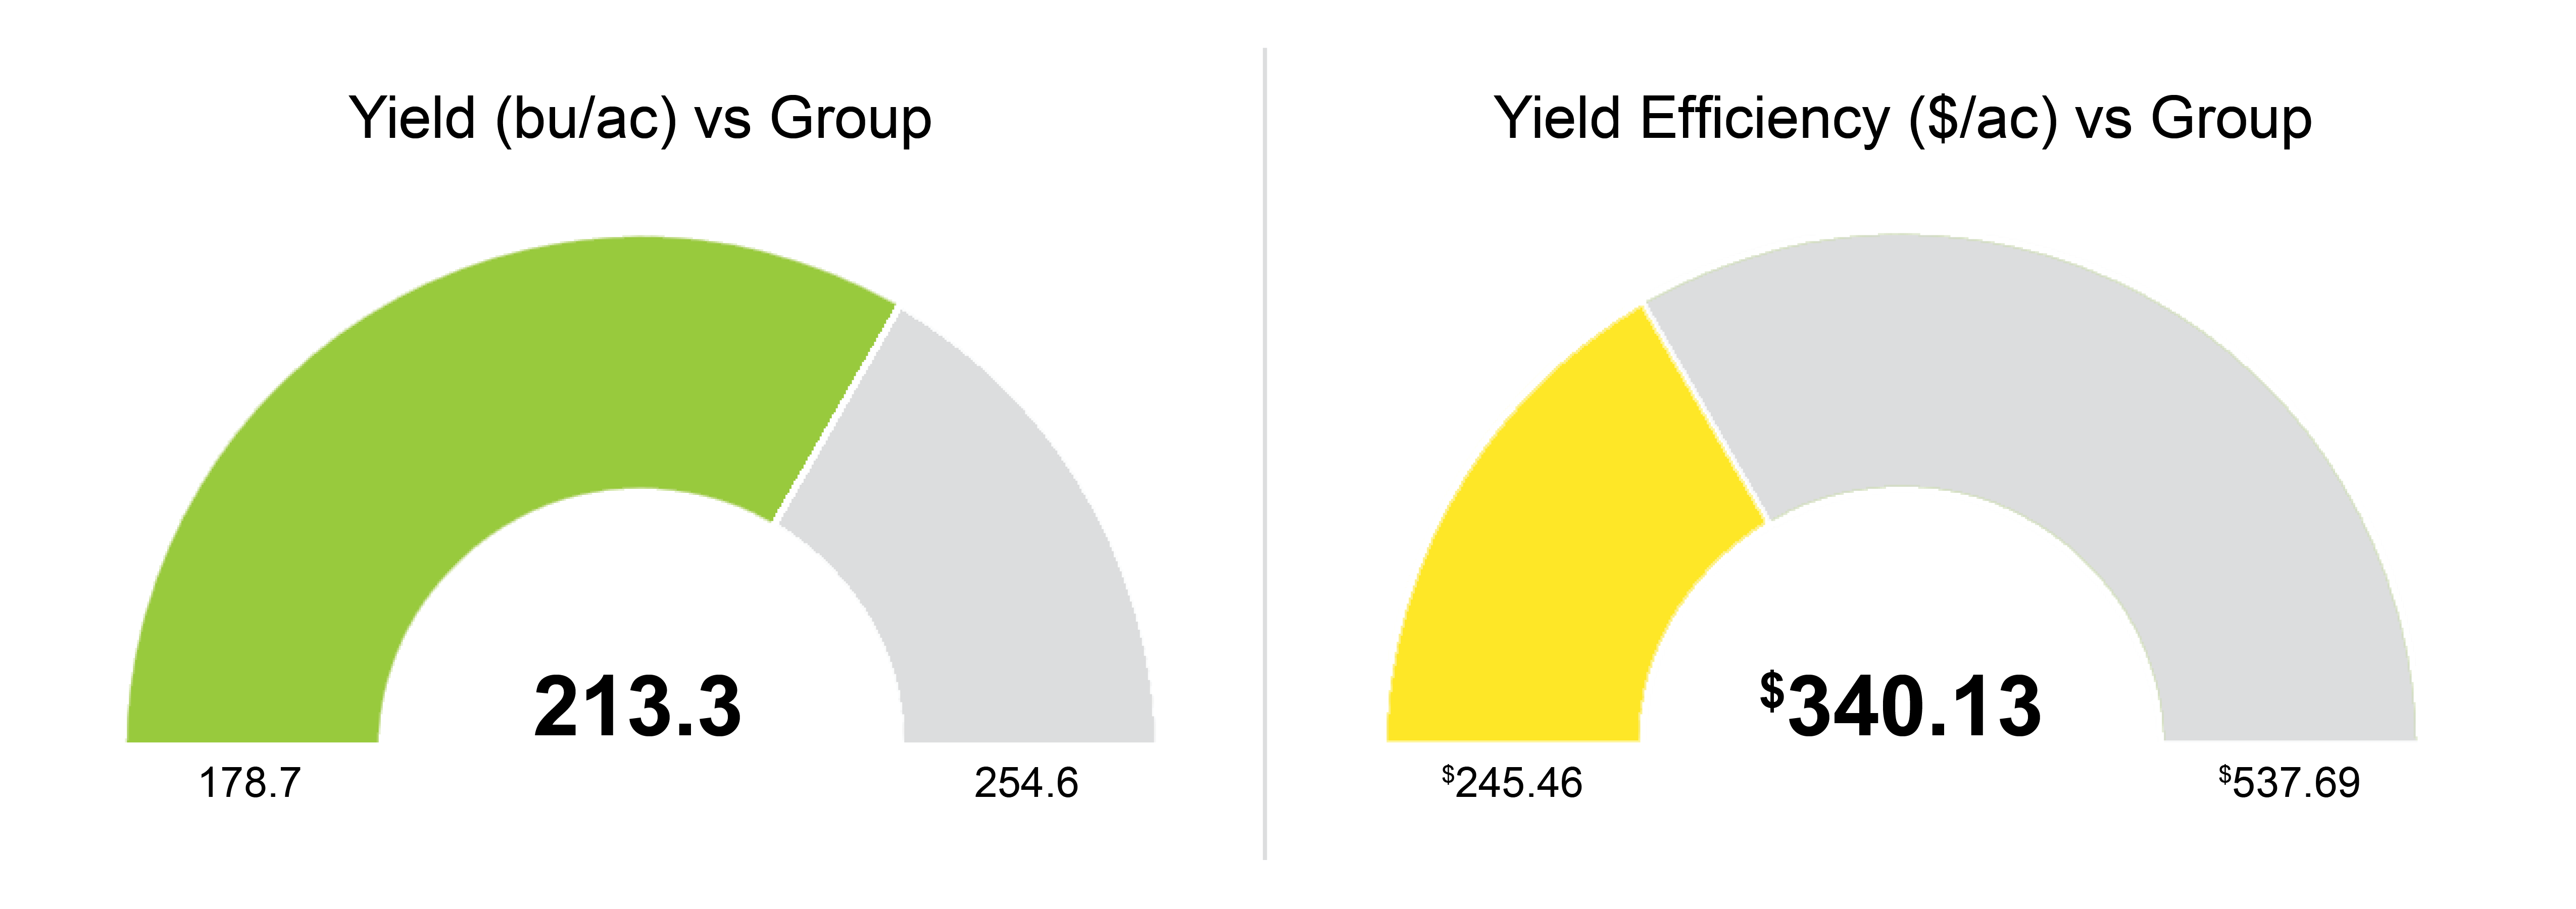
RENEE HANSEN: Can you talk a little bit about yield efficiency — and Dan, you did elaborate on it a little bit — and how developing and making a selection for your hybrid or variety, how that can attribute to your yield efficiency score?
DAN FRIEBERG: Yield efficiency is just the dollar-per-acre return to land and management, meaning, after you’ve paid for the seed and nutrients and crop protection and field operations, what’s left. From a seed perspective, Renee, it comes down to: “What was the price point? How much did I have to pay for the seed?” And then, probably, the next piece is: “How could I manage the seed?” There are some numbers that just have a lot of flex, meaning they’ll flex ear size as based on population. So, in a highly variable field, that might be a great strategy, just something that will really change. In other words, you can plant at a lower population, and if it’s a good year, you won’t take a yield hit. Versus a fixed-ear number, they’re really responsive to populations. It’s just even a bigger factor. Some numbers just require more. In order to produce at the top end, in general, you need more. You need more plants, but some numbers seem to be able to flex more than others. So, that goes into yield efficiency because if you can plant a number at a lower rate and still achieve the same yield, you could potentially add 10 or 15 dollars an acre in return.
TONY LICHT: To build off of just reallocating your rate around the field, as planters become more sophisticated, we can reallocate which hybrids go on which part of the field, assigning hybrids to zones or soil types and at different rates, as well. We’ve got a different cost point of the hybrid and a different rate to maximize the ROI.
DAN FRIEBERG: We have a lot of growers in the system that are doing multi-hybrid or multi-variety planting. Do you think that’ll continue to grow? Where do you see the trend on it?
TONY LICHT: We continue to be in a discovery phase with that, of trying to figure out the best placement of hybrids, the different rates of hybrids, like those treatment blocks behind you in your background, Dan. ELBs accelerating the learning of rate and also placement of hybrids helps us versus single-rate testing year over year. We definitely continue to try and find the bottom of the soybean population, but the issue with that is, all of a sudden, it becomes an unemotional decision. That’s at times looking at data points in January, February, March, but all of a sudden, sometimes, it becomes a little bit of an emotional decision in season. If I feel confident in the data in January that I can drill down a seeding-rate population to 120 or 110 or 100 thousand, and, all of a sudden, I might get cold feet in April. If it happens to be a really great spring, and we can get out and plant early and do everything we want to do early, all of a sudden, it may be an uncomfortable situation of: “Boy, I don’t know if I have enough. I don’t know if I have enough information on planting this lower rate this early. Maybe for safekeeping, I should just turn the population back up just a little bit.” So, it’s trying to balance the emotional decision versus the data decision back in the couple previous months to really drive and find the bottom of where we can go on populations. It’s just the same way in corn, in soybeans and corn. As far as wheat, how much we want to sow. I think everybody kind of knows where the optimal rates are, but where are the extreme rates, the highs and the lows that really maximize that yield efficiency?
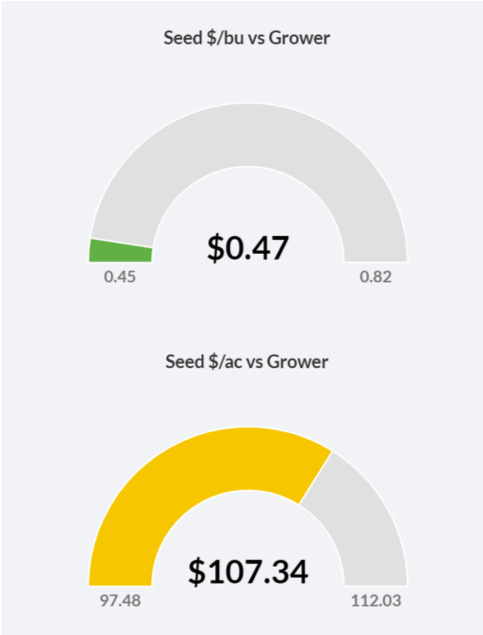
DAN FRIEBERG: I get copied in on a lot of the trial results. I’ve seen some 80,000 seed drops on soybeans that just did exceptional, and they were learning blocks or replicated trials. It really gets your attention because if you start trimming 50,000 seeds, and you get a higher yield, it really drives the dollars really fast.
TONY LICHT: Seed treatments and soybeans have really, really helped us drill down, I think, our populations, as well. We’re better protecting that seed to ensure that every one of them matters more to get up and out of the ground in a timely fashion.
RENEE HANSEN: Yeah, ultimately, driving up that yield efficiency score, helping growers profit more. Thank you guys for joining us today. So great to see you, so great to have you, and we’ll be back again. Thanks for listening to the Premier Podcast, where everything agronomic is economic.