When Two Negatives Make a Positive

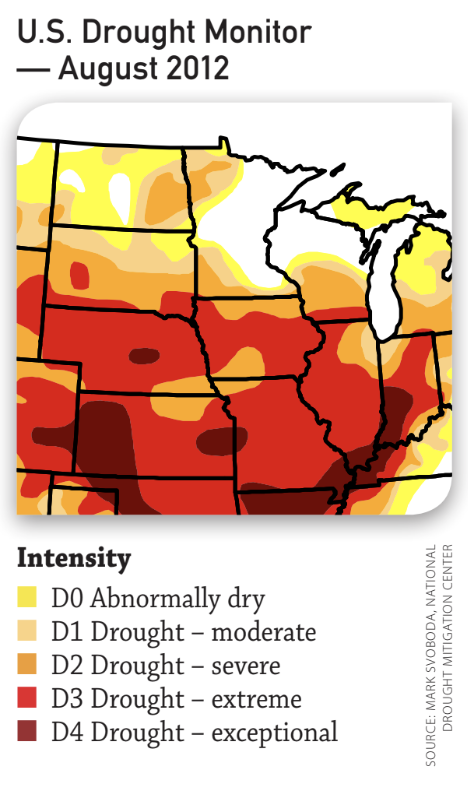
When we look back to 2012 it was historically dry, and 2013 started out wet and then turned dry. As some growers in the Midwest face yields below expectations, they’re finding new and different ways to learn from their data.

During the 2012 drought, north-central Iowa growers learned that they were being overly aggressive with plant populations on some lighter soils. This was a new trend for them, as abundant rainfall in previous years had masked these soils’ lower water-holding capacity. Since then, growers and advisors have paid more attention to those areas.

“We took the lemons of 2012’s lower production and made lemonade. We learned from the yield data and fine-tuned our management zones to apply more realistic seeding and nutrient rates on those lighter soils,” says Ben Rahe, a Premier Crop agronomic information advisor.

Northeast Indiana learned some valuable lessons from the 2012 drought, as well. “Even though yield information was so poor, we still had a lot to talk about with our growers about their management zones and what percentage of ground was in each A, B and C zone,” says Brian Warren, an agronomic advisor with ProTech Partners in northern Indiana.
 

Screen Shot 2018-09-18 at 11.38.18 AM


Warren also found that with their 60-to-80 bushel crop in 2012, weather needed to be a bigger part of the equation. “If a bumper crop is roughly 200 bushels, and a grower averaged 80 bushels in 2012, we learned that 60% to 65% of what contributes to yield is variable, and the other 40% to 35% is contributed by management.”

Warren made lemonade by amending management zones for the future.

“Every crop season, we try to identify each field’s yield-limiting factors,” says Rahe. “in a wet spring/dry summer year like 2013, that may mean using yield data to more accurately determine where to invest in additional tile drainage. We make the best of extreme weather conditions by learning how a field response to them. We then discuss with the grower what can be done to fix those yield-robbing items.”

Having a geographically broad information source can help with getting through tough years. “Due to weather, I’ll have some growers with well-above-average yields and some growers with one of their lowest-yielding crops,” Rahe says. “The positive of this yield variability is that as an advisor, I can apply what I learn to both growers. For growers with low yields, I can show them anonymous information from those who were more fortunate. What may feel to them like a ‘lost’ year of information educated them. And for those with good yields, I provide them with a watch list for extreme-weather years.”

Extreme weather conditions can uncover variability that growers and advisors have never seen, reinforcing the value of field-by-field management and accentuating the importance of site-specific decision-making. Assessing your yield data with a trusted agronomic advisor improves your odds against Mother nature’s curveballs.

GOT DATA?

1. Capitalize on a relationship with an agronomic advisor who isn’t as geographically centered as you. Prepare five questions to ask him or her about what worked for other growers who didn’t suffer from adverse conditions.

2. Study the big yield-limiting factors – like drainage or managing drought-prone soils. What decisions can be made from those lessons learned?

Originally published in Corn and Soybean Digest December 2013.

Learning Blocks

Some people remember phone numbers or slender dates; I remember farm fields. Before the 2005 crop year, the program leaders for Central Advantage from Central Valley Cooperative in southern Minnesota asked me to help generate variable-rate planting prescriptions. The primary question was “agronomically, what makes sense?”

Field by field, I looked at the data collected for historic yields, soils, fertility levels, cation-exchange capacities, etc., and generated variable-rate prescriptions for each field. But I didn’t stop there. I wanted to prove that what I thought made sense agronomically would truly work.

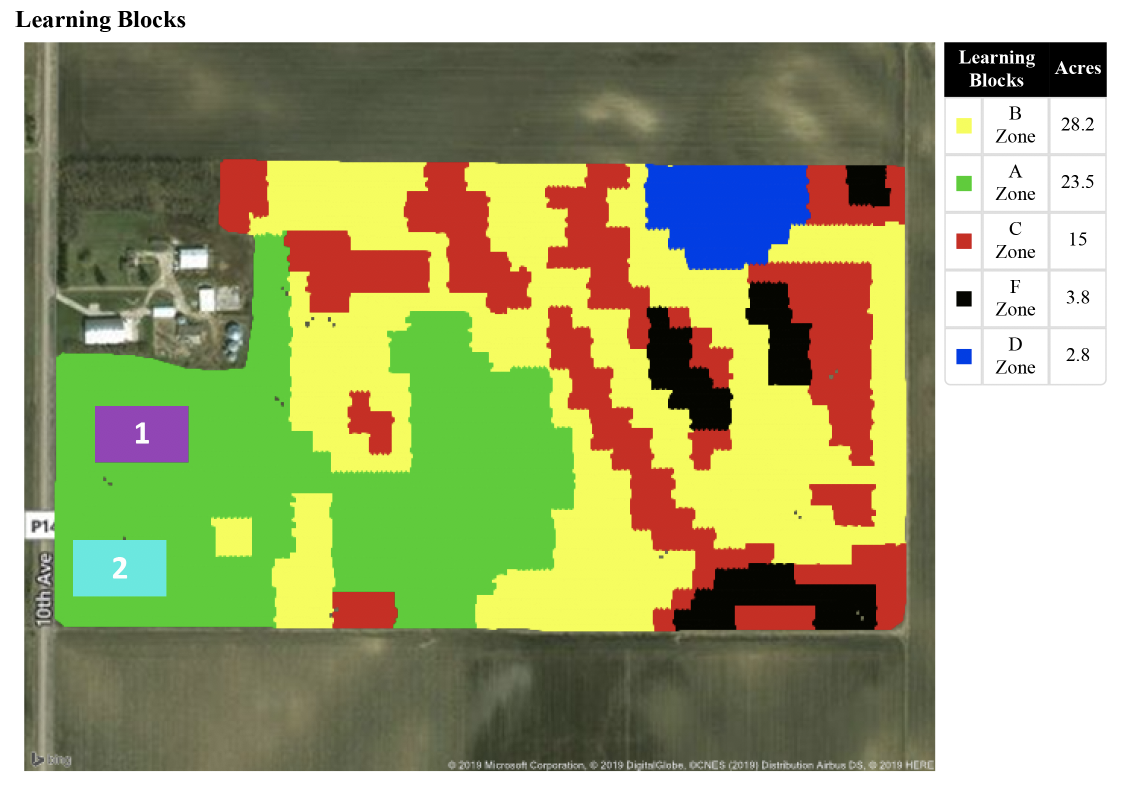
To do so, I put 1- to 2-acre check blocks within each area/population rate of the field. That fall, I carved out the yield for each acre check block and compared it to its surrounding area. I still remember those fields and the stories the check blocks told as we learned and proved concepts.

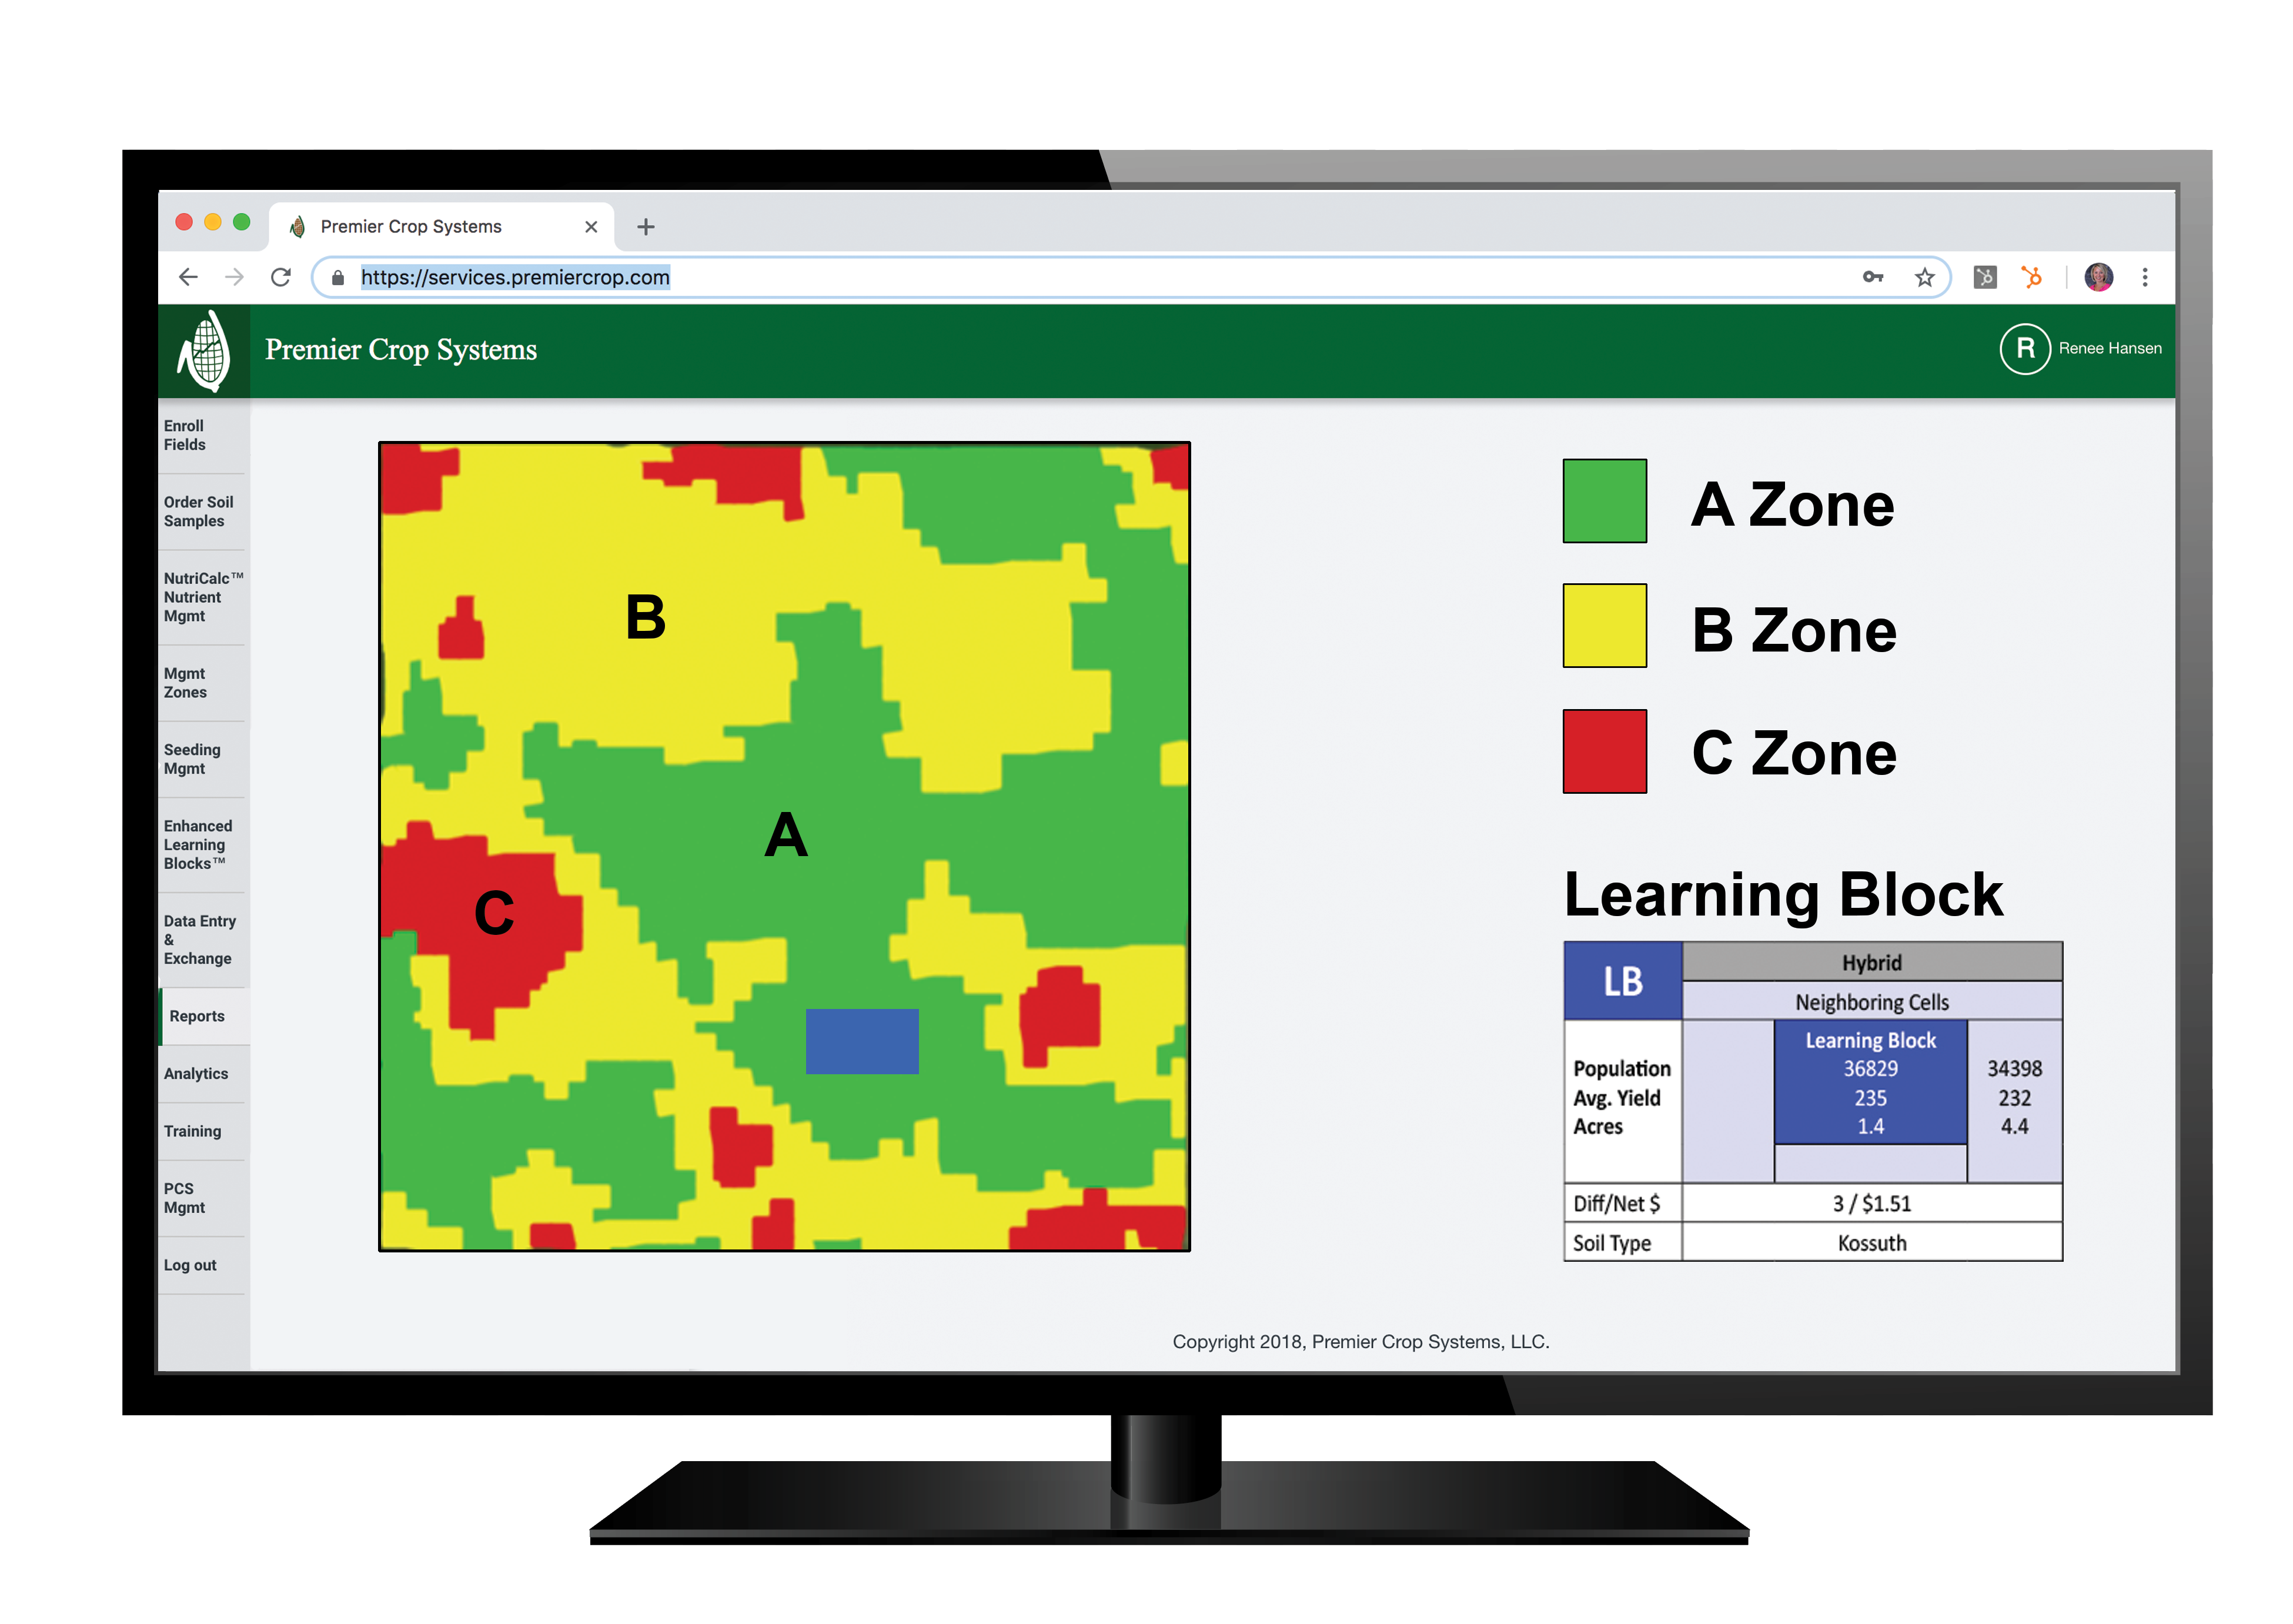
Since those days, we [Premier Crop] have trademarked the name Learning Blocks™ and have automated the process for analyzing yields inside Learning Blocks compared to the surrounding area via planting, fertilizer and other inputs. In my entire career I have never “sold” anything as popular as Learning Blocks! Growers love them for many reasons. Most notably, they make sense – comparing 2 treated acres to 4 non-treated acres within a management zone is a great apples-to-apples comparison. And, the technology does all the work – the grower does not need to slow down planting or harvesting to learn from the data.

learningblock

Growers enjoy not being told “trust us, this recommendation works”; but rather are given the ability to check and validate the recommendation. In the case of planting, growers can see Learning Blocks by downloading them into their smartphone and physically walking to a Learning Block, verifying the population change. Learning Blocks area low-risk strategy for implementing changes. For example, planting 39,000 plants per acre or increasing nutrient rates across an entire management zone might be a stretch, but every grower would risk a 2-acre Learning Block to test the limits.

Premier Crop has done plenty of strip trials in the past – running different across the entire length of a field. For variable population, the strip trial approach means running high populations across all management zones. Everything we gained from increasing populations in an A zone, we lost when the strip ran across a C zone.

When premier Crop talks about using data to make decisions, Learning Blocks are a vital part of that decision-making strategy. They give growers the knowledge necessary to refine further the prescriptions in their fields, with confidence and data to back them up.

Why You Should Test Products on Your Own Farm

Why should you test products on your own farm? Your farm is unique and you have the equipment capabilities and data to conduct those trials. With little risk, you can have a more robust dataset than many companies.  I’ll explain…

It starts with grid soil sampling. Soil sample data is the foundation to understanding and analyzing yield in each part of each field and ultimately, if products or rate changes will provide a return on investment. If there is something wrong with the foundation, additional inputs generally won’t show a return.  From there, we gather information such as– variable rate nutrient information, as-applied planting data, chemicals, fungicides, insecticides, weather data, and more.  Because in the real world, there isn’t one variable. It’s important to know what your measuring stick is, and we’re different, because we use actual costs and yield to understand why products perform and where they perform best.

Often times, information provided for new products or management methods are gathered from trials averaged across geographies, which may not fit your location or your farm. Certainly, there is excellent research out there–high quality university research and independent plot research that has good information. But inevitably, products come to market and growers try new technologies, but they don’t work or they don’t work everywhere.  Why not?

We believe products work in specific places and we want to help growers find those specific places in their field. We hear this from growers all the time, “sure I’ll take a gallon of fungicide or insecticide because I want to see it, I want to try it.” You want to see the product, apply it and harvest it yourself to see how it does on YOUR field.

Most growers are capable and have technology to test products on their farm, but aren’t taking the final step of doing an in-depth of analysis. Premier Crop offers multiple testing methods including a patented scientific approach of randomized, replicated trials executed through a prescription and harvested with your own equipment. The exciting part?  You may have the technology to run these trials on your own fields.

test trials on my local farm

As a grower do you try new products or test new rates?  How do you measure if that product or methodology worked? Visually? With a weigh wagon?  Do you use a yield monitor and software to do a simple analysis?  I’m here to tell you—you can do more with what you already have, and we’re excited to work with you!

Remove the Guessing and Make Data Driven Decisions

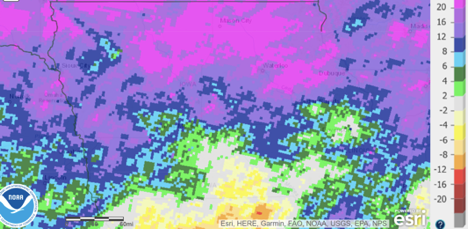
As farmers face another year with challenging markets and high inputs, we as agronomic advisors continue to work with our clients in order to find where we can remove some of the guessing when it comes to the decision-making process of planning another season. It comes as no surprise to anyone that is involved in Agriculture that many areas saw higher than normal precipitation in 2018.

The map below shows the state of Iowa and the departure from normal in inches of rainfall in 2018.

2018 high percipitation

(source: https://water.weather.gov/precip/  parameters from last year versus normal rainfall.)

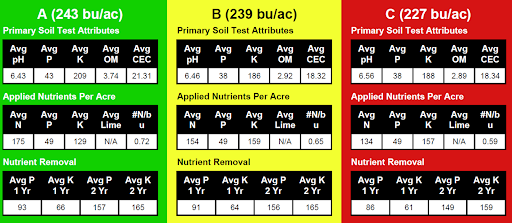
Unfortunately, this did lead to some areas of drown outs and low yielding areas in fields. Thus, there were many areas that had little if any removals of nutrients but many growers will treat those areas the same as areas that yielded well in the field. This is just one of many examples where VRT and precision agriculture can save the grower on inputs across their farms. It is important to look not just at soil sampling and soil types but also historical yield when deciding on proper recommendations for the field. At Premier Crop, it is important to us to treat every field individually and not look at those fields in a cookie cutter style approach. Premier Crop has an extensive database with over 20 years’ worth of observations.

It is important to look at the return on investment for not just for every field or every acre, but what it is actually taking to produce every bushel. We are able to take all of the costs that are provided and quantify the grower’s yields with those costs. Does it make sense to continue to treat historically poor yielding ground the same as historically high yielding ground? Would your inputs be better spent if focused slightly more on ground that has more yield potential? It is important to us that we treat every acre in an unbiased way, as if we are farming it ourselves, and the data allows us to do that.

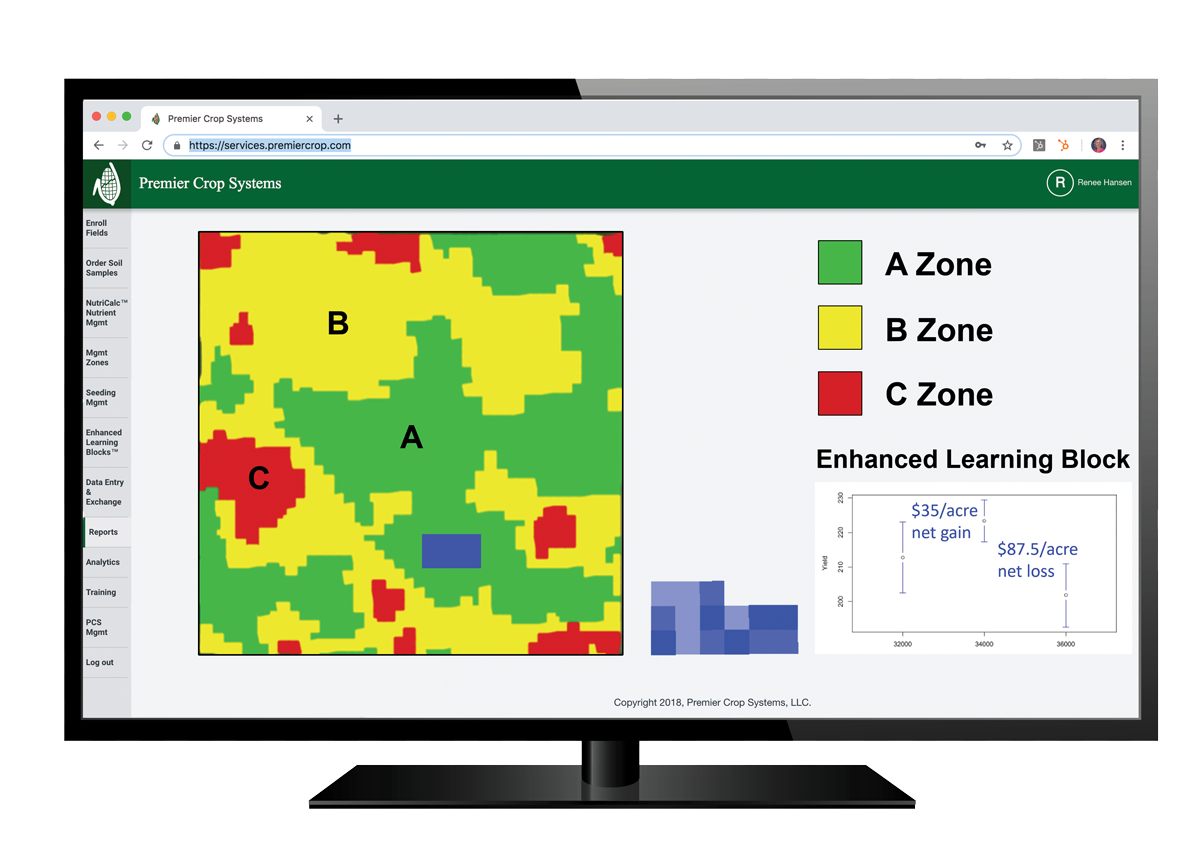
The example below shows a field that has been put into three different zones of productivity based upon fertility and historical yield.

premiercropmanagementzones_productivity_blog_lk

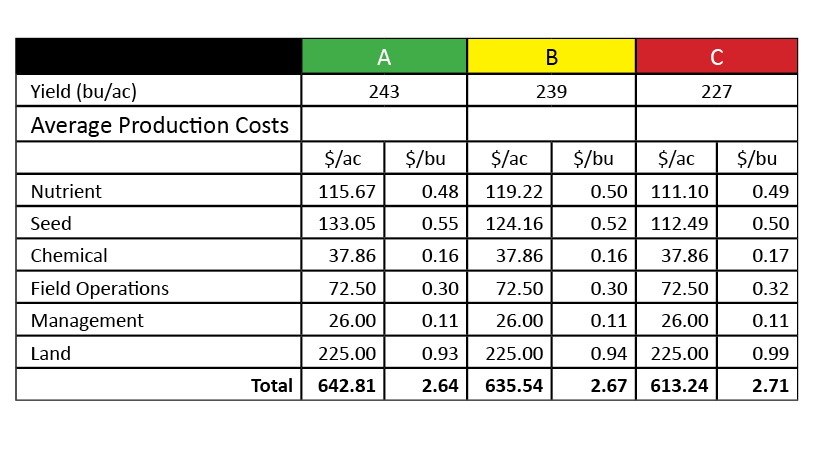
We then break that out further and show how each zone did on a per bushel basis with all the costs entered. As you can see we dropped our rates in the least productive zone because it didn’t show the same ability to produce as the other two management zones.

premiercrop_costperbushel_blog_lk

This is a great example how Premier Crop uses data to prove profitability. It’s time to stop guessing and use your data to make profitable decisions.

THREE Ways to Determine Field Profitability Using Your Technology {Pt. 1}

This is a three part series focusing on ways to determine your field profitability using your technology. We will post the series over the course of two months. If you don’t want to wait, you can get the full series here.

__________________________________

In tough economic times, it is more imperative than ever to know your productivity and be able to evaluate the cost or benefit of your decisions. Our mission at Premier Crop is to make this easy for you and give you multiple ways to evaluate across your operation. I will walk you through the different methods of evaluation: cost/bu, variance reports, and learning blocks, along with why each is important.

The first measurement is the cost per bushel on a spatial level to give you a new look at each individual area of your field.

COST PER BUSHEL

Q: What is the end goal of your operation? To raise more bushels to sell at a profit.

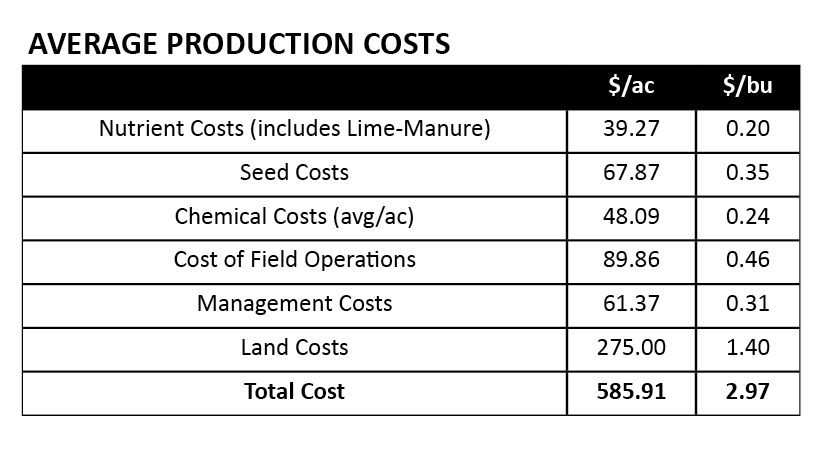
Q: How can you do this if you are basing everything off of cost/ac? Cost/bu should be your end goal. How much did your fertilizer cost you per bushel? How much did your land cost you per bushel? This diagram shows a realistic view of your operation.


determine your cost per bushel

We look deeper than your Average Production Costs to find the impact on your cost per bushel by field. And we go even deeper than only looking at your field, we break down each field into management zones and determine the cost/bu in each unique zone. (see diagram below)

Manage your cost per acre in management zones to determine field profitability


Not every area of your field performs the same and using cost/ac as your main metric of measurement can have detrimental effects on your overall productivity. Let me explain.

Your A zone is the most productive area of your field, it consistently performs well. Your C zone, by contrast, is the area of your field that constantly disappoints you. It never seems to do well and brings your overall field average down. Why would you treat them the same? You may be able to cut your cost/ac in the C zone by giving it less fertilizer and seed, allowing crops more room to spread out and grow, but if you do that in your A zone, you would see a decrease in productivity. Your A zone wants to be pushed, it needs more nutrients and can handle more seed population than the C zone.

This is a detailed look of each field, but sometimes you may want a more broad view of your overall operation to make management decisions. This is when step number two is valuable, by viewing your Field Productivity Report Card.

Stay tuned for our next post featuring the Field Productivity Report Card.

THREE Ways to Determine Field Profitability Using Your Technology {Pt. 2}

This is a three part series focusing on ways to determine your field profitability using your technology. We will post the series over the course of two months. If you don’t want to wait, you can get the full series here.

__________________________________

In tough economic times, it is more imperative than ever to know your productivity and be able to evaluate the cost or benefit of your decisions. Our mission at Premier Crop is to make this easy for you and give you multiple ways to evaluate across your operation. I will walk you through the different methods of evaluation: cost/bu, variance reports, and learning blocks, along with why each is important.

The first measurement is the cost per bushel on a spatial level to give you a new look at each individual area of your field.

FIELD PRODUCTIVITY REPORT CARD

After determining your cost per bushel, it is valuable to look at all your fields and rank them, like a report card. This process allows you to view which field deserves the gold star and which field needs more attention. This is a process that is automatically generated for you when you are enrolled in our program.

One part of the report shows a cost/bu field average over all of the crop acres for a given year and over multiple years. It allows you to look at trends in regards to cost/bu over time. This report will show you if one field is consistently producing a lot more or less yield or costing a lot more per bushel.

In the report below we can see that Bob Smith’s BS3 Home field corn averages $6.11/bu(1) across all the years of data, which is higher than his other fields in comparison. In 2018 it cost him $3.38(2) to grow a bushel. This report will show where the cost/bu had a significantly higher average (2012 $15.07/bu(4) corn) but since 2014 this farmer has been doing a good job of maintaining his cost/bu average on the BS3 field. However, we can see that across all acres of our fields the average cost of corn in 2018 was $2.94/ac(5). Therefore this field raises a flag for us to look deeper into the field data.

In contrast, the BS4 Home field averaged $2.59/bu(6) in 2018 which is below our average corn costs of $2.94/bu(5). This field has a consistently lower cost/bu year over year than other fields.

premiercrop_costperbushelaverage

What does this mean? The purpose of the report is to get us to ask ‘why?’

BS3 could be averaging a higher cost/bu because our management zones are not correct, we may be trying to push the field too hard, our plant population is off, or the nutrient prescription is flat-rated. Or we may be paying higher rent on that field and need to consider if it is economically responsible to keep renting at the current rate.

Again, this report is a big-picture overview across a whole operation, it’s main strength is to get us to ask why. Why is BS4 performing so much better than BS3? What can we change to get our cost/bu more in line across all of our fields? Lower seed costs? Split apply nitrogen? Apply fungicide?

Premier Crop can help answer these questions, our trained agronomic advisors can identify yield-limiting factors by doing an in-depth analysis of your individual field. We are able to recommend a management change that will affect your bottom line across a whole field. That is our ultimate goal, to make you profitable.

Is there a way be profitable without implementing wide-scale changes across your whole operation? The answer is yes, with step three, Learning Blocks…stay tuned!

THREE Ways to Determine Field Profitability Using Your Technology {Pt. 3}

This is a three part series focusing on ways to determine your field profitability using your technology. We will post the series over the course of two months. If you don’t want to wait, you can get the full series here.

__________________________________

In tough economic times, it is more imperative than ever to know your productivity and be able to evaluate the cost or benefit of your decisions. Our mission at Premier Crop is to make this easy for you and give you multiple ways to evaluate across your operation. I will walk you through the different methods of evaluation: cost/bu, variance reports, and learning blocks, along with why each is important.

The first measurement is the cost per bushel on a spatial level to give you a new look at each individual area of your field.

LEARNING BLOCKS

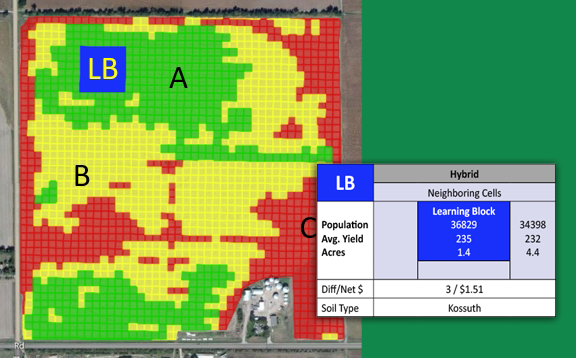
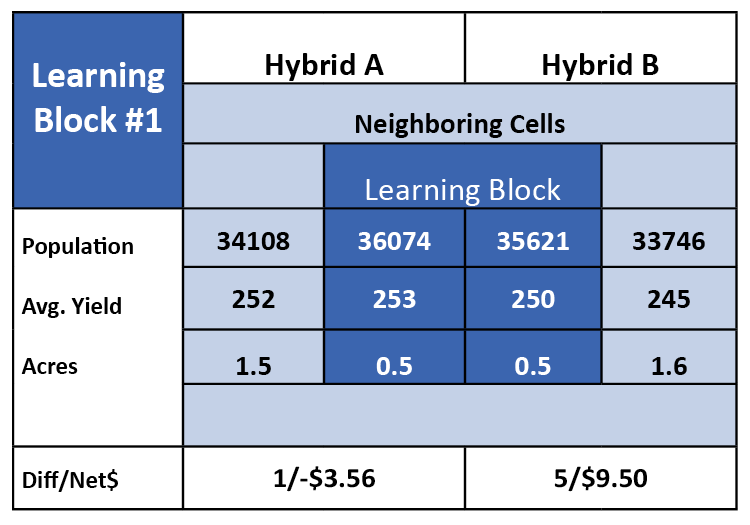
What is a Learning Block? Premier Crop has created a low-risk way to test and check variable rate seed populations, crop protection products and nutrient rates in one-to-three test acres, called Learning Blocks™. You have the ability to check if the optimal rate for that environment is higher or lower, in a low-risk way, built right into your prescription, using your technology.

After you have established management zones for your field, Learning Blocks prove whether a practice such as plant population or different nitrogen rates, are effective in that zone. Since Learning Blocks are one-to-three acre cells it’s a low risk way to prove and maximize efficiency.

premiercrop_learningblock_blog_THREEways

In the diagram above, this Learning Block was performed to test plant population. Did it pay? Yes and no. The Hybrid A did not have enough yield increase to offset increased seed costs. Hybrid B did have a yield increase to produce a positive ROI.

A great benefit to Learning Blocks is that you can place multiple Blocks in one field to test different management zones, soils, nutrients and more. This can ultimately help you make confident data decisions that will help you profit, all while using the technology you already have.

premiercroplearningblock

Get started, contact us to calculate your profitability and schedule a demo today.

Are you applying the right rates?

In 2005, Premier Crop trademarked a unique idea that has become a common practice with our customers. A trademark called Learning Blocks™. If you’ve conceded to the idea that your fields aren’t the same from fence line to fence line and you’re already managing your fields in zones, you’re ahead of the pack. But, are you checking your work? How do you confirm you are choosing the right rates for the zones in your variable rate planting or nutrient prescription?  Do you just trust that the prescription is right?

The concept of Learning Blocks was a way to test if the correct rates were chosen each zone, in a low-risk way. By placing small check blocks into an area that historically yields in a consistent manner, you can reliably check higher and lower rates against the rate you think is right.

premiercrop_learningblock_rightrates

For example, in a 30 acre area that has been your top yielding zone most years, you may choose to push corn populations to 37,000 seeds.  But, with nothing to compare against, how can you know that was right?  We’d recommend a high check at 40,000 seeds and a low check at 34,000 seeds within that same zone, only on 1-3 acres each.  Using the yield data and a few pieces of cost information, you can quickly understand the return on investment for those seeding decisions and the resulting yield impact they each had.

Now next year, you’ll have refined that planting population just a little more—and can do it again to keep checking your work.  At Premier Crop, we’re all about continually improving profitability, trusting the data to be our guide.

Learn more about Premier Crop’s trials here.

One Rate Doesn’t Fit All

When I began my career in crop production, we would routinely pull 20 soil sample cores, mix the cores in a bucket, pour one pound into a sample bag, send it off to the lab, get the results back and then pretend that what was on the sheet of paper accurately represented the nutrient levels for the entire field. While that may have been the best we could do then, we can do much better now – but many are treating entire fields the same. The economics of grid or small-zone sampling fields and variable-rate applying lime, phosphorus and potassium need to be revisited by many growers and their advisers. Nutrient prices have tripled since grid sampling was first introduced, and grain prices have escalated from the $2.50 per bushel days – meaning the reward for managing your nutrient investment intensely has never been higher.

In the early days of grid sampling, too many preached we would even out nutrient level within fields by applying phosphorus and potassium on the low-testing areas while mining down the high-testing areas. The pitch was that in a few years, the map that previously showed so much variation would be one color, with each part of the field in the same nutrient range. However, 15 years and seven to 10 variable-rate applications later, very few fields have uniform nutrient levels. Trying to create uniform fields was the wrong goal – the goal needed to be higher yields, not PPMs on a map. Grid sampling and variable rate nutrient applications are needed foundations for getting started in precision agronomy.

how to use data for fertility management

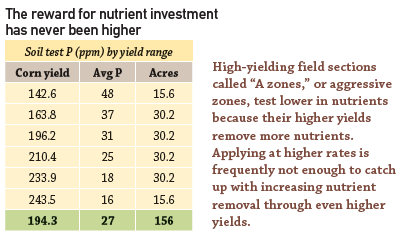
In many fields, a comparison of yield and fertility data will show the lower testing parts of the field are the highest yielding. These high-yielding parts of the field are what we divine as “A” zones, A standing for aggressive. A zones can test lower in nutrients because consistently higher yields remove more nutrients. Even though variable-rate applications might put more nutrients on these A zones, it is frequently not enough to catch up with increasing nutrient removal through even higher yields.

Think of A zones within your fields as Olympic swimmers – able to consume 8,000 calories per day and remain lean and fit. A zones are so productive, they warrant an all-you-can-eat buffet.

Just as more A zones call for being even more aggressive, for us, C zones are the parts of the field that justify being more conservative. In fields that have had straight-rate blends applied for years, it is easy to pick out C zones in the data. These consistently lower-yielding areas can become nutrient obese form lack of productivity. For Premier Crop, variable-rate applying nutrients is not about saving money; it is about reapportioning a higher nutrient investment within each field to maximize nutrient efficiency. One rate does not fit all.

Got data?

1. What changes have you implemented with your nutrient application investment since the prices of nutrients, corn and soybeans have escalated over the past several years

2. Do you see your yields “leveling off”? In what areas of your field could you push more? Sit down with your agronomic advisor to discuss ways you can get a yield bump for your A zones.

3. How do you proportion your nutrient investment from field to field, and acre to acre?

Don’t Farm Averages

Sometimes “averages” can be your worst enemy.

Everyone has heard far-fetched examples that illustrate the problem with “average.” Picture standing with one foot in ice-cold water and the other foot in steaming-hot water – the average of the two is OK. Sometimes that’s what using averages can do in your farming operation.

An example would be using average as you consider your fall nutrient budget. Tighter, even negative, margins will cause many to scrutinize input spending this crop year with much more intensity. Unfortunately, too many suppliers will simply calculate the most nutrients that can be applied for your per-acre budget and apply those rates on every crop acre. For all the headlines about precision agriculture, the majority of nutrient applications are still the same blend applied across every acre.

Agronomically, a better answer is to focus your input dollars in the site-specific areas of individual fields that will provide you with the most economic return on your nutrient investment.

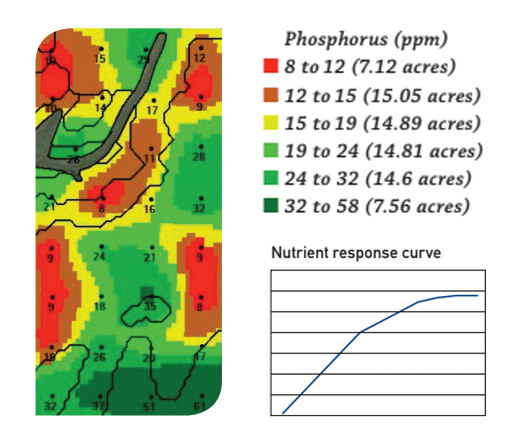
At some point in our farming history, all of us have seen a nutrient response curve. Applied nutrient response curves tend to have these similar characteristics – steeper at lower levels and flatter at higher levels. For example, most of understand that generally we get more yield response for the first 50 pounds of nitrogen applied than the last 50 pounds. Finding maximum economic return is the basis for nutrient response curves.

dontfarmaveragesphosphorus

Think about response curves as you review the soil test phosphorus map above (expressed in parts per million – double the numbers if you are used to pounds per acre). If you composite-sample this field, the average is 20 ppm of P – running parallel with many university threshold levels where a response to applied P can be expected.

Using university recommendations as a reference, virtually any type of georeferenced soil sampling will reveal that in this field, spreading the same rate of P on every acre will result in no yield response is 50% of the acres (the green part of the map). As bad as that might seem, there is a decision even more economically harmful. Making a decision to not apply any phosphorus because the field’s average soil test level is 20 ppm would likely result in lost yield in 50% of the field (red, orange and yellow areas).

None of us can control or even predict all the curves of Mother Nature can throw our way. But using data from your fields opens the door for you to manage the crop production variables that are manageable. The fall’s tight economics area great time to put all your data to work – to stay away from averages. If you don’t have school data, now is the time to get started. The cost of a good grid soil sample spread over the normal four-year life equals less than one-third of 1% of your production cost.

Collecting and using your data can move you away from defaulting to using averages and getting average results.