The Best Agronomics are the Best Economics

I don’t like it when people generalize about the characteristics of a demographic group – like when people say, “Bald men are better-lookin.” There are always exceptions that make those generalizations flawed.

But as much as I dislike generalizations, I’ll offer this one: “Most ag lenders are not trained to be agronomic advisers.” In many cases, ag lenders may be doing exactly that – making agronomic decisions by limiting input investments with a maximum per-acre budget. While your lender may not be an agronomist, there is a fairly good chance that he or she is a “numbers person.”

This field is an example. The map shows breakeven cost per bushel with a field average of $2.88 per bushel. That breakeven wasn’t achieved by treating the entire field as though it had the same potential.

premiercropblog_costperbushelbyyieldacres

This is where your data can help. Can you use your data, and specifically your agronomic numbers, to your advantage? Can you use your maps to tell a story of how you make the very best input investments? Can you use your data to explain that while flat-rate applications and seeding are easy to budget, they are flawed agronomically and economically?

These yield-driven nutrient removal charts show how higher yields remove more nutrients in the most-productive areas and less in poorer-yielding areas – proving how flat-rate nutrient applications represent over-spending and underspending.

As you can see in the average production costs charts, flat rates equate to spending too much on seed and nutrients in the less-productive areas of fields (yellow and red), and frequently far too little in the most-productive areas (green). Why continue to apply the same rate of nutrients to every acre, when you don’t remove the same rate through yield?

Investing your input dollars to maximize your return on investment is all about where you invest within each zone of your fields! It’s time to use your data to tell lenders the story of how the best agronomics are also the best economics!

premiercropblog_aglendereconomics

Data Leads to Input Decisions

Sometimes life events leave a mark for generations. The Great Depression created generations of frugal farm family survivors. Feeding a family was a challenge – holding on to a farm was almost impossible for many. The “frugal stamp” wasn’t just left on the parents but their children and many times passed on to another generation.

Did you grandmother save everything? Save leftovers – not in Tupperware but in leftover butter or other plastic food containers? Save old jeans to have material for future patches. Did your grandfather save pieces of old lumber for the next project? One of the most popular radio talk shows, hosted by Dave Ramsey, encourages being frugal to climb out of debt.

In tight economic times, it’s easy to want to take a frugal approach on crop inputs. In an October issue of CSD, an article highlighted DuPont Pioneer’s findings that many field sampled have below optimum soil test P and K levels, with their expert calculating over $4 billion in lost revenues for growers.

The elephant in the room is the negative impact that high cast rents can have on maintaining the productivity of many farms. In most markets, the competition for land is so fierce that growers resort to penny-pinching on P and K application. Many don’t want to leave any nutrients for the next renter if they go out-bid.

The article also highlighted the new higher-yield reality of how much has to be applied to keep up with nutrient removals. The “old” shotgun of 400 lbs. of dry fertilizer every other year can mine soil test levels quickly.

I believe the yield loss associated with being frugal is far more significant than most agronomists and growers realize. I believe that for many growers the “optimum” soil test level is even higher than university definitions of “optimum”. This chart shows one way to analyze data across a grower’s 1,700 acres of soybeans – examining the relationship between low to high yield acres and the corresponding soil test P and K levels.

premiercropblog_dataleadstoinputdecisions

If these were your yield results, what would you consider your optimum soil test levels? That’s the power of your data – it can lead you to customize your approach to what is best on your farm versus a state-wide average.

There are many strategies to address the fertility needs of the crop. Strip tillage and deep banding of nutrients is a great way to compensate for low fertility fields and maximizing return for nutrient dollars invested. Irrigated sand requires that we spoon feed nutrients.

For most nutrients, feeding the crop is a combination what we apply, including manure, and what the soil supplies. We shouldn’t measure our success by whether we raised soil test levels but by our yields and cost/bushel. I believe your data will leave you to find the balance in your approach to input decisions. In corn and soybean production, you can spend yourself poor but you can’t save yourself into prosperity.

Who Owns the Knowledge?

Agronomically, most of us are “land grant” educated. Land grant universities were established with the Merrill Act in the 1860s and served to make the higher education affordable to the masses, including a lot of farm kids. By design, they had an agricultural focus – both in research and education. Even if we did not attend our state’s Land Grant or follow their sports teams, they are the foundation for most of the industry’s agronomic knowledge.

Historically, most of what has happened in “precision ag” applications could be characterized as “measuring variability within fields, using knowledge from Land Grants to write equations to variables apply crop inputs.”

Premier Crop and our customers have been working to create new agronomic knowledge with grower’s geo-referenced agronomic data. It’s messy work. Real world agronomy and the data captured is what I call “the collision of uncontrolled variables.”

Recently there have been headlines about agreements between the industry and farm groups on data ownership and privacy. That’s positive. But it’s really not surprising that a company would agree that you own data and that it will be returned or removed from their servers. Or that you will be allowed to direct whom you will be allowed to direct whom it gets share with or sent to.

Do you ever wonder why a company would even want your agronomic data? Often I think the question that should be asked but isn’t, is this: who owns the knowledge created from your data? Is it the data scientist? The company that combines your data with other growers’? The company that is in the business of mining your data with their proprietary algorithms?

iStock-672067522

I believe that what most growers want at the end of the day is agronomic and economic knowledge on how to farm better and more efficiently. Is the data really what needs protecting or is it more the knowledge created from the data?

There are many different business models being created in data management, no one more right than the next, they are just different. One model is: share your data with us and we’ll use it to tell you how to use our products better. Another model that has been used extensively in the consumer market is the “freemium”, a pricing strategy where a basic service is provided for free to build a user base and lead customers to a premium for-charge service.

Other models will be combinations. Share your data with us, we’ll aggregate it with other grower’s data, develop and calibrate our predictive models, create new knowledge that we own and then we will sell it back to you and other growers.

Another approach is slightly different. Share your data with us, we’ll partner with you and other growers (for a fee) to create agronomic knowledge that you collectively own. That knowledge is shared only with other growers that are part of the database that contributes to the knowledge creation.

The data is only as good as the knowledge you gain form it. Moving forward, how will you view the discussions around data and knowledge ownership?

Got data?

1. This blog has discussed many of the ways data is important, they type of knowledge gained, as well as the decisions to be made, but how have you put it to work for you?

2. What have been some of the positives you have done on your operation that made this year better than last?

3. Think about which business model you are paired with. Is the knowledge you gained from signing away your data in the past worth it?

Use Your Data to Make Decisions

It’s almost the time of the year when making New Year’s resolutions are popular. Ever make a business resolution? If you haven’t been using your data to make decisions, how about making that your resolution?

How should you start? I’d start with your yield maps. Look carefully and hear the stories that they tell. What are some of the real-world examples of how you can use your yield map to make decisions?

premiercropblog_datatomakedecisions

1. Red circle – This one is easy, using the yield map to quantify yield losses associated with drainage issues. Up to 10 bushels per acres @$9.50/bushel = $95 per acre. The economic loss is just as severe with corn. Breakeven on running tile might be as fast as 5 years. Wonder if my land owner will work with me on solving this issue?

2. Blue circle – simple too much traffic!!! 15+ bushels less per acre – that’s $150/acre yield loss! We need a strategy to fix this! Maybe concentrated effort with a ripper and then more discipline about how we move in and out of the field?

3. Yellow rectangle – wow – between shading and competing for soil moisture, the trees in that fence row are sucking yield and money right off my balance sheet. I know the land owner wants habitat for game birds, but it comes at 10-15 bushel cost to me. Maybe showing him some of my yield maps will help in negotiating?

4. Orange circle – this i another drainage issue. I think this one is an easier fix – maybe some surface shaping and extending the waterway on the lower end.

5. Light blue circle – yikes – I remember this one – it’s my first small patch of resistant waterhemp. This is mild compared to some in the neighborhood – time to get serious.

6. Green area in NW corner – oh my – this one is a puzzle at first. Two years ago, my contract manure applicator needed a place to finish and I’m fairly sure that’s only part of the field that was knifed. This is definitely something I need to investigate – over 100 bushel per acre in many places!!!

You get the idea – your yield maps can be the first step in quantifying problems and figuring out solutions! Merry Christmas and best of luck with those New Year’s resolutions!

Buyer’s Remorse – Get Started with Precision Farming

PRE·CI·SION

/prəˈsiZHən/ noun
the quality, condition, or fact of being exact and accurate.

Last week, when I donated blood, the technician told me my heart rate was 61.  I immediately looked at my fitness tracker on my left wrist to see what it said: 61!  I was super excited and impressed.  I spent over $100 on this thing to track my steps, exercise, heart rate (and whatever else it tracks!) and I just wanted reassurance that my purchase was well worth the money that I spent.

tracking your data with farming

We all want to know that what we spend our money on is well worth it. No different than using farming Precision Ag technology and data that you have invested in. Whether that is machinery, monitors, crop protection or soil sampling data. It’s that fear of buyer’s remorse: I was worried that I had made an expensive purchase, and if it was worth the money. You may be feeling the same way, especially with commodity, seed, land/rent, other input costs where they are today.

Just like my fitness tracker, you have made an investment in ag technology. I threw away the receipt and I’ve worn it for months, but never really questioned its worth until I had something to check it against. You simply can’t return your precision ag technology (equipment/sampling/crop protection) that you have invested in. Or, if you do, it won’t be a straight up return, it has depreciated, been used in the fields, etc. You drove it off the lot. Now, how do you get started to get the most out of your investment?

yield monitor and data

If you are not utilizing your precision ag investment, START. Do you hear me? Just like my fitness tracker, your ag technology provides farm management value. You need to be using YOUR data to make the most accurate and confident decisions to utilize your analytics tools and technology investment. Ask yourself what are you getting out of it? You need to squeeze more out of every dollar that you have available. You should be able to prove whether or not what you are doing is benefiting you and your operation, economically and maximizing crop yields.

GET STARTED:

1. Use your data to make decisions.
How? Find a crop consultant that can use all of your farm data to make agronomic and economic decisions. If you are ready to start with Premier Crop we can help you with your data complexity and analytics solution, contact us now. Or maybe you have a consultant you’ve worked with, but make sure you start to gather and layer all of your data. Get it organized, all in one place.

2. Analyze your current ag technology.
List all of your current technology, monitors, apps, and value each benefit. Sometimes thinking out-of-the-box and looking from a different perspective can change, minimize or maximize your production. Ask yourself the hard questions: What equipment do you have? What monitors are you using or not using? Why? What can help you get more margin in this market? Do you have a Variable Rate planter, do you use it? Do you variable rate your fertilizer? How do you make your seed decisions?

3. Prove your technology is economically benefiting your operation.
With the list you’ve created above in No. 2, answer the following questions next to each line: Am I using farm management software to help make decisions? Is there more I could get out of farming? Do I know that it pays? Am I using the data to make confident decisions?

I don’t regret my decision to invest in my fitness tracker because I use the data in the reports that it generates: the trends, the numbers, my progression. Use your precision ag technology and your data to feel better about your agronomic investment.

Use Your Data to Set SMART Goals

At the inaugural Ag Data Conference, Aaron Rahe, one of our Premier Crop advisors, shared his perspective on how he works with his grower customers. Premier Crop was fortunate to hire Aaron is an Iowa farm kid, as he finished his MBA after his five-year stint with the U.S, Navy. Aaron carries his military and business training into how he approaches his work with growers.

Aaron starts each crop year with a discussion about goals – what are our goals for the year? Aaron expects S.M.A.R.T. goals put in writing and shared with the team. His real world experience in leading teams drove home the point that everyone needs to know the objective – same as it is with the team working at your operations and those that support your operation.

premiercropblog_smartgoals

Your agronomic data is perfect for implementing SMART goals for your corn and soybean production (Time-bound). Drilling down in your data makes it easy to be Specific and Measurable.

Let’s think about what a SMART goal might be for the upcoming year.

Your yields were the best ever in 2016, your overall yield average for your corn on corn acres was 220 bu/ac.

This table summarizes 2016 results by management zone and by nitrogen efficiency. A 2017 SMART goal might be to lower your rate of N/bu by on-tenth lb. at the same yield levels. That’s a goal that is very Specific, Measurable, and Tim-bound. But is it Realistic? That translates into lowering total applied N by 22 lbs. of N/acre while maintaining high yields. What if you tweaked your N rates, moving some of your pre-plant N into your early post-emerge application, but reduced overall pre-plant N rates by 20 lbs.? When you advisor looks a aggregated data from growers in your area, for growers with similar yield, the ranges are from 0.9 to 1.3 lbs. N/bu. You’re already more efficient than some, but the data also tells you that setting a SMART goal of 0.96 lb. N/bu is Realistic. At $0.40/lb. N/bu is Realistic. At $0.40/lb. of N, hitting your SMART goals saves over $8 per acre.

premiercropblog_2016dataanalysis

Here are other examples of how you might use your data to set SMART goals for 2017:

  1. Increasing seed efficiency – bushels per 1000 seeds planted. Similar to being more efficient with nitrogen, can you use your variable-rate planting capabilities to be more efficient with your seed investment. Start with your data – if you averaged 200 bu/ac and planted 34,500 across your entire operation, your seed efficiency is 5.79 bu/1000 seeds. Each 1/10th in better efficiency could translate into $2/acre in increased profits.
  2. Increasing planted acres per day – if you are currently at 290 acres/day, is a realistic SMART goal 320 acres/day? What would have to change to make it happen?
  3. Lowering cost/bushel by $0.25/bushel on corn and $0.40/bushel on soybeans. That’s a tough SMART goal because there are so many variables that affect your cost/bushel.

Using your data and committing to SMART goals now can result increased profits. Written and agreed upon goals can focus your entire operation on what’s most important to your farming business.

Use Multiple Layers of Data to Make an Informed Crop Decision

With Christmas fresh in the rear-view, I’m reflecting on the gifts I gave and whether or not they were the ‘right’ gift for each person. What quantifies a good gift in my mind is not at all what quantifies a good gift to my husband. I’ve learned I need to ‘speak his language’ if I want to choose something that really sparks joy for him. The funny part?  The gift itself doesn’t matter to him! What matters to him is that the gift is well-researched and that it’s the choice the research says was best among similar options. This year, my husband got a new angle grinder power tool. The angle grinder could’ve cost $80 or $400, he doesn’t care—so long as he hears these words: “I spent endless hours looking for the best angle grinder and based on multiple sources of research, this is THE angle grinder to beat all angle grinders.”

reviews for premier crop data

In today’s digital age, we can find information faster than ever before. It’s become more important to know whether an information source is reliable, given there are a lot of opinions floating around when we need facts we can trust.

Every year, as a farmer, you make critical planning and management decisions that affect your livelihood and farming operation. If you’re like me and won’t buy a gift without reading multiple reviews, how do  you choose what seed to buy, how much fertilizer to apply, what additives to use, what rate to seed at, or make any other farm management decision without a way to check whether or not it is a profitable decision?  What if you knew the answers based on research and data? What if someone could hand you data to tell you if your inputs are a profitable decision?

Here’s an illustration from 2019. A farmer was trying to understand the right planting population for a particular hybrid. He could look at a few different pieces of information available including (not limited to) information from the seed company, information from his historic productivity, and a recommendation from a local advisor. Based on the available information, he chose to variable rate seed his field and also include some randomized, replicated population studies (around 3 acres in size) within different productivity zones to help ‘check his work.’

Going into the trial, we expected that he would’ve seen a yield response to increased planting population (up to 37,000 seeds/acre) in the higher yield environment based partially on the fact it was a semi-determinate ear and partially because the seed company research said so. Were we using good information sources?  Sure. But did we need more local data? Yep. Instead of a yield bump from higher populations, the farmer found that 32,500 seeds was the right rate for this hybrid in that environment using statistical data. The yield response to finding that right rate was 20 bushels on either side—an $80 revenue swing—whether we planted too high or too low. What an important piece of information to have next year!

statistical results of variable rate seed

premier crop statistical yield data

The point is two-fold.  The information sources you use in farm management decision-making have a drastic impact to your bottom-line. It’s important to measure and ‘check your work,’ on your own fields. You may be making the wrong management choices without even knowing it. If you wouldn’t buy a new shop tool without doing homework on the options, doesn’t it make sense to use the same approach with farm management using multiple layers of data to make an informed crop decision?

What is Efficiency in Farming?

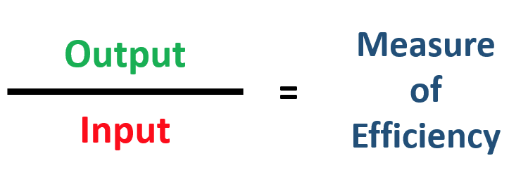
A quick Google search on the word efficient returns the following definition – achieving maximum productivity with minimum wasted effort or expense.  I like to think of efficiency as a ratio, or fraction. Most often the input value of the equation is time or money.  Efficiency is something almost everyone strives for in some aspect of their life. Think about different tasks you try to become more efficient at.

how to measure farm efficiencyHere’s an everyday example of efficiency.  My pickup’s gas tank holds 24 gallons and I can drive about 440 miles on one tank.  My wife’s car has a gas tank capacity of 14 gallons, which gets her almost 480 miles of driving.  One tank of gas in each vehicle results in only 40 miles difference in total output or miles traveled.  However, when calculating efficiency these values equate to her vehicle being roughly twice as efficient as mine.  If the capabilities (towing, hauling, etc.) of our two vehicles were the same it wouldn’t make sense to drive my pickup because the input expense is almost twice as much to return roughly the same output.  This thought process can, and should, be applied to crop production.

tracking farm and yield efficiency for roi

You rarely hear a farmer complain about being too efficient.  However, production efficiency ($/bu.) is often overshadowed by one of its components: output.  In farming output is synonymous with production, or yield. Historically, yield has been the basis for comparing hybrid performance, analyzing other agronomic factors, such as soil tests and application rates… and coffee shop conversations.  Although yield is a critical component, it is only half of the equation when measuring efficiency. We must remember to examine the input side of the equation.

When completed the equation it reads as shown below.

farming production costs and how to reduce efficiency

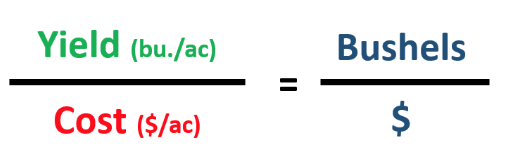
I don’t know many farmers who are tracking the number of bushels produced per dollar invested.  It isn’t a metric that can be easily related back to operational decision making. Here’s an example calculation: 235 bu/ac ÷ $700/ac = .34 bushels produced per dollar spent.

The result becomes more relevant when you flip the equation.

farming costs determining roi

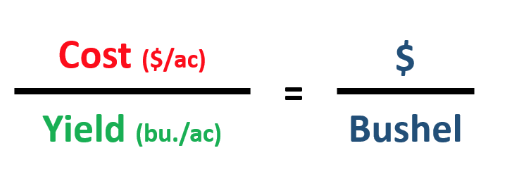
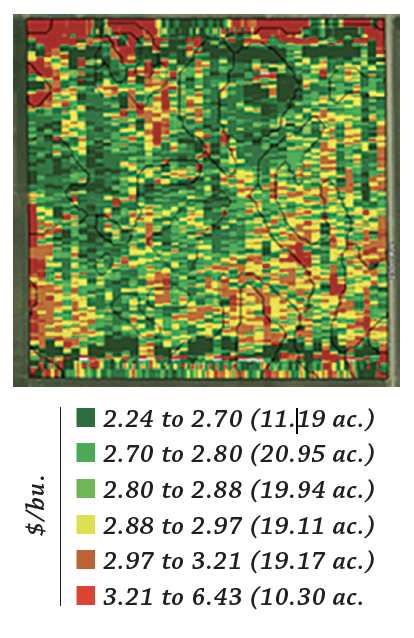
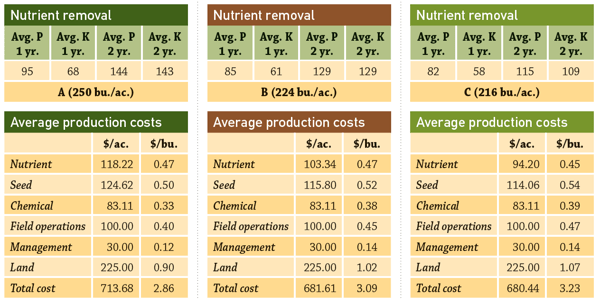
The measure of efficiency now equates to breakeven cost per bushel ($/bu.), or how many dollars it took to produce one bushel of grain.  Here is an example with the same values from above: $700/ac ÷ 235 bu./ac = $2.98 / bu.

Cost per bushel produced is a metric that is easy to comprehend and is also actionable.  Knowing your breakeven cost per bushel allows you to have greater confidence when making marketing decisions.

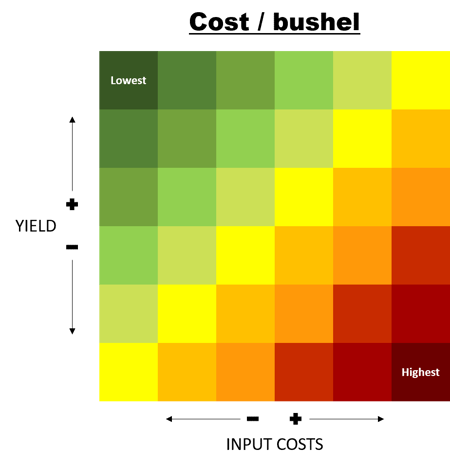
It’s important to understand that breakeven $/bu. changes within the field and that there are two ways to improve efficiency, or lower your breakeven $/bu.: 1) Reduce input expense 2) Increase yield.

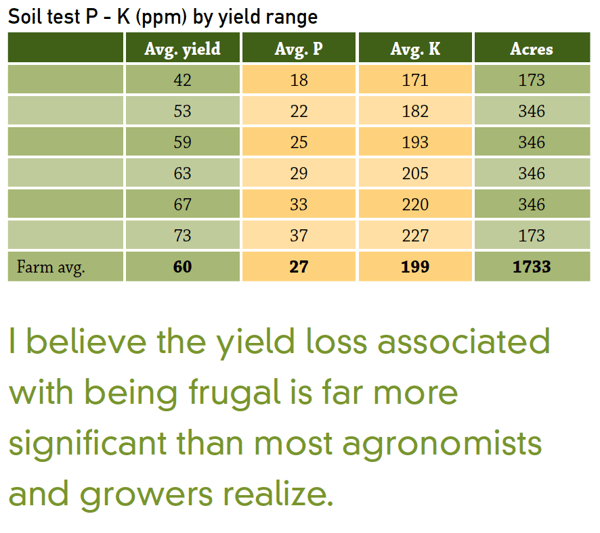
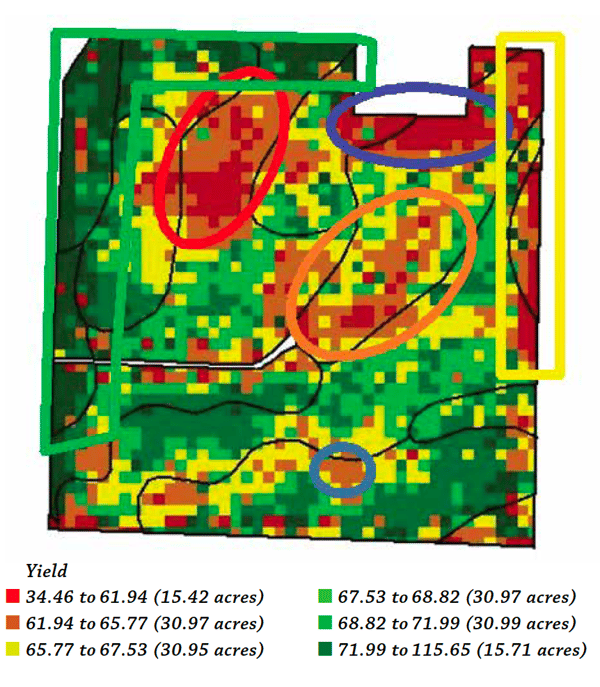
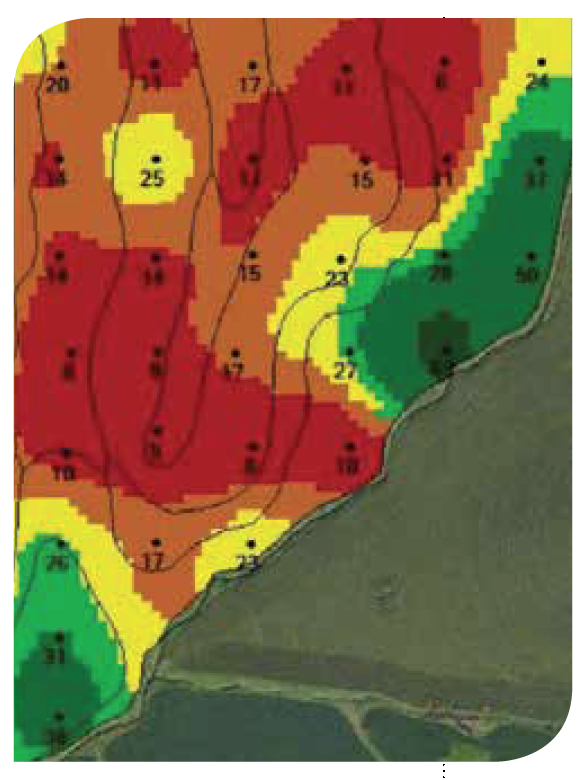
As a farmer, you’re able to control the input side of the equation, which directly affects output.  To effectively lower your breakeven $/bu. and gain efficiency you must manage your input dollars spatially within fields.  All fields have some degree of agronomic variability – yield, soil fertility, elevation, soil type, etc.

It doesn’t make sense to manage inputs at a flat rate across a field when trying to improve farm efficiency or lower your breakeven $/bu.  For example, uniformly lowering your nitrogen rate across an entire field will reduce your input expense, but will limit your yield potential in ‘high productivity’ areas of the field due to the reduced rate.  Conversely, excess nitrogen applied uniformly across the entire field will be wasted on areas with lower yield potential to begin with, dragging down efficiency.

corn cost per bushelUnderstanding and managing variability within each field is key to improving efficiency (lowering your breakeven $/bu.).  Flat rate additions or reductions in inputs can have a significant impact on efficient production.

People are always looking to improve everyday tasks to make their lives more efficient, it’s important to have that same mindset for farming.  Remember that production (yield) is a key component of the efficiency equation, but knowing what it takes to achieve a specific level of production takes you to the next level of understanding profitability.

In part 2 of this series we’ll show you how to understand your profitability and see where you are leaving money on the table. You’ll learn how to make informed decisions and increase your margin.

farm efficiency

Quality Data: Is Bad Data Better than No Data?

If you’ve ever traveled to London and been a passenger on their subway system, the “tube,” you’ve heard the phrase “mind the gap.” It’s kind of funny because that’s not how Americans would say it. We’d probably say “watch your step.” The long straight cars and the curves in the tracks cause the gaps between the train cars and the loading platform; therefore, passengers are warned to “mind the gap.”

This phrase is relevant to all of us who are trying to create value from data. The gap we need to mind is the gap in time that exists between when the field is harvested and when results can be delivered to the grower. Historically the gap exists for several reasons. Many growers tend to be focused on the task at hand in the fall – the physical work of getting the crop harvested, lime and nutrients applied, and in some cases, tillage operations. Downloading yield cards is something they can do later; the same goes for the decisions the will make from the data. Harvest season priorities and decisions tend to focus on where to take a bumper crop when the “wet” bin is full and the line at the elevator is backed up. Technology offers an answer to close the gap, and the wireless transfer of data can eliminate the gap, but there is a catch – data quality.

I get challenged on data quality all the time. Frequently, when I present at a large conference, there are skeptics and unbelievers in the audience. Usually, someone will make a comment about “all the bad yield data out there.” My response is to defend growers. If I’m a grower and I’ve never made a decision using my yield data, after a few years I will likely quit caring about calibration. But Premier Crop’s experience is that when growers understand how they can use their data to make better decisions, they drive everyone involved crazy in getting their data perfect! If their grain cart scales say the field average is 236.7 bushels per acre and their yield file says 229.7 bushels per acre, they expect us to correct the yield file. So while it might be true that many farmers haven’t taken the time in the past to calibrate their yield monitor, there is a logical reason for their lack of attention.

Telematics – being able to send data wirelessly – offers advantages to al lot us in agriculture. But in many cases, it can mean we have sped up how fast we move inaccurate data. And you know the saying: “garbage in, garbage out.”

At Premier Crop, our customers are in the thick of delivering data analysis results to growers. For our customers and staff that means a lot of “fixing” data. But data fixing doesn’t stop at the yield file. Why would data need to be fixed? Many times, it’s because something didn’t get logged correctly or as completely as needed.

Many companies are now offering data analysis solutions that rely heavily on telematics as their services backbone. I saw an example recently where the company was providing independent benchmarking for genetic performance by soils driven by their telematics solution.

The problem is many times not all the data needed to provide quality analysis is logged. Five different growers might have logged that they were planting Channel 207-13. But that hybrid has five different trait combinations ranging from conventional to SmartStax (see table for examples). Averaging the yields for all five trait combinations into one number isn’t an accurate comparison.

premiercropblog_baddatabetterthannodata

Quality data analysis relies on quality data. And quality data requires hard work and attention to detail. Even though we can use technology to make the timing gap smaller, we all must still “mind the gap.”

Use Data to Drive Cuts

Where to cut expense in tough times! Row crop agriculture now faces that question. Big company solutions to this dilemma are already resulting in massive layoffs or job cuts.

U.S. agriculture is efficient. If measured as output per person, our industry continues to increase productivity at an amazing pace. We’ve stretched what one person is capable of producing with capital investments in equipment, facilities and technology. Row crop farming can’t be cut by issuing pink slips, as many experts predict a coming labor and talent shortage in agriculture.

If cutting labor costs isn’t an option, where can you cut? I believe that your data is the only place to look to make cost-cutting decisions.

premiercropblog_usedatatodrivecuts

Explore these data examples to find expense cuts:

1. What farms to farm? Several years ago, one of our grower customers was asked by a big company exec for an example of a decision they had made using their data. Their very first answer was “we no longer farm in Liberty township.” They explained that their cost per bushel data over a five-year period proved that Liberty was the least profitable direction to grow their operation. Land costs, yields and competitive pressure made margins too tight to justify farming in that area.

2. Trait vs. insecticide decision and tradeoffs? Rotating pest treatments is one Integrated Pest Management strategy but it also might be a great expense saving strategy for some fields. use your data to sort out tradeoffs and determine if paying for both a biotech trait package and an insecticide is profitable.

3. Where to apply manure? Most growers now view manure as a resource and not a waste product – use that philosophy and your data to guide which fields receive treatments. Here’s a hint – those fields won’t be closest to the source!!!

4. Where to invest in P and K? This is where many growers make the wrong decision – they either cut applications on all their acres or they flat rate a “maintenance” application on all acres. Use your data to go field by field – looking at low fertility areas. Are there enough acres to warrant a variable rate application? If you’ve invested in building your soil fertility bank, use it wisely. Cut only in the areas where levels are high enough to support next year’s yields without additional applications.

Crop rotation by field? In parts of Manitoba, a wheat, soybean, canola rotation breaks the disease cycle. In central Kansas this fall, the grower I visited harvested soybeans and seeded wheat that same day – how cool is that for an Iowan. No matter where I travel, it is obvious certain fields do better with certain crop rotations. Your data can be your guide for this decision.