Where to cut expense in tough times! Row crop agriculture now faces that question. Big company solutions to this dilemma are already resulting in massive layoffs or job cuts.
U.S. agriculture is efficient. If measured as output per person, our industry continues to increase productivity at an amazing pace. We’ve stretched what one person is capable of producing with capital investments in equipment, facilities and technology. Row crop farming can’t be cut by issuing pink slips, as many experts predict a coming labor and talent shortage in agriculture.
If cutting labor costs isn’t an option, where can you cut? I believe that your data is the only place to look to make cost-cutting decisions.

Explore these data examples to find expense cuts:
1. What farms to farm? Several years ago, one of our grower customers was asked by a big company exec for an example of a decision they had made using their data. Their very first answer was “we no longer farm in Liberty township.” They explained that their cost per bushel data over a five-year period proved that Liberty was the least profitable direction to grow their operation. Land costs, yields and competitive pressure made margins too tight to justify farming in that area.
2. Trait vs. insecticide decision and tradeoffs? Rotating pest treatments is one Integrated Pest Management strategy but it also might be a great expense saving strategy for some fields. use your data to sort out tradeoffs and determine if paying for both a biotech trait package and an insecticide is profitable.
3. Where to apply manure? Most growers now view manure as a resource and not a waste product – use that philosophy and your data to guide which fields receive treatments. Here’s a hint – those fields won’t be closest to the source!!!
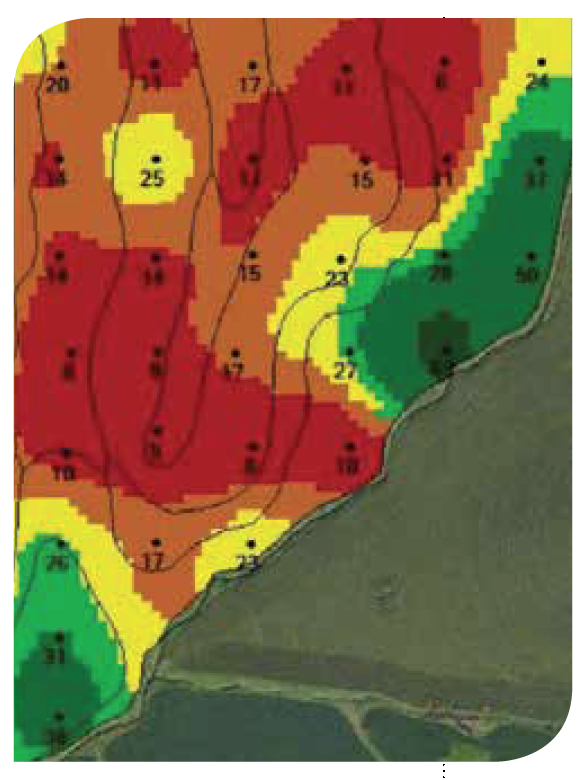
4. Where to invest in P and K? This is where many growers make the wrong decision – they either cut applications on all their acres or they flat rate a “maintenance” application on all acres. Use your data to go field by field – looking at low fertility areas. Are there enough acres to warrant a variable rate application? If you’ve invested in building your soil fertility bank, use it wisely. Cut only in the areas where levels are high enough to support next year’s yields without additional applications.
Crop rotation by field? In parts of Manitoba, a wheat, soybean, canola rotation breaks the disease cycle. In central Kansas this fall, the grower I visited harvested soybeans and seeded wheat that same day – how cool is that for an Iowan. No matter where I travel, it is obvious certain fields do better with certain crop rotations. Your data can be your guide for this decision.
