Trust… But Verify

Every week I see ads using the latest marketing buzzwords to describe how a company is going to use your/their big data to revolutionize how you farm. Estimated rainfall using radar images is being claimed as “hyper-local”. UAV’s, imagery and crop models being claimed to replace scouting for diseases and insects. Proprietary algorithms use big data to manage all your inputs so efficiently it will be “game-changing.” That’s one of my favorite buzzwords- “game-changing.”

I do believe that using your data can and will be game-changing. But I would suggest the “game-changing” may be different from what many companies are expecting.

When Premier Crop (PCS) first began in the late 90s, I drew the comparison between what we’re doing and the Dairy Herd Improvement Association (DHIA). DHIA is a record-keeping database system that documents production by the individual cow – the same as we’re doing within fields. DHIA allowed dairy farmers to benchmark each cow’s performance not just to others in the herd but also to other cows in the database. Genetic selection, nutrition and herd management evolved rapidly as the entire industry moved to data based decision making. DHIA is now the industry standard operating procedure.

So, what are the effects of data based decision-making? Initially, it creates a huge economic advantage for the growers using data to make decisions. Long-term, once a practice becomes industry standard, the advantage is lost and becomes the norm. The most significant outcome is that data based decision-making empowers growers.

data based decision making for corn yield per acre

We are entering a new era in crop production when growers will frequently have better information on product performance than the company producing the product or the selling retailer. The day has arrived when growers, using PCS or a similar system, can evaluate hybrids by yield and profitability in their fields and local geography. Testimonials and “trust me, it works” simply won’t cut it.

Sound harsh? Think about what’s happened to all the feed companies that existed 30 years ago. Most disappeared because the data didn’t prove their products/delivery model provided an economic advantage.

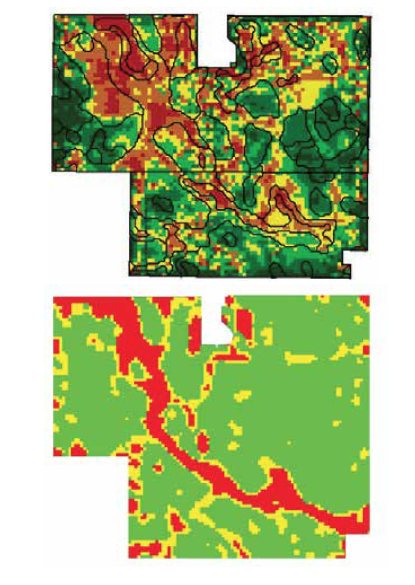
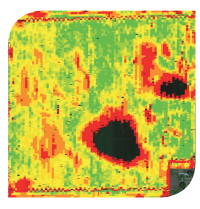
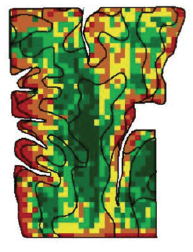
In 2005, PCS introduced our Learning Block concept. We wanted to know whether our VR seeding prescriptions worked, so we added 1-2 acre higher and lower population Learning Blocks in each management zone. We’ve now extended that concept of “checking our work” to VR nutrients and it’s used extensively, especially with nitrogen. If we’re going to put more nitrogen in an area of the field, we can add higher and lower N rate Learning Blocks to validate if we did the right thing. Learning Blocks have proven that our real-world and humble approach to agronomy is warranted.

I’d suggest that companies line up to offer you solutions based on their proprietary algorithms that you adopt the same position as President Reagan did in negotiating arms treaties with the Former Soviet Union – “trust, but verify”.

  1. It’s easy to use your technology to “trust, but verify”. If a company tells you that their proprietary algorithm says you need 50 lbs. of additional N, use your technology to verify.

More Data Helps Data Driven Decisions

At this time of the year, it’s easy to feel like yields are largely a function of weather – temperature and rainfall. Over the years in hundreds of grower meetings, I’ve heard that sentiment repeatedly. If you are inclined to think that way, think about this scenario.

Imagine a flat 160-acre field in your area, farmed by the same grower for 30 years, is going to be auctioned to the highest bidder. The field is unique in that it is all one soil type (I know there is no such field in most acres – but we’re pretending so please play along). Pushing for the highest value, the auctioneer splits the field into two side-by-side 80 acre tracts – selling the field first as two 80’s and then as a 160.

The price received as two 80’s is higher, so the next year two different growers farm each of the 80’s. The entire field was soybeans the year before, so both growers plant corn in their first year farming their new purchase.

Both will receive the same growing degree units and virtually the exact same rainfall. How much yield difference could there be between each of these two 80’s the following harvest?

Over the years, I’ve used this example with growers in small group meetings and usually the answer is in the 40-50 bushel per acre range – sometimes as high as 75-80 bushels per acre difference!

How can there be that much difference? Simple. It’s because management matters!! And the purpose of this column is to encourage you to use your agronomic and economic data to make better management decisions.

We’ve seen it over and over again – similar soils and weather but dramatic differences in results. Usually it’s not one decision but the combination of multiple decisions. This chart is one example:

determine seed selection by soil type

Hybrid and variety selection – it is common to find 20-30 bushels per acre differences on the same soil type and same weather events. A starting place is looking at your own hybrid and variety performance data by soils – both at a field level and across all your entire operation.

Your data can be a guide for not only making next year’s hybrid and variety selection but also where to place specific genetics.

The more data you collect, the more you can make data driven decisions! Applied fertility rates, planting dates, planter performance, trait packages, soil test levels and planting populations are examples of some of the critical agronomic decisions you make every year.

You might be able to hold Mother Nature accountable for the first 50% or even 75% of your yield results, but the other half or less (and all the profit) is your responsibility!

Measuring Yield Efficiency Using a Visualization Platform

We are excited to announce the launch of our new Data Visualization platform, part of our three-tier technology strategy. This new platform allows growers to gain key insights that give them the ability to make informed decisions based off economics, seed, crop protection, fertility, operations and management.

The Data Visualization platform is focused on grower dashboards and group benchmarking ultimately showcasing a Yield Efficiency Score for growers’ operations.


yield efficiency as an ag tech disruption driver


“Data Visualization is a key to helping growers understand their yield efficiency as their measure of success using a Yield Efficiency Score,” stated Darren Fehr, director of sales and marketing.

A Yield Efficiency Score, by Premier Crop, similar to a credit FICO score, is a single number derived from multiple factors. Its purpose is to determine a grower’s return on investment on a per acre basis but from a spatial perspective.

Yield Efficiency is rapidly becoming the most important metric to measure grower’s success in order to enhance a grower’s operation. “Our ultimate success is the grower’s success. We are constantly looking to improve growers’ operations to maximize efficiency and help them be more profitable on the acres they have,” said Tony Licht, business development manager in Iowa.

Premier Crop’s Data Visualization platform and Yield Efficiency Score allows a grower to visually see anonymous group data and grower benchmarking. It provides a benchmarking score how a grower is performing against others as well as against their own fields. Using the grower’s actual data in five of their most important decision-making categories (economics, seed, crop protection, fertility, operations) to prove efficiency and effectiveness of crop production.

bradhagan_centraladvantage

“Group data is powerful over that many acres, allowing us to benchmark with other producers anonymously, which is invaluable information to my operation,” said Brad Hagen, Minnesota corn producer. Brad works with Premier Crop’s partner, Central Advantage GS.

Analyzing Your Yield Map

Hunters and soil scientists may seem like an odd pairing but they have at least one thing in common – they know and appreciate that nature has an aversion to straight lines. Hunters spend a lot of time in and observing the great outdoors and getting an up-close look at the variability Mother Nature molded upon our landscape. Soil scientists not only spend time looking at the curvy contour lines that represent the transition from one soil type to another but their academic training is about the “how’s and why’s” of soil formation over the centuries.

Unlike nature, humans have figured out how to perfect designing straight lines! From early days of the very first mechanical planters and “cultivator blight”, the straightness of our rows was something that created neighborhood envy. Nowadays auto-steer has made it easy.

Straight lines are one of the first “gotcha’s” when studying a yield map. The cause for yield differences that follow straight lines are always man-made! It can be a variety change, a different nutrient application, a crop protection treatment, an equipment performance issue, a tillage pass or even something like a manure application we did years earlier. Seeing a straight line on a yield map instantly leads to digging deeper!

analyze yield data with your yield map

Yield maps are an awesome way to visualize data differences. However, a second “gotcha”, is not paying attention to the map legend! Years ago, I had a college friend send me an image of one of his yield maps, with a note that said “you see, we really don’t have much variability in our area.” But as I studied his map, I noticed that the predominant green color on his yield map had a 40-bushel-per-acre range.

use your yield data to check field variability

The two maps above use the exact same yield data.

There is not a “perfect” way to set map legends. The key is to also LOOK AT THE LEGEND – not just the map!

Data May Reduce Rent

When I’m visiting with growers and advisers, I frequently say that maps are a great way to view data, but the real power lies within the data file that the map represents.

In the ’90s, when yield mapping first became possible, if growers were asked what they learned from their maps, a common response would be “drainage pays.” It’s easy to visually correlate a wet spot with with the low-yielding area of the field because in some cases, you farmed around that area all season long.

can yield maps help with drainage tile placement

Some growers used that visual display of yield loss on a yield map as a tool to create a dialogue with the landowner about the need for drainage tile. The data file that the map represented enabled the discussion to go even further and identifying an obvious problem; it quantified the problem economically. There have been thousands of rented farm ground acres that have been tiled by growers who used their yield maps (and their yield data files) to negotiate an appropriate solution with the land owner.

can I lower my land rent with my yield maps

Some growers make it common practice to share their yield maps with their landowners, while others don’t believe their cash-rent landlords have any business knowing how their fields yielded. The competitiveness of cash rents in many markets makes discussions with landowners stressful and can lead to cautious approaches. Certainly all landowners are not the same, and what they value is different. As we head into tight profit margins, consider what other data-driven discussions you might have with your landowners.

Consider using your soil type maps. In some areas and with some fields, soil types can have a major impact on yields. You can’t change soil types, but when your data says soil types matter, can you manage them differently? Are there soil types or parts of fields that no longer make sense to crop? Does you data suggest that parts of fields that make economic sense to farm at $7-per-bushel levels no longer pencil out at $3.50 per bushel? Does your land owner understand the economic impact of deer herds using the edges of your fields as an all-you-can-eat buffet line?

Rent negotiations can be difficult, but your data is the starting place. Can you use your data to rank each field by profitability? Obviously it’s not as easy as the highest- to lowest-yielding, as costs of inputs and operations, as well as land costs, are major pieces to be considered. Rank your fields over multiple years.

Farming is a business, but what makes it most enjoyable are the relationships that are built, and having those relationships an be an important foundation for rental agreements. Use data to drive your decisions and to enhance those relationships.

Who Owns the Knowledge?

Agronomically, most of us are “land grant” educated. Land grant universities were established with the Merrill Act in the 1860s and served to make the higher education affordable to the masses, including a lot of farm kids. By design, they had an agricultural focus – both in research and education. Even if we did not attend our state’s Land Grant or follow their sports teams, they are the foundation for most of the industry’s agronomic knowledge.

Historically, most of what has happened in “precision ag” applications could be characterized as “measuring variability within fields, using knowledge from Land Grants to write equations to variables apply crop inputs.”

Premier Crop and our customers have been working to create new agronomic knowledge with grower’s geo-referenced agronomic data. It’s messy work. Real world agronomy and the data captured is what I call “the collision of uncontrolled variables.”

Recently there have been headlines about agreements between the industry and farm groups on data ownership and privacy. That’s positive. But it’s really not surprising that a company would agree that you own data and that it will be returned or removed from their servers. Or that you will be allowed to direct whom you will be allowed to direct whom it gets share with or sent to.

Do you ever wonder why a company would even want your agronomic data? Often I think the question that should be asked but isn’t, is this: who owns the knowledge created from your data? Is it the data scientist? The company that combines your data with other growers’? The company that is in the business of mining your data with their proprietary algorithms?

iStock-672067522

I believe that what most growers want at the end of the day is agronomic and economic knowledge on how to farm better and more efficiently. Is the data really what needs protecting or is it more the knowledge created from the data?

There are many different business models being created in data management, no one more right than the next, they are just different. One model is: share your data with us and we’ll use it to tell you how to use our products better. Another model that has been used extensively in the consumer market is the “freemium”, a pricing strategy where a basic service is provided for free to build a user base and lead customers to a premium for-charge service.

Other models will be combinations. Share your data with us, we’ll aggregate it with other grower’s data, develop and calibrate our predictive models, create new knowledge that we own and then we will sell it back to you and other growers.

Another approach is slightly different. Share your data with us, we’ll partner with you and other growers (for a fee) to create agronomic knowledge that you collectively own. That knowledge is shared only with other growers that are part of the database that contributes to the knowledge creation.

The data is only as good as the knowledge you gain form it. Moving forward, how will you view the discussions around data and knowledge ownership?

Got data?

1. This blog has discussed many of the ways data is important, they type of knowledge gained, as well as the decisions to be made, but how have you put it to work for you?

2. What have been some of the positives you have done on your operation that made this year better than last?

3. Think about which business model you are paired with. Is the knowledge you gained from signing away your data in the past worth it?

Use Your Data to Set SMART Goals

At the inaugural Ag Data Conference, Aaron Rahe, one of our Premier Crop advisors, shared his perspective on how he works with his grower customers. Premier Crop was fortunate to hire Aaron is an Iowa farm kid, as he finished his MBA after his five-year stint with the U.S, Navy. Aaron carries his military and business training into how he approaches his work with growers.

Aaron starts each crop year with a discussion about goals – what are our goals for the year? Aaron expects S.M.A.R.T. goals put in writing and shared with the team. His real world experience in leading teams drove home the point that everyone needs to know the objective – same as it is with the team working at your operations and those that support your operation.

premiercropblog_smartgoals

Your agronomic data is perfect for implementing SMART goals for your corn and soybean production (Time-bound). Drilling down in your data makes it easy to be Specific and Measurable.

Let’s think about what a SMART goal might be for the upcoming year.

Your yields were the best ever in 2016, your overall yield average for your corn on corn acres was 220 bu/ac.

This table summarizes 2016 results by management zone and by nitrogen efficiency. A 2017 SMART goal might be to lower your rate of N/bu by on-tenth lb. at the same yield levels. That’s a goal that is very Specific, Measurable, and Tim-bound. But is it Realistic? That translates into lowering total applied N by 22 lbs. of N/acre while maintaining high yields. What if you tweaked your N rates, moving some of your pre-plant N into your early post-emerge application, but reduced overall pre-plant N rates by 20 lbs.? When you advisor looks a aggregated data from growers in your area, for growers with similar yield, the ranges are from 0.9 to 1.3 lbs. N/bu. You’re already more efficient than some, but the data also tells you that setting a SMART goal of 0.96 lb. N/bu is Realistic. At $0.40/lb. N/bu is Realistic. At $0.40/lb. of N, hitting your SMART goals saves over $8 per acre.

premiercropblog_2016dataanalysis

Here are other examples of how you might use your data to set SMART goals for 2017:

  1. Increasing seed efficiency – bushels per 1000 seeds planted. Similar to being more efficient with nitrogen, can you use your variable-rate planting capabilities to be more efficient with your seed investment. Start with your data – if you averaged 200 bu/ac and planted 34,500 across your entire operation, your seed efficiency is 5.79 bu/1000 seeds. Each 1/10th in better efficiency could translate into $2/acre in increased profits.
  2. Increasing planted acres per day – if you are currently at 290 acres/day, is a realistic SMART goal 320 acres/day? What would have to change to make it happen?
  3. Lowering cost/bushel by $0.25/bushel on corn and $0.40/bushel on soybeans. That’s a tough SMART goal because there are so many variables that affect your cost/bushel.

Using your data and committing to SMART goals now can result increased profits. Written and agreed upon goals can focus your entire operation on what’s most important to your farming business.

Quality Data: Is Bad Data Better than No Data?

If you’ve ever traveled to London and been a passenger on their subway system, the “tube,” you’ve heard the phrase “mind the gap.” It’s kind of funny because that’s not how Americans would say it. We’d probably say “watch your step.” The long straight cars and the curves in the tracks cause the gaps between the train cars and the loading platform; therefore, passengers are warned to “mind the gap.”

This phrase is relevant to all of us who are trying to create value from data. The gap we need to mind is the gap in time that exists between when the field is harvested and when results can be delivered to the grower. Historically the gap exists for several reasons. Many growers tend to be focused on the task at hand in the fall – the physical work of getting the crop harvested, lime and nutrients applied, and in some cases, tillage operations. Downloading yield cards is something they can do later; the same goes for the decisions the will make from the data. Harvest season priorities and decisions tend to focus on where to take a bumper crop when the “wet” bin is full and the line at the elevator is backed up. Technology offers an answer to close the gap, and the wireless transfer of data can eliminate the gap, but there is a catch – data quality.

I get challenged on data quality all the time. Frequently, when I present at a large conference, there are skeptics and unbelievers in the audience. Usually, someone will make a comment about “all the bad yield data out there.” My response is to defend growers. If I’m a grower and I’ve never made a decision using my yield data, after a few years I will likely quit caring about calibration. But Premier Crop’s experience is that when growers understand how they can use their data to make better decisions, they drive everyone involved crazy in getting their data perfect! If their grain cart scales say the field average is 236.7 bushels per acre and their yield file says 229.7 bushels per acre, they expect us to correct the yield file. So while it might be true that many farmers haven’t taken the time in the past to calibrate their yield monitor, there is a logical reason for their lack of attention.

Telematics – being able to send data wirelessly – offers advantages to al lot us in agriculture. But in many cases, it can mean we have sped up how fast we move inaccurate data. And you know the saying: “garbage in, garbage out.”

At Premier Crop, our customers are in the thick of delivering data analysis results to growers. For our customers and staff that means a lot of “fixing” data. But data fixing doesn’t stop at the yield file. Why would data need to be fixed? Many times, it’s because something didn’t get logged correctly or as completely as needed.

Many companies are now offering data analysis solutions that rely heavily on telematics as their services backbone. I saw an example recently where the company was providing independent benchmarking for genetic performance by soils driven by their telematics solution.

The problem is many times not all the data needed to provide quality analysis is logged. Five different growers might have logged that they were planting Channel 207-13. But that hybrid has five different trait combinations ranging from conventional to SmartStax (see table for examples). Averaging the yields for all five trait combinations into one number isn’t an accurate comparison.

premiercropblog_baddatabetterthannodata

Quality data analysis relies on quality data. And quality data requires hard work and attention to detail. Even though we can use technology to make the timing gap smaller, we all must still “mind the gap.”

Dig Deep into Data

One of the services Premier Crop provides growers with is community or group data analysis from a regional basis. Growers can confidentially and anonymously share their field data with other growers in their region though written data-sharing agreements. Group data analysis compliments field- and grower- level analysis; growers receive actionable field intelligence they can use on their own fields.

At Premier Crop, we are constantly challenging growers and their advisers to dig deeper into their data. For example, a few years ago one of our customers, a grower we will call Bob, wanted to use data to make decisions on trying to capture the 40-cent-per-bushel early harvest pricing premium his local ethanol plant was offering. Bob’s data analysis considerations started out with the yield penalty for planting earlier-maturity hybrids in his area.

Current and historic data analysis of his and other grower’s data in bob’s adviser’s 100,000-plus acres of multi year group-data database showed a consistent 15 bushel per acre penalty (185 vs. 170) for planting early maturities over the past five years. The adviser and the grower calculated that he needed a 35-cent-per-bushel premium to break even.

Bob’s second question was whether the yield penalty was universal across all soil types. His adviser added soil type to the relative maturity query and the results showed a 10-bushel disadvantage on the lighter soil types, which was about 25% of the grower’s operation. The overall yields weren’t as high on the lighter soils, which might be part of the reason why the penalty was lower.

Planting earlier maturities on lighter soil-type fields dropped the break even premium to 23 cents per bushel – offerings potential $30-per-acre advantage to planting and early-maturity corn and capturing the premium.

The adviser suggested they do even deeper and look at planting date, as well. The adviser’s instincts led to and even more powerful discovery. The reward to earlier planting was (18 bushels per acre) more significant on the lighter soil types than the normal and heavier soil types (10 bushels per acre).

premiercropblog_databyyieldandsoils

That latest discovery didn’t make senses first. Like many growers, Bob liked to plant his “best” fields first – the best being those with the highest yield potential. Because the lighter soils had less yield potential, they tended to be treated as secondary ground. But as Bob and his adviser considered what the data analysis was showing they realized that later planting dates meant pushing pollination back into the hotter and drier weeks of summer. The lighter soils didn’t have as much water-holding capacity as the normal and heavy soils, which were better able to handle stress without losing yields.

So, do you think Bob planted earlier maturity corn on his lighter soils first and captured the early harvest fall premium? More than likely, but I’m not positive. However, I do know the entire process led to the purchase of an additional planter. The planting date analysis was so overwhelming it was easy to justify the addition of equipment needed to plant all his acres earlier. As convincing as the analysis was on the lighter soils, Bob was unwilling to potentially lose 10 bushels per acre on his best soils by switching planting order.

And imagine his delight in being able to use data to justify to his wife why buying more equipment was the right answer!

Got Data?

1. In what parts of your operation, are you looking for actionable data to help mae a tough decision? Keep digging into your data. More than likely, the “first layer” is only a step in the right direction. Although it may take more time, digging into a second and third data layer may provide discoveries that are well worth the effort.

2. What areas of your operation can you gain efficiencies? Ask you trusted advisor to help you dig through some not-so-obvious data layers to find savings.

Real Agronomic Complexity

Several years ago, I had customers tell me we could grow our company a lot faster if we had something like their planter monitor that flashed the dollars being lost from poor singulation. We needed something visual on a display, changing as growers moved across their fields to get their attention. Something cool.

Back in the days of overhead projectors, I remember seeing a slide of rain barrels with each stave labeled with a different nutrient and various heights. I later learned that the rain barrel illustration is centuries old, made famous as Liebig’s law of minimum: Plant growth is controlled not by the total resources available, but by the scarcest resource or limiting factor. The message of the rain barrel is that over-applying one nutrient won’t pay if another nutrient is more yield-limiting. For example, applying the latest micro nutrient blend isn’t likely to do you any good if your phosphorus and potassium levels are low. The rain barrel was a great illustration of the need for balanced fertility.

In the real world, the crop production rain barrel has many other staves that can be just as yield-limiting as nutrients: hybrid and variety selection, insect control, seeding rate, disease management, tillage compaction, crop rotation, planting date, soil type, drainage, and the list goes on and on. Identifying and managing what is profit and yield-limiting in parts of each field is the ultimate goal of analyzing your data.

premiercrop_blog_agronomiccomplexityrainbarrel

Your inputs aren’t just nutrient, seed and crop protection products. Your only choices extend to your equipment choices and data recorded from your equipment can represent additional staves in your crop production rain barrel. Singulation, downforce and downforce margin are additional data layers that companies like Premier Crop now analyze, along with “normal” data layers collected with your planter, like seeding rate and logged hybrid or variety. But what does your yield data say about the relationship between singulation and yield?

How do you explain what seems to be profoundly obvious in the planter cab as the monitor flashes negative dollar amounts, when it’s no longer apparent at harvest when comparing that planting data to your yield results? One obvious answer is that your planter data is more refined than your yield data. Your planter monitor can tell you how each row or your 24-row planter is performing, but your combine head aggregates 12 rows into one yield measurement at the yield monitor.

But there may be other reasons why idea singulation doesn’t always seem to be driving your yield results. As important as getting the picket-fence-perfect stands is, in many situations, singulation may not be the variable that is most yield-limiting – the lowest stage in that fields or part of a fields rain barrel.

I am a believer that agronomic common sense and real-world observations tell us that avoiding doubles and poor seed spacing is critical to higher yields. But they are only a few staves in a very complex agronomic rain barrel, and the dollar signs flashing on the monitor screen are only real if proper seed placement is your lowest stave. Searching for profit-limiting variables will lead you to collect and analyze as many layers as possible, and to create “deep” data sets for each of your fields. Anything less would be to pretend that what is truly complex, is not.