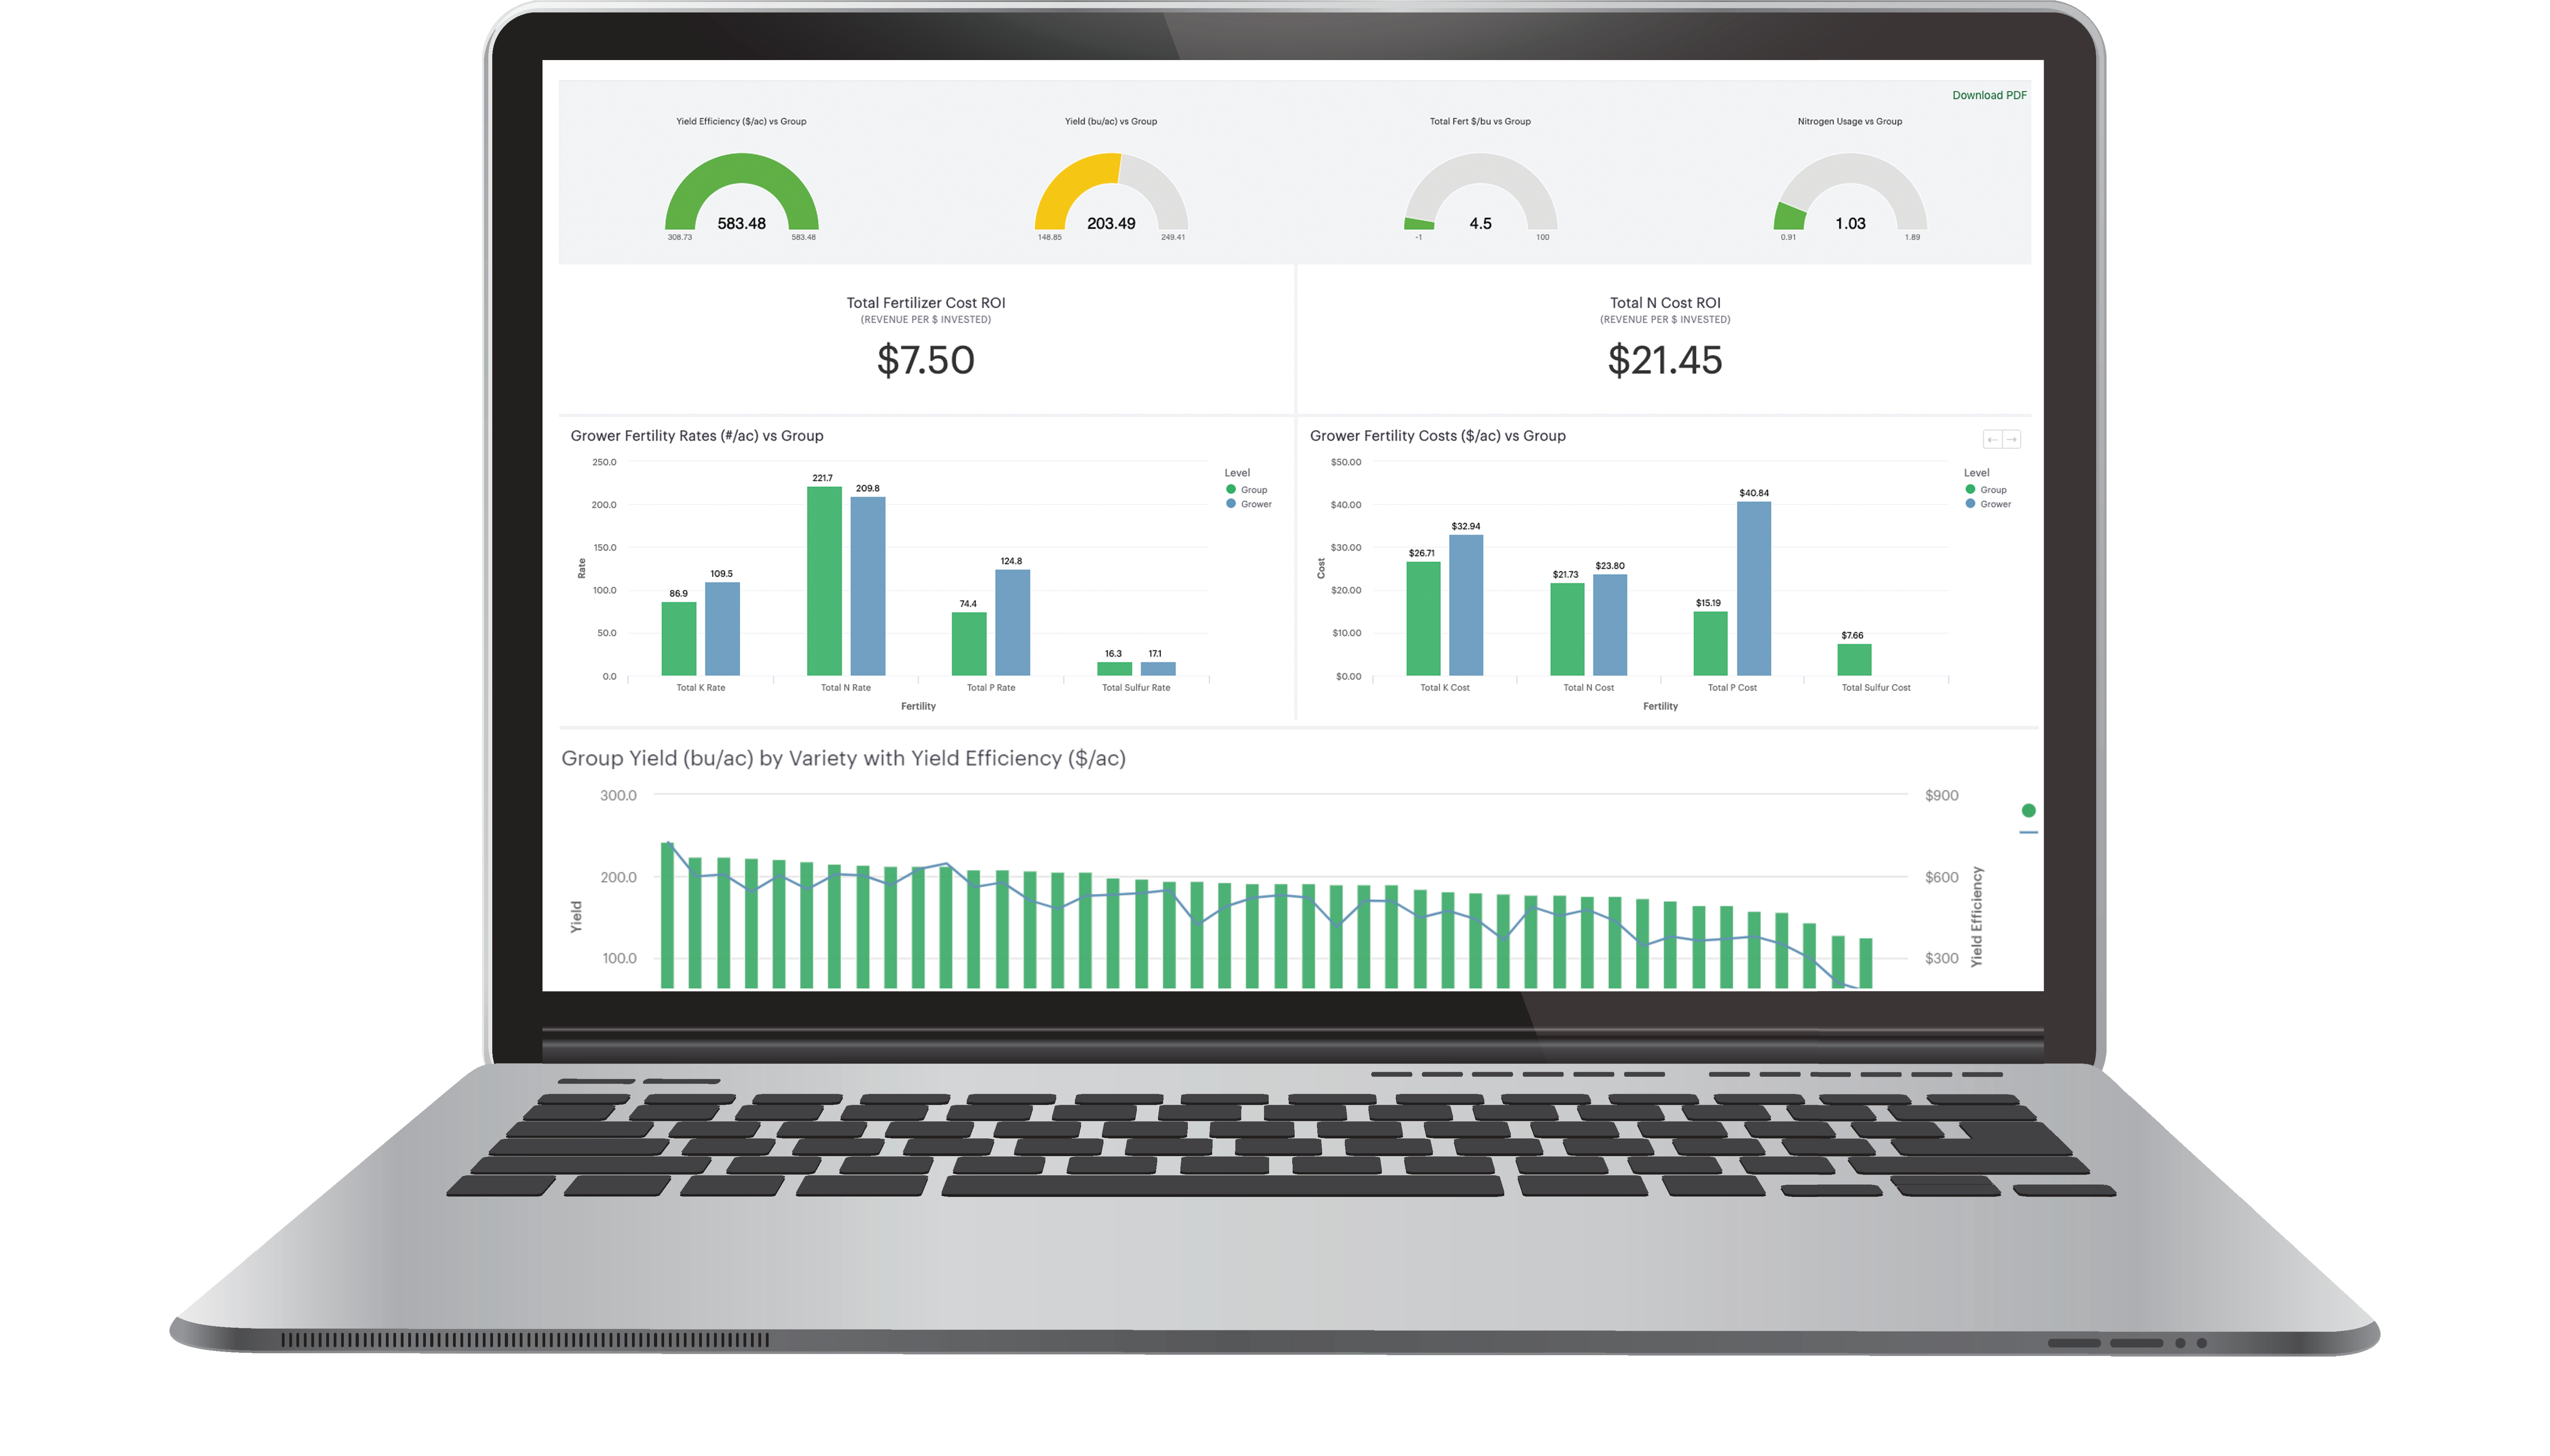
We are excited to announce the launch of our new Data Visualization platform, part of our three-tier technology strategy. This new platform allows growers to gain key insights that give them the ability to make informed decisions based off economics, seed, crop protection, fertility, operations and management.
The Data Visualization platform is focused on grower dashboards and group benchmarking ultimately showcasing a Yield Efficiency Score for growers’ operations.

“Data Visualization is a key to helping growers understand their yield efficiency as their measure of success using a Yield Efficiency Score,” stated Darren Fehr, director of sales and marketing.
A Yield Efficiency Score, by Premier Crop, similar to a credit FICO score, is a single number derived from multiple factors. Its purpose is to determine a grower’s return on investment on a per acre basis but from a spatial perspective.
Yield Efficiency is rapidly becoming the most important metric to measure grower’s success in order to enhance a grower’s operation. “Our ultimate success is the grower’s success. We are constantly looking to improve growers’ operations to maximize efficiency and help them be more profitable on the acres they have,” said Tony Licht, business development manager in Iowa.
Premier Crop’s Data Visualization platform and Yield Efficiency Score allows a grower to visually see anonymous group data and grower benchmarking. It provides a benchmarking score how a grower is performing against others as well as against their own fields. Using the grower’s actual data in five of their most important decision-making categories (economics, seed, crop protection, fertility, operations) to prove efficiency and effectiveness of crop production.

“Group data is powerful over that many acres, allowing us to benchmark with other producers anonymously, which is invaluable information to my operation,” said Brad Hagen, Minnesota corn producer. Brad works with Premier Crop’s partner, Central Advantage GS.
