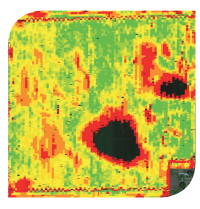
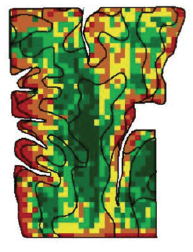
When I’m visiting with growers and advisers, I frequently say that maps are a great way to view data, but the real power lies within the data file that the map represents.
In the ’90s, when yield mapping first became possible, if growers were asked what they learned from their maps, a common response would be “drainage pays.” It’s easy to visually correlate a wet spot with with the low-yielding area of the field because in some cases, you farmed around that area all season long.

Some growers used that visual display of yield loss on a yield map as a tool to create a dialogue with the landowner about the need for drainage tile. The data file that the map represented enabled the discussion to go even further and identifying an obvious problem; it quantified the problem economically. There have been thousands of rented farm ground acres that have been tiled by growers who used their yield maps (and their yield data files) to negotiate an appropriate solution with the land owner.

Some growers make it common practice to share their yield maps with their landowners, while others don’t believe their cash-rent landlords have any business knowing how their fields yielded. The competitiveness of cash rents in many markets makes discussions with landowners stressful and can lead to cautious approaches. Certainly all landowners are not the same, and what they value is different. As we head into tight profit margins, consider what other data-driven discussions you might have with your landowners.
Consider using your soil type maps. In some areas and with some fields, soil types can have a major impact on yields. You can’t change soil types, but when your data says soil types matter, can you manage them differently? Are there soil types or parts of fields that no longer make sense to crop? Does you data suggest that parts of fields that make economic sense to farm at $7-per-bushel levels no longer pencil out at $3.50 per bushel? Does your land owner understand the economic impact of deer herds using the edges of your fields as an all-you-can-eat buffet line?
Rent negotiations can be difficult, but your data is the starting place. Can you use your data to rank each field by profitability? Obviously it’s not as easy as the highest- to lowest-yielding, as costs of inputs and operations, as well as land costs, are major pieces to be considered. Rank your fields over multiple years.
Farming is a business, but what makes it most enjoyable are the relationships that are built, and having those relationships an be an important foundation for rental agreements. Use data to drive your decisions and to enhance those relationships.
