
Increasing return on investment for every input is clearly on the mind of every grower. They are in an economic squeeze, but that doesn’t mean they won’t invest more in the crops. It does mean they are scrutinizing every dollar they spend. The current success measure now goes beyond yield increase to include which inputs offer better return on investment.
During Premier Crop’s 20 years in business, one of the most dramatic changes has been the evolution of the bio-tech seed industry. University of Illinois research shows per-acre seed investments have increased 4 to 5-fold in that time. While yields have increased, seed cost per bushel produced has also increased 4-5 times. Part of the increased cost/bushel has been offset by reduced herbicide and insecticide/acre investments.
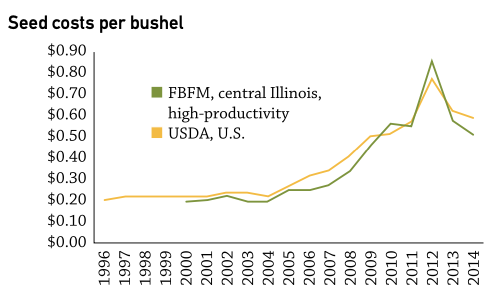
But this is not your father’s seed investment! The times and economics associated with managing your seed investment have changed and deserve more attention.
The return on investment for managing your seed investment within fields through variable rate seeding has never been higher. How do you know your ROI on variable rate seeding? For Premier Crop, the answer has always been tying input cost to the as-planted or as-applied files, dding all input, land, management costs to generate a cost per bushel map for each field. Why cost/bushel versus a profit map? Our experience is that the first step in a solid grain marketing plan is knowing your cost per bushel of production. Grain marketing in most operations can be a 12-month process and we want to be able to deliver results and analysis as soon as the yield file is processed.
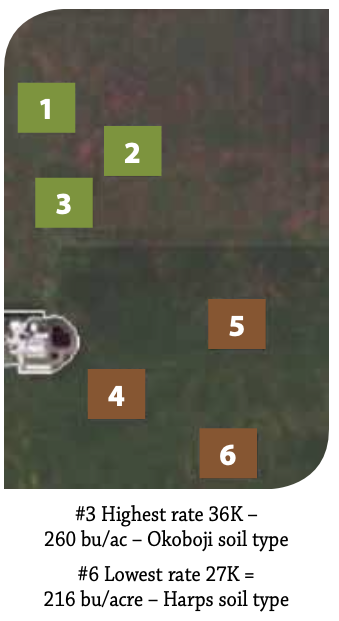
Consider this field’s story: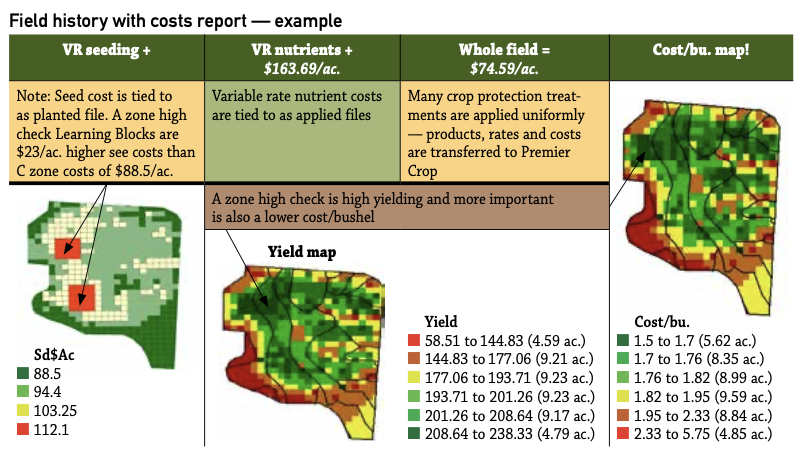
Originally published in Corn and Soybean Digest.
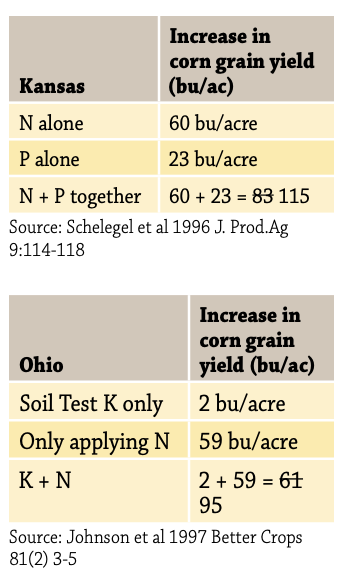
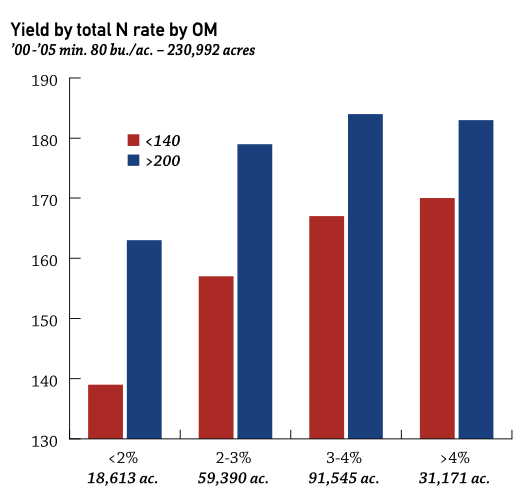
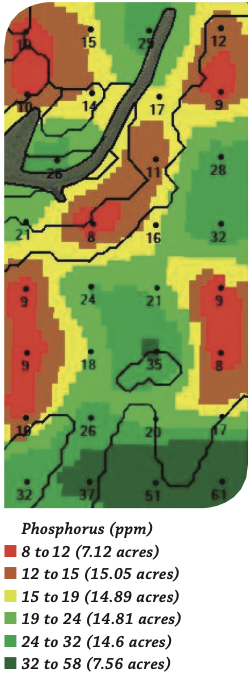
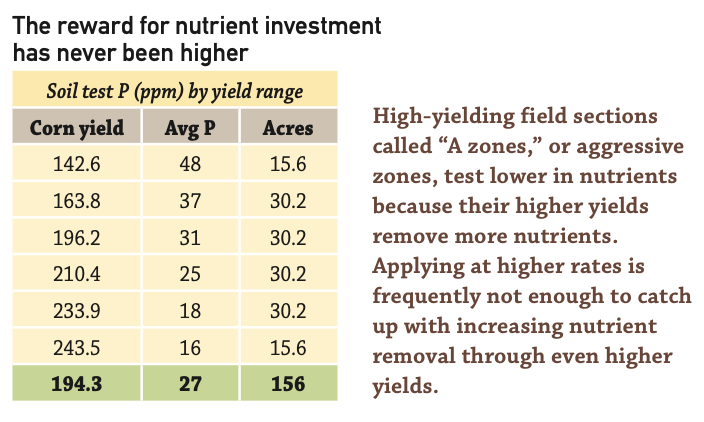 In many fields, a comparison of yield and fertility data will show the lower-testing parts of the field are the highest yielding. These high-yielding parts of the field are what we define as “A zones,” A standing for aggressive. A zones can test lower in nutrients because consistently higher yields remove more nutrients (see table). Even though variable-rate applications might put more nutrients on these A zones, it is frequently not enough to catch up with increasing nutrient removal through even higher yields.
