Data Driven

Fourteen Years’ Data Guide Darle Elkin’s Decisions
Darle Elkin, Webster City, IA, monitors variable- rate planting (intended and actual rate), row shutoff control, acres/hour, hybrid/variety being planted, GPS location details, insecticide application rate, air cart fan speed, ground speed and amount of seed left onboard.

Darle Elkin used to man Air Force nuclear weapon guidance systems, so it’s probably not surprising that his tractor cab looks like Houston Mission Control.

Since his days of launching missiles from bunkers in the 1970s, he’s replaced his sextant and celestial navigation with GPS and databases. On his Webster City, IA, farm, his 14 years of field data are a treasure trove of cause and effect.

His agronomic records drive decisions such as corn hybrid selection, fertility programs, variable-rate plant populations, crop rotation, nitrogen stabilizer use, and where and when to use corn fungicides. He uses his data to select offensive and defensive soybean varieties, and plants each bean in the area of the field that it fits best.

Variable-rate planting as well as crop nutrient applications have been the norm on his farm for 5 years. Darle doesn’t like to make decisions based solely on intuition. “I have this data,” he says, “and I use it.

“Ben Rahe, our Premier Crop advisor, and I define A,B,C management zones on our farm based on GPS yield data, soil type, drainage, fertility, organic matter – any of the factors we can measure that affect our profit potential,” Elkin says.

“The A zones are where we aggressively push plant populations, fertility and spend more money to make money. Our corn population there might be 36,00038,000/acre. The B zones are the current field average values. We might plant corn there at 34,000. By contrast, the
C zones are where we use inputs conservatively, not wasting money where there’s a drainage problem or sandier soils. We free up inputs to put on the A zones, and preserve the profits across all zones,” he says.

This approach of variable-rate inputs is like knowing how many people are coming to dinner, so that you prepare enough food. Elkin lives to experiment. His maps show him how variable-rate inputs and seeding rates affect his profits. This year he added nitrogen stabilizers as another variable in the mix. He uses a 1 to 2acre check within field zones to contrast his experimental seeding and fertility rates with “standard” practice.

“We use checks on almost all the fields, experimenting with populations from 28,000 to 40,000, and variable-rating the nitrogen,” he says.

All these variable-rate treatments make for a large number of map layers, each representing areas within fields with different soil characteristics, input treatments, seeding rates, hybrid placement and yield histories. “That’s where Premier Crop’s database helps me out,” Elkin adds. “Their system helps make studying my fields and using my information efficient.

“The first time that we put all these map overlays together, it was the ‘wow’ factor,” Elkin says.

One experiment that’s attracted attention from the neighbors and ag journalists is his multiple soybean variety placement. He pulls an air cart behind his planter, enabling him to plant offensive varieties where conditions are favorable, and defensive varieties in tougher, high-pH soils.

“I have to be 5% ahead of everyone else to stay alive in today’s economic environment,” Elkin says. “Farming is no different than a Nascar race. We all have the same gas, tires, shock absorbers; it’s just how you combine and drive them that wins the race. We use our records to consistently finish among the top 10.”

Elkin’s yield and soil sampling maps date back to 1995. “With that amount of yield data, we can sort out the weather extremes and really bank on the rest of it,” Rahe says.

“The data reduces the number of guesses we have to make by informing our decisions,” Elkin says. “We may not always know why a given part of a field is off by 10 bu., but we can narrow the cause to just a few factors.”

Elkin can crosscheck and anonymously pool his farm results with his fellow Premier Crop Systems clients. Collectively, they represent 30,000 40,000 acres of local hybrid and agronomic data in a 60mile radius.

“Using their data, our growers can rate hybrids and varieties by profit in their fields,” says Dan Frieberg, Premier Crop Systems co-owner. “Just as dairy producers use DHIA records to benchmark each cow’s performance, our growers can base their decisions on real-world results.”


Originally published in Corn and Soybean Digest. Written by Susan Winsor.

Building the Blocks

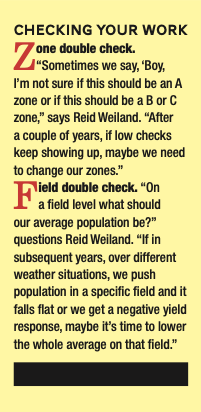
A successful crop means checking your work to track trends.

Blocks have always been linked to learning.

As children, we used blocks to build, testing our theories about the world around us. Stacked and knocked down, these wooden chunks were used to enclose spaces and bridge gaps. They helped us repeat and refine ideas.

It’s a concept that has crossed over into agriculture as farmers experiment with new ways to push every acre of dirt to its fullest potential.
“Every grower, every field, every year is unique,” says Dan Frieberg, President, Premier Crop Systems LLC. “What’s important is continuing to learn, to be willing to verify results and check your work. Our Learning Block concept helps growers continually refine prescriptions and drive yields higher.”

Real-World Application

For decades growers relied on the outcomes from others’ plots to develop recommendations that fit the variability in their own fields.
“Everything we’ve done in agronomy has been based on results from someplace else. A grower then extrapolates the data to fit his fields,” notes Frieberg.

With Learning Blocks, which are portions of land ranging from one to three acres, a grower can create his own test plots to verify the technology he’s bought into is truly working.

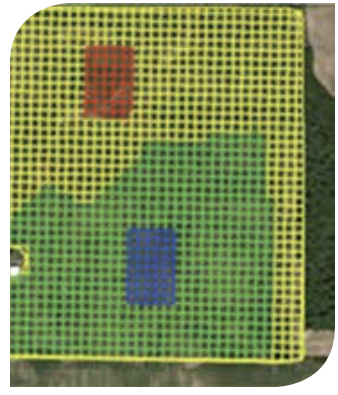
If a grower wants to verify that the variable rate seeding populations he’s implemented are maximizing his field’s potential, he can set up low and high check blocks within management zones. After harvest, an algorithm developed by Premier Crop Systems pulls yield information from the neighboring area adjacent to the blocks and compares the results to verify the population assigned in that zone is being optimized.

For example, if a target population of approximately 38,500 yielded 217 and the neighboring cell with a population of about 36,000 yielded 221, the farmer knows he spent 2,500 more seeds yet lost four bushels per acre.

“It’s a variable rate application a grower can actually see and measure without the high dollar investment and risk,” says Frieberg. “As an advisor, if I suggested to a grower to plant 38,000 in the best part of his field, he might have terrific anxiety about that. Yet, almost every grower would risk two acres because he wants to know how high is high enough. Learning Blocks are a way to take a chance but not risk a lot.”

Gaining Momentum

Garner, Iowa, farmer Reid Weiland knows gaining momentum involves taking risks. Yet, experimenting with the soil wasn’t something he and his father, Don, did much of.

“We were not ones to do a lot of trials on the farm because of the extra time it took,” says Reid. “It just wasn’t how we were set up.”

Learning Blocks allow them to undertake lots of trials without disrupting the flow of the operation, especially in a year like 2013 when the window to plant was so tight due to frequent rains. With a click of a button to load recommendations, Weiland is gathering data to help him better manage the family business.

“We can use Learning Blocks without slowing down because it’s all done basically in the winter,” he explains. “You set up in the winter and analyze in the winter. At the end of the year you generate so much data with really no operational effort at all except for some background GIS work.”

Like many growers, the pair already owns a variable rate planter and yield monitor, so no added investment was needed on the iron side. Yet, there is one area that requires an upgrade. “The difficulty we as producers run into is investing the time to ensure we keep good records and have good data integrity – i.e. investment in management,” notes Weiland.

Beyond management, there are other benefits to be harvested.

“Depending on your variability, you can save enough expense on your poorer quality areas to pay the consultant’s bill and then have the top side open on the better quality acres to increase productivity through investment in higher levels of inputs. Increasing productivity through higher levels of inputs is hard to put a pencil to, but conceptually I believe it makes sense,” says Weiland.

For example, let’s say you farm 80 acres and approximately 15 acres are eroded sidehills or sandy knolls.

“Because you’ve been planting a flat rate or don’t have refined zones, you could be planting 35,000 plants when it is better agronomically to seed 32,000,” explains Weiland. “At $3.50/1,000 seeds you could save yourself $10.50 on 15 acres. This isn’t big money, but then think about the extra P and K and nitrogen you’re putting on because you’re not using zones. You could easily be overapplying $20/ acre in P and K and $15/acre in nitrogen. Now you’ve saved yourself $45.50 per acre, which adds up to $682.50 on that 15 acres or $8.50/acre across the whole 80 acres.”

Breaking It Down

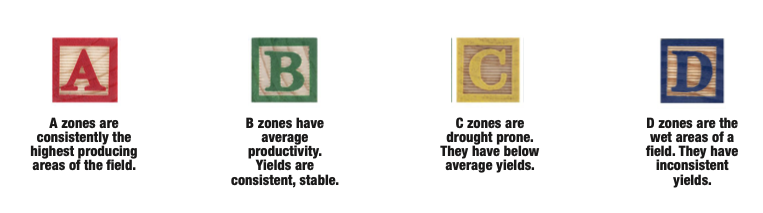
Four years in, the Weilands have divided their operation into four management zones – A, B, C and D.

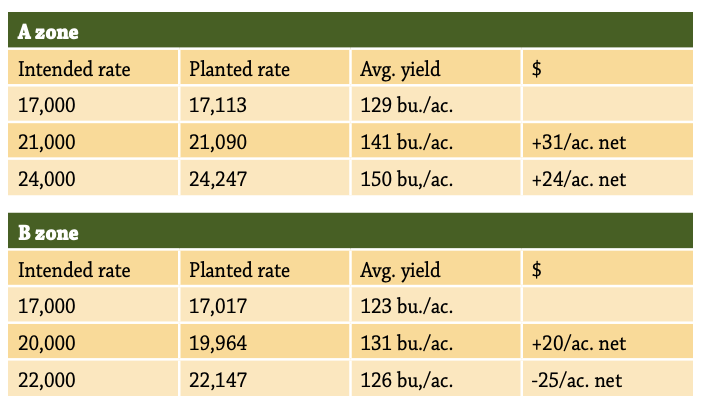
“A zones are consistently the best producing areas of the field,” says Weiland. “We can identify A zones because we’ve studied multiple years of yield data, and we use that information – and common sense – to map out these ‘best of the best’ areas. They’re not necessarily tied to soil types or other physical characteristics, but they’re often well-drained, deep soils with good water holding capacity. We’re most aggressive with nutrient applications and plant populations in the A zones because our odds of getting a return on investment are best there. B zones share some of those same characteristics, but produce at the field average. Their yields don’t jump out at you like the A zones do, and so we maintain normal management practices there.”

Their C zones are the lighter, sandier soils; while the D zones are heavier soils with drainage problems.

“D stands for drown outs,” jokes Weiland.

Because no two fields are alike, one may only have an A and B zone while another may have an A, B and D zone.

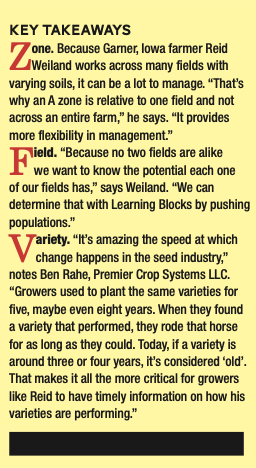
“Working with Premier Crop over the last several years has taught us that an A zone on one field is not the same as an A zone in another field,” he notes. “An A zone is relative to one field and not across the whole operation. This provides more flexibility in management.”

With a bag of seed costing record amounts, variable rate seeding is not so much about lowering input costs but rather reallocating to push populations and reveal what a zone is truly capable of.

“With variable rate seeding on some of these farms we can save $10 an acre pretty quickly by cutting back on our seeding rate,” he says. “Yet, it’s not so much about reducing costs. It’s more about increasing yield.”

The four zones are broken down even further into Learning Blocks.

Blocks are paired in low and high zone checks so they can compare yields to the entire zone’s prescribed population.

For example, in a 450-acre field, an A zone, which is approximately 250 acres, has six Learning Blocks. Each block is 2.5 acres. Blocks
are planted at low and high check target populations and compared to neighboring cells, which are five acres.

“The Learning Blocks help us see what’s going on with our variable rate prescriptions and have become a part of our analytical process.” – Reid Weiland

“Our target population in the A zone on this particular farm is around 36,000. Learning Block #2, which is a high zone check, has a target population of about 38,800, while a low zone Learning Block will be nearly 4,000 less,” explains Weiland. “Once we have harvest data, Premier Crop Systems generates a report that tells us what the target population and yield is for each zone and Learning Block.”

Comparing the numbers, they then verify whether or not the population recommendation for the A zone is where it needs to be or if it needs a bit more tweaking.

“The Learning Blocks help us see what’s going on with our variable rate prescriptions and have become a part of our analytical process,” he says. “We feel that we’re unlocking value that hasn’t been unlocked before.”

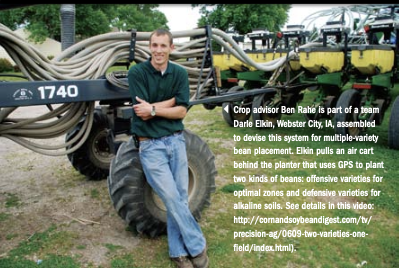
While Weiland uses the concept to ask, ‘What potential does this field have when it comes to yield?’ His Premier Crop Systems advisor, Ben Rahe, comes at it from another perspective.

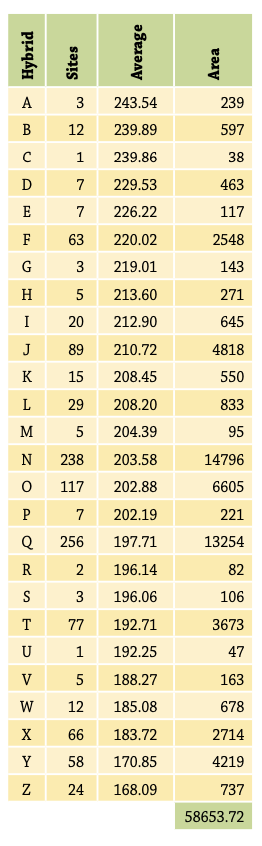
“I look at it and ask, ‘What potential does this variety have? How does it respond when we push populations?’ Learning Block results can mean different things to different people,” says Rahe.

“We take it to a pretty intense level,” says Weiland. “We use them in just about every field. We look at it as an opportunity to learn every year on every variety.”

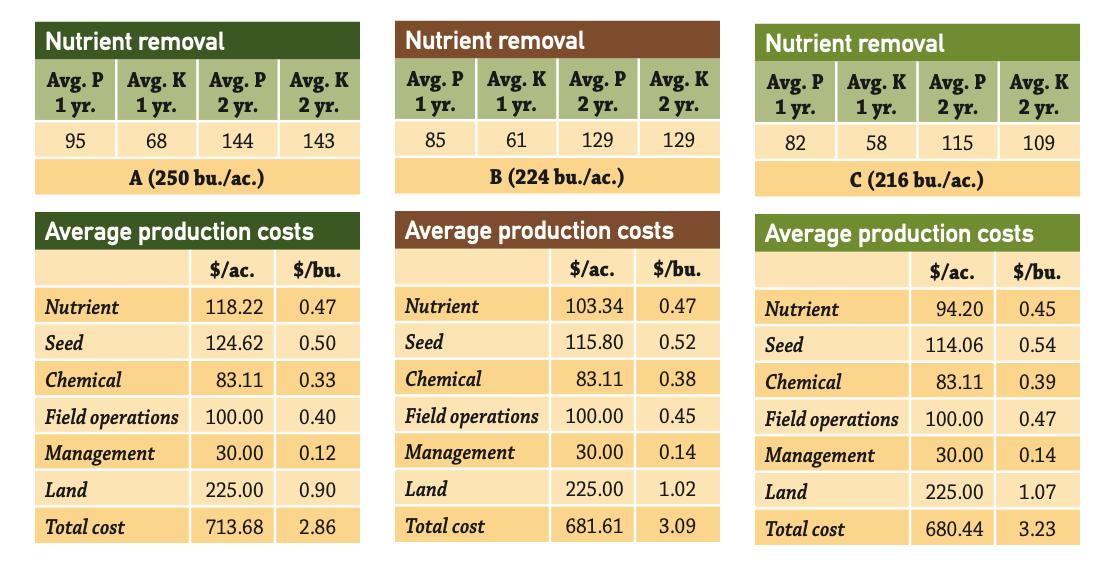
Cost Per Acre vs. Cost Per Bushel

As an extension of pushing A zones, Weiland has begin to look at their fields on a cost per bushel basis instead of a cost per acre basis.

“What we as farmers have been think- ing about for so long is cost per acre,” he says. “I don’t think we’re going to throw that out the window but as acres become more important and valuable, we’re going to have to shift that paradigm to cost per bushel. Once we begin to think in that paradigm the idea of pushing our A zones becomes natural.”

Weiland adds that, “If we can raise our productivity, our cost per bushel is driven down without changing our cost per acre. In a world where we have $20,000 per acre land what’s going to be the driver is your cost per bushel not your cost per acre.”

While times are good in agriculture right now, productivity is what counts when times get tough because you can only cut costs so much.

“As an example, over the past 20 to 30 years, when things get tough P and K are where farmers cut costs. But those nutri- ents are the foundation of our crop yields and today farmers realize that the answer is the other way,” explains Weiland. “You can’t really cut that cost without hurting yourself in the long run.”

Yet, you still have to drive that planter across every acre.

“Even if you cut P and K, you still have those base costs,” he says. “If you can raise that revenue on the other side through yield and drive the cost of your planter pass down, that’s where we’re going to better our margins. That’s what Learning Blocks are all about.”


Originally published by Laurie Bedord in Agriculture.com.

Who Owns The Knowledge?

Agronomically, most of us are “land grant” educated. Land grant universities were established with the Morrill Act in 1860’s and served to make higher education affordable to the masses, including a lot of farm kids. By design, they had an agriculture focus — both in research and education. Even if we did not attend our state’s Land Grant or follow their sports teams, they are the foundation for most of the industry’s agronomic knowledge.

Historically, most of what has happened in “precision ag” applications could be characterized as “measuring variability within fields, using knowledge from Land Grants to write equations to variably apply crop inputs”.

Entering our 17th crop year, Premier Crop and our customers have been working to create new agronomic knowledge with grower’s geo-referenced agronomic data. It’s messy work. Real world agronomy and the data captured is what I call “the collision of uncontrolled variables”.
Recently there have been headlines about agreements between the industry and farm groups on data ownership and privacy. That’s positive. But it’s really not surprising that a company would agree that you own your data and that it will be returned or removed from their servers. Or that you will be allowed to direct whom it gets shared with or sent to.

Do you ever wonder why a company would even want your agronomic data? Often I think the question that should be asked but isn’t, is this: who owns the knowledge created from your data? Is it the data scientist? The company that combines your data with other growers’? The company that is in the business of mining your data with their proprietary algorithms?

I believe what most growers want at the end of the day is agronomic and economic knowledge on how to farm better and more efficiently. Is the data really what needs protecting or is it more so the knowledge created from the data?

There are many different business models being created in data management, no one more right than the next, they are just different. One model is: share your data with us and we’ll use it to tell you how to use our products better. Another model that has been used extensively in the consumer market is the “freemium”, a pricing strategy where a basic service is provided for free to build a user base and lead customers to a premium for-charge service.

Other models will be combinations. Share your data with us, we’ll aggregate it with other grower’s data, develop and calibrate our predictive models, create new knowledge that we own and then we will sell it back to you and other growers.

Another approach is slightly different. Share your data with us, we’ll partner with you and other growers (for a fee) to create agronomic knowledge that you collectively own. That knowledge is shared only with other growers that are part of the database that contributes to the knowledge creation.

The data is only as good as the knowledge you gain from it. Moving forward, how will you view the discussions around data and knowledge ownership?

Got data?
  • Our column has discussed many of the ways data is important, the type of knowledge gained, as well as the decisions to be made, but how have you put it to work for you?
  • What have been some of the positives you have done on your operation that made this year better than the last?
  • Think about which business model you are paired with. Is the knowledge you gained from signing away your data in the past worth it?


Originally published in Corn and Soybean Digest.

Soil Type ≠ Silver Bullet

We’re fortunate in the U.S. to have digitized soils. What historically used to be contained in a book of maps is available in electronic form. Literally, every precision ag platform has the ability to use soil types, texture, slope and other associated soils layers as part of their offering. For many offerings, soil types are foundational — they are a basis for generating variable rate prescriptions and for analyzing results.

Differences in soil type, texture and slope can be an important consideration in using your data to make better decisions. But I would encourage you to look deeper. I still remember a presentation in the late 1990’s from two USDA ARS scientists, Doug Karlen and Tom Colvin. It was the early days of precision ag and in their initial test field using AgLeader’s 2000 yield monitor, they discovered that there were
more yield differences within soil types than between soil types. While that might not be surprising to some, it was too others. It signaled that yield variability can’t be explained by just understanding the variability that Mother Nature created. What we’ve done through human activity over time can be, and frequently is, just as important as nature.

The term silver bullet has been used to describe an immediate and extremely effective solution to a given problem or difficulty, especially one that is normally very complex. Frequently, I get asked “After 20 years of analyzing data, what is most important?” It’s a question looking for a silver bullet answer.

As important as soil type differences can be, soil types are not the silver bullet when it comes to your data. This table is part of an Iowa field report. In Iowa, there is a productivity index tied to soil type — CSR (Corn Suitability Rating) is a 1-100 scale — which is often used when land is rented, bought or sold. Mahaska and Taintor are soils that everyone wants to farm — deep A horizon and naturally well-drained. Clarinda and Lamoni just the opposite. But as you can see from these yield results, for this grower and this field, CSR isn’t
a great predictor of yield. Why? That’s the power of your data — being able to ask and answer the “why” question.

Crop production is incredibly complex with many different interactions. Man-made variability can trump what nature serves up. In this field, their deep data tells a story that proves a history of manure can make less productive soils very productive.

Benchmarking hybrid or variety performance by soil type is far better than not having that benchmark — but your data can go even deeper. It’s not that soil type isn’t important — it is — but it is one of many layers of data that you can use to get closer to an apples-to-apples comparison. Stopping at yield by variety by soil type will lead to an apples-to-oranges analysis — or even apples-to-lemons.


Originally published in Corn and Soybean Digest.

Best Average Rate Costs Profits!

Long before GPS was part of our acronym vocabulary, my early agriculture career started in eastern Iowa and northern Illinois. On one of those scorching hot July days, as you were driving through the area, every so often the road would be higher than the fields and you could visually capture a birds-eye view of the fields below. You could see parts of the fields, where the corn was rolled up tight as the plants went in to “protection” mode — while other parts of the field look perfectly normal. Images like that help make me an advocate that managing parts of the fields differently would make agronomic and economic sense.

Now those “pictures” can be captured in detail with a drone, a plane, or a satellite and further documented with your yield file. Since 80% of the US corn and soybean crop is rain-fed, we can’t solve the problem of running low on moisture in those drought-prone parts of fields. But we can manage those areas by changing the seeding rate — spreading the plants out a few inches can provide more room for the root mass needed to maximize yield and economic returns per acre.

Premier Crop’s new Enhanced Learning Blocks allow users to use the equipment they have already invested in to do randomized and replicated trials. In this dryland Kansas field in 2016, two trials with 3 different planting rates and 5 replications each were conducted. In best area of the field, yields climbed as population climbed. We don’t know how high we should have gone but know that in the A zone (green), 24,000 returned $24 per acre more vs 21,000, including the additional seed investment.

But the results in the B zone (yellow) were much different.

The B zone trial mirrors results from many other 2016 trials — that pushing population too high can not only lead to lower yields but because of higher seed investment, can be very costly.

Consider what these results suggest about farming by the best average rate. If the grower plants 20,000 — the best rate for the B zone on the entire field per acre on the best half of the field. Obviously, planting 24,000 on the entire field would be even worse economically. Pick- ing 22,000 as the best “average” rate — mid way between 20,000 and 24,000 — would result in losing $18/acre on the A zone and $25/acre on the B zone.

If you think this might be worse case, consider that as you move east in the Corn Belt, both seeding rates and yields are higher. The higher the investment (higher seed costs) and the more return (higher yields) equates to even larger benefits to getting the rate correct. The story with nutrients is the same; the ideal rate changes within the field and economic reward or penalty is dramatic. Remember the example of having one foot in ice water and the other in hot water and the suggestion of being just right on average? Farming by averages is costing you profits! We can do better than choosing the best average rate.


Originally published in Corn and Soybean Digest.

And The Winner Is…

Yield results are in and every plot or trial has an overall winner! Winning a plot isn’t easy. Sometimes, luck is involved. Years ago, one of our customers measured the impact of “shading” in a plot. If your company’s hybrid was placed next to taller hybrids, how much did being shaded by a taller hybrid affect yield in the outside rows that were shaded? They found the difference could range from 7.7 to 33 bu/acre penalty from being shaded! In some company’s trial protocols, they discard the outside two rows and only count the results from the inside two rows.

Consistently winning is so difficult that companies frequently report percentage wins. Hybrid ABC won 83% of head-to-head trials vs. Hybrid XYZ. It’s hard to blame seed salespeople for using plot results to sell seed, but that frequently results in promoting the plot winners when they may not be the best fit for your fields.

When using plot data to select hybrids and varieties, the fact that there is only one winner does not mean you scrap other genetics from your line-up. Big data analytics, like those used by Premier Crop, has been referred to as a way of “crowd sourcing” hybrid and variety selection. Same as with plot results, it’s important to look deeper than what hybrid or variety appears to have “won”. This chart is an example of real results of a local data pool — with hybrid identity masked with a letter. In the table, the number of “sites” is the number of unique farm fields and the area column is acres.

Which of these is the best number to plant? Hybrid A is impressive, averaging over 240 bu/acre on three different fields. In order to average 243 bu/acre, there must have been many times the yield monitor was reading over 260 or 270 bu/acre. But I instantly gravitate to Hybrid B — not that much different in yield, but results occurred on twice the acres and on four times more fields!

What do you think of Hybrid F? Many more sites and acres listed, but over 25 bushel per acre less yield.

Hybrid and variety results that are calculated over more acres always show up down the list. Why? It’s not because they aren’t great performers. It’s because they get placed in more diverse and negative growing environments. There are a lot of plot winners that don’t shine when they gain market share. In reality, not all of your fields match the well-drained, high-fertility areas that make for ideal plot location.

The more you can sort results to match your fields and management practices, the better your own experience with specific hybrids and varieties will be. The reality is there is no right way to analyze results, but it is important to examine the data results beyond yield. Number of acres and fields data help you understand why hybrid and variety yields vary. It easier for a hybrid to look either phenomenal or horrible if it is only on a few fields. Conversely, if a variety can stay in the top third as it gains significant market share, it’s likely one of the real winners!


Originally published in Corn and Soybean Digest.

Real Agronomic Complexity

Several years ago, I had customers tell me we could grow our company a lot faster if we had something like their planter monitor that flashed the dollars being lost from poor singulation. We needed something visual on a display, changing as growers moved across their fields to get their attention. Something cool.

Back in the days of overhead projectors, when I started my career, I remember seeing a slide of a rain barrel with each stave labeled with a different nutrient and at various heights. I later learned that the rain barrel illustration is centuries old, made famous as Liebig’s law of minimum: Plant growth is controlled not by the total resources available, but by the scarcest resource or limiting factor. The message of the rain barrel is that over-applying one nutrient won’t pay if another nutrient is more yield-limiting. For example, applying the latest micronutrient blend isn’t likely to do you any good if your phosphorus and potassium levels are low. The rain barrel was a great illustration of the need for balanced fertility.

In the real world, the crop production rain barrel has many other staves that can be just as yield-limiting as nutrients: hybrid and variety selection, insect control, seeding rate, dis- ease management, tillage, compaction, crop rotation, planting date, soil type, drainage, and the list goes on and on. Identifying and managing what is profit- and yield-limiting in parts of each field is the ultimate goal of analyzing your data.

Your inputs aren’t just nutrient, seed and crop protection products. Your input choices extend to your equipment choices, and data recorded from your equipment can represent additional staves in your crop production rain barrel. Singulation, downforce and downforce margin are additional data layers that companies like Premier Crop now analyze, along with “normal” data layers collected with your planter, like seeding rate and logged hybrid or variety. But what does your yield data say about the relationship between singulation and yield?

How do you explain what seems profoundly obvious in the planter cab as the monitor flashes negative dollar amounts, when it’s no longer apparent at harvest when comparing that planting data to your yield results? One obvious answer is that your planter data is more refined than yield data. Your planter monitor can tell you how each row of your 24-row planter is performing, but your combine head aggregates 12 rows into one yield measurement at the yield monitor.

But there may be other reasons why ideal singulation doesn’t always seem to be driving your yield results. As important as getting picket-fence-perfect stands is, in many situations, singulation may not be the variable that is most yield-limiting — the lowest stave in that field’s or part of a field’s rain barrel.

I’m a believer that agronomic common sense and real-world observations tell us that avoid- ing doubles and poor seed spac- ing is critical to higher yields. But they are only a few staves in a very complex agronomic rain barrel, and the dollar signs flashing on the monitor screen are only real if proper seed placement is your lowest stave. Searching for profit-limiting variables will lead you to collect and analyze as many layers as possible, and to create “deep” data sets for each of your fields. Anything less would be to pre- tend that what is truly complex, is not.


Originally published in Corn and Soybean Digest.

Build your Nutrient Data

In case you haven’t heard, there’s a target on your back! Our modern crop production system is on a collision course with the non-farming public who are become more removed from farming with each generation. Many outside of agriculture, including regulators, associate high-yield crop production with being environmentally reckless.

The EPA and states located in the Upper Mississippi watershed are developing strategies to deal with nutrient water quality issues. Even if you don’t farm within this watershed, your farmland is located in another watershed. Every grower needs to be involved in this issue.

As the debate heats up and you find yourself attending meetings addressing how you manage nutrients, you will likely hear the term “nutrient use efficiency” (NUE). In the case of nutrients, like N, NUE is a data calculation that Premier Crop has used since our start: total “pounds of applied N per bushel of corn produced.” I like to think of the NUE discussion as “how can I squeeze the most possible yield out of every pound of N I apply?”

Future NUE discussions may be driven by environmental concerns, but our drive has also been increasing growers’ profitability though more efficient nutrient use. We believe that your data is a vital part to having the best of both worlds — producing high yields and being an environmental steward.

In a column that has national reach, it’s difficult to address any specific nutrient management solution because it changes dramatically by local area. In the Upper Midwest, we are blessed with highly productive soils that are high in organic matter.

Recent university studies show that on average, 50% to 70% of the N that feeds our crop is soil-supplied, not fertilizer-supplied! This means we need to better understand the differences in N-supplying abilities of different management zones in our fields, across farming operations and throughout local areas.

As the late management guru W. Edwards Deming said, “You can’t manage what you don’t measure.” A great starting place for using your data to manage N is calculating your NUE (total “pounds of N per bushel produced”) for each field and by N-management system. Another starting place is to put higher and lower N-rate Learning Blocks within a field’s management zones — the high check Learning Block being 30 pounds more N, and the lower check being 30 pounds less.

Where is your baseline on becoming a better nutrient steward? Your answer should be your data. What better way to find out the truth about how nutrient efficient you are than digging deeper into your yield, soil test, management zone and applied fertilizer data?

Throughout this column we refer to your data being critical to solving problems, but what may be missed is the word “your.” Understanding that your data is yours, and yours only, is of great importance. There is nothing anonymous about GPS data. Be careful — don’t volunteer your data unless you’re sure of the benefit.

Got Data?
  1. What is your “average pounds of N per bushel” for each of your fields? What are the year-to-year trends? Can you use your data to measure NUE differences within your fields?
  2. What other data relates to NUE in your fields? Soils? Organic matter? Cation-exchange capacity? Management zones? Soil test levels of other nutrients? Past manure applications?


Originally published in Corn and Soybean Digest.

Data may Reduce Rent

When I’m visiting with growers and advisers, I frequently say that maps are a great way to view data, but the real power lies within the data file that the map represents.

In the ’90s, when yield map-ping first became possible, if growers were asked what they learned from their yield maps, a common response would be “drainage pays.” It’s easy to visually correlate a wet spot with the low-yielding area of the field because in some cases, you farmed around that area all season long.

Some growers used that visual display of yield loss on a yield map as a tool to create a dialogue with the landowner about the need for drainage tile. The data file that the map rep- resented enabled the discussion to go even further than identifying an obvious problem; it quantified the problem economically. There have been thousands of rented farm ground acres that have been tiled by growers who used their yield maps (and their yield data files) to negotiate an appropriate solution with the landowner.

Some growers make it a common practice to share their yield maps with their landowners, while others don’t believe their cash-rent landlords have any business knowing how their fields yielded. The competitiveness of cash rents in many markets makes discussions with landowners stressful and can lead to cautious approaches. Certainly all landowners are not the same, and what they value is different. As we head into tight profit margins, consider what other data-driven discussions you might want to have with your landowners.

Consider using your soil type maps. In some areas and with some fields, soil types can have major impact on yields. You can’t change soil types, but when your data says soil types matter, can you manage them differently? Are there soil types or parts of fields that no longer make sense to crop? Does your data suggest that parts of fields that made economic sense to farm at $7-per-bushel price lev- els no longer pencil out at $3.50 per bushel? Does your landowner understand the economic impact of deer herds using the edges of your fields as an all-you-can-eat buffet line?

Rent negotiations can be difficult, but your data is the starting place. Can you use your data to rank each field by profitability? Obviously it’s not as easy as the highest- to lowest-yielding, as costs of inputs and operations, as well as land costs, are major pieces to be considered. Rank your fields over multiple years.

Farming is a business, but what makes it most enjoyable are the relationships that are built, and having those relationships can be an important foundation for rental agreements. Use your data to drive your decisions and to enhance those relationships.


Originally published in Corn and Soybean Digest.

Lender as Agronomist

I don’t like it when people generalize about the characteristics of a demographic group — like when people say, “Bald men are better-looking.” There are always exceptions that make those generalizations flawed.

But as much as I dislike generalizations, I’ll offer this one: “Most ag lenders are not trained to be agronomic advisers.” In many cases, ag lenders may be doing exactly that — making agronomic decisions by limiting input investments with a maximum per-acre budget. While your lender may not be an agronomist, there is a fairly good chance that he or she is a “numbers person.”

This field is an example. The map shows breakeven cost per bushel with a field average of $2.88 per bushel. That breakeven wasn’t achieved by treating the entire field as though it had the same potential.

This is where your data can help. Can you use your data, and specifically your agronomic numbers, to your advantage? Can you use your maps to tell a story of how you make the very best input investments? Can you use your data to explain that while flat-rate applications and seeding are easy to budget, they are flawed agronomically and economically?

These yield-driven nutrient removal charts show how higher yields remove more nutrients in the most-productive areas and less in poorer-yielding areas — proving how flat-rate nutrient applications represent over-spending and underspending.

As you can see in the average production costs charts, flat rates equate to spending too much on seed and nutrients in the less-productive areas of fields (yellow and red), and frequently far too little in the most- productive areas (green). Why continue to apply the same rate of nutrients to every acre, when you don’t remove the same rate through yield?

Investing your input dollars to maximize your return on investment is all about where you invest within each zone of your fields! It’s time to use your data to tell lenders the story of how the best agronomics are also the best economics!


Originally published in Corn and Soybean Digest.