The age-old agronomy equation is, “Yield Equals Genetics (G) by Environment (E) by Management (M).” There is a lot of focus on using data to measure hybrid and variety performance, in other words, to sort out the “G” part of the equation. That can start with your own data and but it can also include being part of “group, pooled or community” data. This allows you to anonymously see yield results from both genetics you planted and didn’t plant. Being able to filter results by rainfall, GDU’s and soils helps to address the factors that make up the “E” factor and get closer to apples-to-apples comparisons.
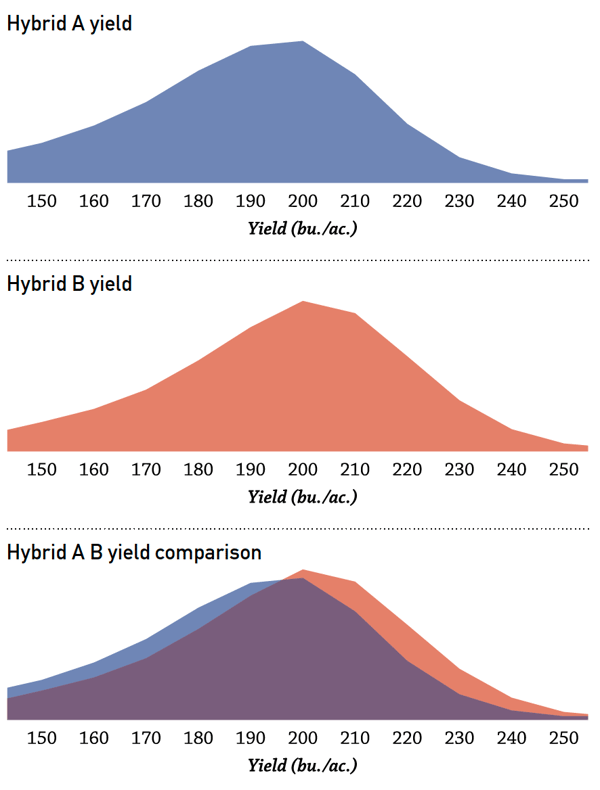
Many times, group data analytics generate results that reduced the comparisons to a single number – the average yield per acre for each hybrid or variety. Many times, that can have the effect of “masking” the deeper story in the data. Another way to visualize genetic performance is to see the yield distribution as a percentage of yield observations.

The blue image is Hybrid A, a popular choice, which averaged 182 bu/acre on 12,560 acres across a local market.
The red image is Hybrid B, another market leader, which averaged 192 bu/acre on 14,712 acres in that same area.
Now look at the yield distributions overlaid. Perhaps this is a more “honest” way to understand yield comparisons.
There are some situations where Hybrid A was actually better than Hybrid B, even though the overall average was 10 bu/acre less. Likewise Hybrid B had higher yields per acre more often than A.
When you visualize data in this manner, it’s easy to understand why one grower can claim Hybrid A was far superior to Hybrid B and yet a neighbor can document just the opposite experience. The real power in data analytics is understanding the situations where each hybrid excels! “Understanding the situations” is really about the “M” part of the yield equation. Realistically, there are a lot of great hybrids and varieties available for most crops. From my perspective, the equation is (?) looks like this: Y = g x e x M!!!!
Management matters far more than most people realize!!!
