
If I asked you if you had a budget, you would most likely tell me you did. If I asked you where you could skim your budget in order to save more for your child’s education, a new truck or a vacation, you most likely wouldn’t know where to start. I know I wouldn’t!
This is really no different than farming. If you don’t have it written out, in detail, with all of your expenses and projected income, would you know where to start to be able to be more profitable?
First, you have to figure out what your profitability is throughout the field. You can do this by adding up all of your inputs on your field (flat rated & variable rated) and adding those costs appropriately. When I say appropriately, I mean making sure that variable rates are accounted for.
Next, you have your income from your crop to add to the equation. But, your yield map is variable, so your cost of production is variable. See where I’m going with this?
Using your data to create a profitability map, like this one, can identify those areas.
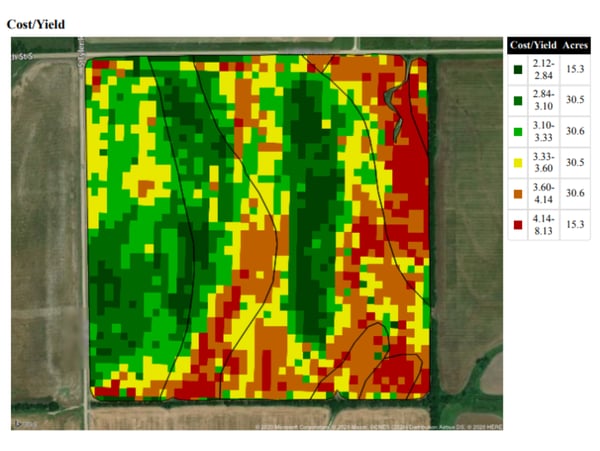
Think about this number: If 10% of your fields are losing money and let’s hypothetically say they are losing you an average of $2.00/bushel, that equates to some serious money loss when you scale it across your entire operation!
But, as my brother asked me once about our own family’s field when I showed him our home field’s profitability map, “That’s great, Katie, but what do you do with this map?” Using the data and the technology that a grower has available to them, that’s when the magic happens.
HERE ARE THREE WAYS A GROWER CAN USE DATA TO BE MORE PROFITABLE
1. STOP TREATING ALL FIELDS THE SAME.
They don’t all produce the same, so why should they have the same yield goals?
2. DEVELOP A PLAN TO SPATIALLY MANAGE YOUR INPUTS WITHIN EACH OF YOUR FIELDS.
You don’t have to have all the latest and greatest technology. But you can use your data to help you improve your profitability within your operation. Your trusted advisor should be able to help you with this if you are unsure.
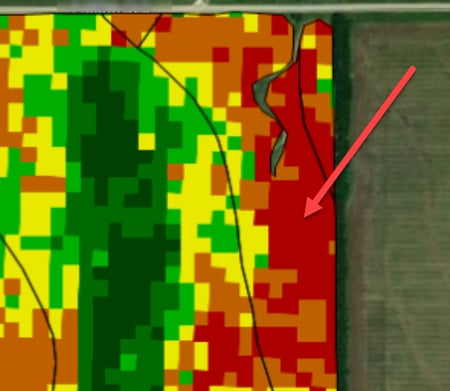
If we look at this example, these areas in red only removed off a portion of the nutrients that areas in green did.
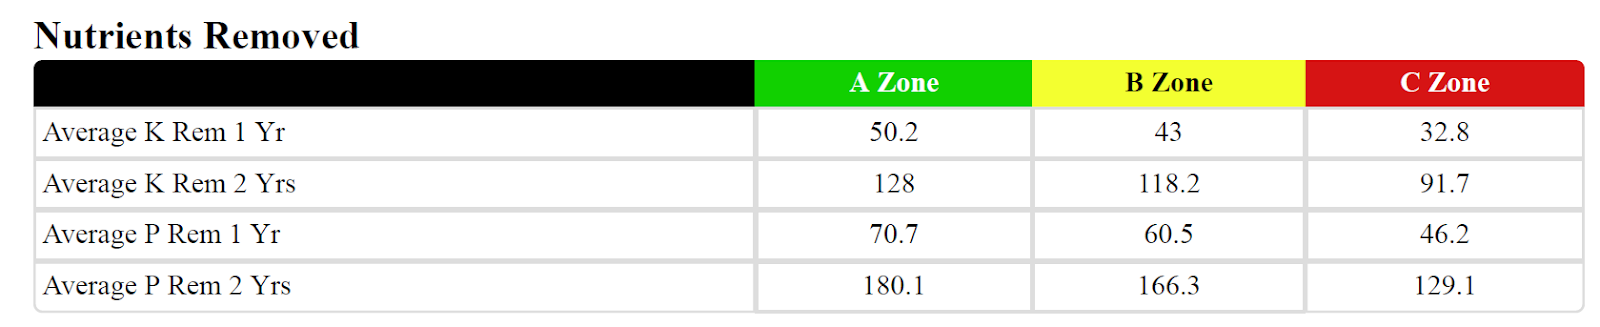
Let’s give a hypothetical example: If we use $310 for the price of MAP and Potash, the difference in dollars removed is $5.20 and $6.30/acre, respectively. We could use this information to make sure that our nutrient application accounts for these values in order to spend our nutrient dollars efficiently. We’re all looking for ways to maximize every dollar and ensure that it returns us the most amount of profit.
3. USE YOUR DATA TO MAKE DECISIONS FOR THE NEXT CROP SEASON.
This requires you to listen to what the data is telling you. Using your data provides you the facts you need to make more profitable decisions.
We were led to believe that the Precision Ag technology could make us money or save us money. However, it’s the DATA that we use in combination with the technology that enables you to be more profitable.
Changing your outcome is only possible when you do things differently than what’s been comfortable. But, just like your own budget, knowing where to change is essential. Your trusted advisor is by your side to help you make these essential decisions and improve your overall farm profitability.