This is a three part series focusing on ways to determine your field profitability using your technology. We will post the series over the course of two months. If you don’t want to wait, you can get the full series here.
__________________________________
In tough economic times, it is more imperative than ever to know your productivity and be able to evaluate the cost or benefit of your decisions. Our mission at Premier Crop is to make this easy for you and give you multiple ways to evaluate across your operation. I will walk you through the different methods of evaluation: cost/bu, variance reports, and learning blocks, along with why each is important.
The first measurement is the cost per bushel on a spatial level to give you a new look at each individual area of your field.
COST PER BUSHEL
Q: What is the end goal of your operation? To raise more bushels to sell at a profit.
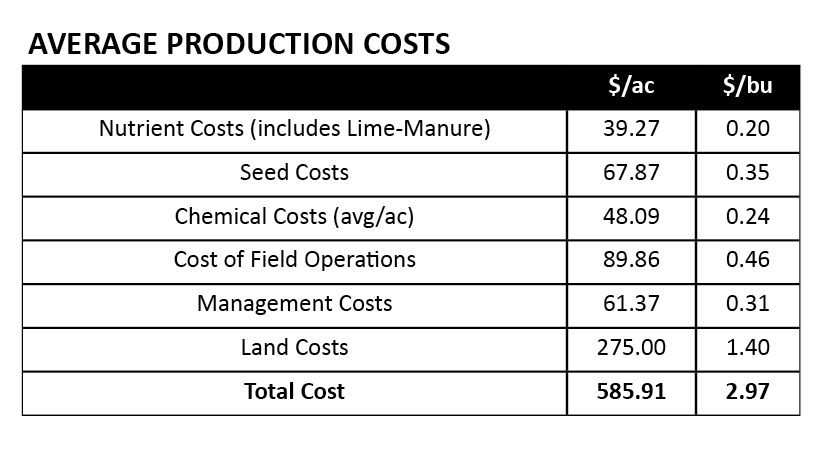
Q: How can you do this if you are basing everything off of cost/ac? Cost/bu should be your end goal. How much did your fertilizer cost you per bushel? How much did your land cost you per bushel? This diagram shows a realistic view of your operation.

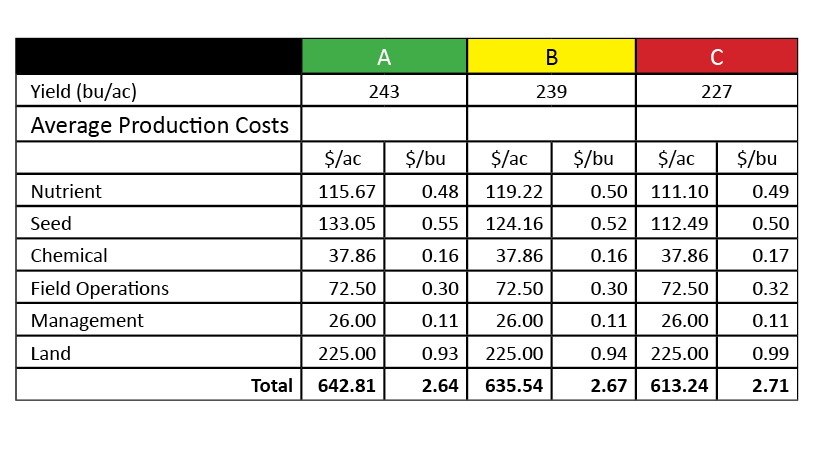
We look deeper than your Average Production Costs to find the impact on your cost per bushel by field. And we go even deeper than only looking at your field, we break down each field into management zones and determine the cost/bu in each unique zone. (see diagram below)

Not every area of your field performs the same and using cost/ac as your main metric of measurement can have detrimental effects on your overall productivity. Let me explain.
Your A zone is the most productive area of your field, it consistently performs well. Your C zone, by contrast, is the area of your field that constantly disappoints you. It never seems to do well and brings your overall field average down. Why would you treat them the same? You may be able to cut your cost/ac in the C zone by giving it less fertilizer and seed, allowing crops more room to spread out and grow, but if you do that in your A zone, you would see a decrease in productivity. Your A zone wants to be pushed, it needs more nutrients and can handle more seed population than the C zone.
This is a detailed look of each field, but sometimes you may want a more broad view of your overall operation to make management decisions. This is when step number two is valuable, by viewing your Field Productivity Report Card.
Stay tuned for our next post featuring the Field Productivity Report Card.
