Learning Blocks

Some people remember phone numbers or slender dates; I remember farm fields. Before the 2005 crop year, the program leaders for Central Advantage from Central Valley Cooperative in southern Minnesota asked me to help generate variable-rate planting prescriptions. The primary question was “agronomically, what makes sense?”

Field by field, I looked at the data collected for historic yields, soils, fertility levels, cation-exchange capacities, etc., and generated variable-rate prescriptions for each field. But I didn’t stop there. I wanted to prove that what I thought made sense agronomically would truly work.

To do so, I put 1- to 2-acre check blocks within each area/population rate of the field. That fall, I carved out the yield for each acre check block and compared it to its surrounding area. I still remember those fields and the stories the check blocks told as we learned and proved concepts.

Since those days, we [Premier Crop] have trademarked the name Learning Blocks™ and have automated the process for analyzing yields inside Learning Blocks compared to the surrounding area via planting, fertilizer and other inputs. In my entire career I have never “sold” anything as popular as Learning Blocks! Growers love them for many reasons. Most notably, they make sense – comparing 2 treated acres to 4 non-treated acres within a management zone is a great apples-to-apples comparison. And, the technology does all the work – the grower does not need to slow down planting or harvesting to learn from the data.

learningblock

Growers enjoy not being told “trust us, this recommendation works”; but rather are given the ability to check and validate the recommendation. In the case of planting, growers can see Learning Blocks by downloading them into their smartphone and physically walking to a Learning Block, verifying the population change. Learning Blocks area low-risk strategy for implementing changes. For example, planting 39,000 plants per acre or increasing nutrient rates across an entire management zone might be a stretch, but every grower would risk a 2-acre Learning Block to test the limits.

Premier Crop has done plenty of strip trials in the past – running different across the entire length of a field. For variable population, the strip trial approach means running high populations across all management zones. Everything we gained from increasing populations in an A zone, we lost when the strip ran across a C zone.

When premier Crop talks about using data to make decisions, Learning Blocks are a vital part of that decision-making strategy. They give growers the knowledge necessary to refine further the prescriptions in their fields, with confidence and data to back them up.

Why You Should Test Products on Your Own Farm

Why should you test products on your own farm? Your farm is unique and you have the equipment capabilities and data to conduct those trials. With little risk, you can have a more robust dataset than many companies.  I’ll explain…

It starts with grid soil sampling. Soil sample data is the foundation to understanding and analyzing yield in each part of each field and ultimately, if products or rate changes will provide a return on investment. If there is something wrong with the foundation, additional inputs generally won’t show a return.  From there, we gather information such as– variable rate nutrient information, as-applied planting data, chemicals, fungicides, insecticides, weather data, and more.  Because in the real world, there isn’t one variable. It’s important to know what your measuring stick is, and we’re different, because we use actual costs and yield to understand why products perform and where they perform best.

Often times, information provided for new products or management methods are gathered from trials averaged across geographies, which may not fit your location or your farm. Certainly, there is excellent research out there–high quality university research and independent plot research that has good information. But inevitably, products come to market and growers try new technologies, but they don’t work or they don’t work everywhere.  Why not?

We believe products work in specific places and we want to help growers find those specific places in their field. We hear this from growers all the time, “sure I’ll take a gallon of fungicide or insecticide because I want to see it, I want to try it.” You want to see the product, apply it and harvest it yourself to see how it does on YOUR field.

Most growers are capable and have technology to test products on their farm, but aren’t taking the final step of doing an in-depth of analysis. Premier Crop offers multiple testing methods including a patented scientific approach of randomized, replicated trials executed through a prescription and harvested with your own equipment. The exciting part?  You may have the technology to run these trials on your own fields.

test trials on my local farm

As a grower do you try new products or test new rates?  How do you measure if that product or methodology worked? Visually? With a weigh wagon?  Do you use a yield monitor and software to do a simple analysis?  I’m here to tell you—you can do more with what you already have, and we’re excited to work with you!

Select the Right Seed for Your Field

There are many ways to trial new products on your farm.  Possibly one of the most common is what you might call a split-planter or side-by-side trial which we’ll refer to as a split treatment trial.  For example, two hybrids in the planter. Half on one side, half on the other side. A split treatment trial could also be done for seed treatments, fungicide, crop protection–anything that can run in a side by side.  This could even be separate passes with a sprayer, stripped through the field.

Typically, a grower or advisor running a trial like this might pull the yield averages for each of the treatments as an average across the field.  Maybe, you drill down the area you’re comparing and exclude the end rows of the field.

At Premier Crop, we look at things a little differently. To truly understand what might be impacting yield and ultimately profitability, you need to go deeper. It’s not enough to just know that Hybrid A beat Hybrid B. You need to know how that can change a decision next season. Where should I place Hybrid A? Where did it perform the best?

split treatment trial-1By layering all of the agronomic information about each field (soil test values, historical yield performance, nutrient application rates, planting populations, soil data, weather, crop protection, planting, harvest, and application dates, the list goes on…) we can build a case for where Hybrid A had the biggest impact and the highest profitability—leading you to the ultimate decisions—should I buy it next year?  Where should I plant it, and when?

While there is valuable information in a traditional split treatment trial because it is on your farm, there is even more valuable information to be gathered if you prove it with Premier.

Are you applying the right rates?

In 2005, Premier Crop trademarked a unique idea that has become a common practice with our customers. A trademark called Learning Blocks™. If you’ve conceded to the idea that your fields aren’t the same from fence line to fence line and you’re already managing your fields in zones, you’re ahead of the pack. But, are you checking your work? How do you confirm you are choosing the right rates for the zones in your variable rate planting or nutrient prescription?  Do you just trust that the prescription is right?

The concept of Learning Blocks was a way to test if the correct rates were chosen each zone, in a low-risk way. By placing small check blocks into an area that historically yields in a consistent manner, you can reliably check higher and lower rates against the rate you think is right.

premiercrop_learningblock_rightrates

For example, in a 30 acre area that has been your top yielding zone most years, you may choose to push corn populations to 37,000 seeds.  But, with nothing to compare against, how can you know that was right?  We’d recommend a high check at 40,000 seeds and a low check at 34,000 seeds within that same zone, only on 1-3 acres each.  Using the yield data and a few pieces of cost information, you can quickly understand the return on investment for those seeding decisions and the resulting yield impact they each had.

Now next year, you’ll have refined that planting population just a little more—and can do it again to keep checking your work.  At Premier Crop, we’re all about continually improving profitability, trusting the data to be our guide.

Learn more about Premier Crop’s trials here.

Crop Research: Evidence-based Decisions

I’m always looking for parallels – examples from other industries on how they use data to drive better decisions. While on the road, I listened to several Freakonomics podcasts. One that related well was titled Bad Medicines, Part 2: (Drug) Trials and Tribulations.

Much of the podcast discussed how human medicine is transitioning from being “eminence-based” to “evidence-based”. Eminence is where decisions are based on the advice of a distinguished expert who has a combination of practical experience and powerful communication skills (still happens in agriculture). Evidence-based decisions results from randomized and replicated trials to drive future decisions.

Some of what the medical community believed to be true has now been proven to be wrong. But even the move to doing trials has had issues.

In the late 50’s and early 60’s, a new sedative called thalidomide was introduced in much of the world as a sleep aid. What was unknown about the drug, which was given to the general population including pregnant women, was that it caused fetal deaths and serious birth defects. At the time, President John F. Kennedy praised our FDA because the drug had not yet been licensed in the U.S.

One of the results of this tragedy was a decision to exclude women (because the risk of pregnancy) from all clinical drug trials. The podcast highlighted the fact that not doing trials on 50% of the population had unintended consequences with other drugs which behaved differently because of the differences in metabolism between men and women.

One of the obvious parallels for crop production is that most agronomic trials are done on the best soils in the best parts of the best fields. Most variety trials are intentionally located on well-drained, high fertility environments – the trial design is to eliminate any variables other than genetic differences. Just as women represented a significant under-tested percentage of the population, we don’t have many trials on our less than ideal soils. Using your own data to compare varieties or treatments on your less productive soils can be more valuable than any plot book.

Another similarity between medicine and crop production trials occurs when trial protocols are tilted to situations that favor the product’s performance. In drug trials, it can be as simple as choosing younger patients with the medical condition. Younger patients, as compared to older, tend to have fewer “additional” health issues that might mask or override the drug’s effects. Crop production trials can have a similar protocol bias. Testing a nutrient enhancer in a low fertility environment or a fungicide on a hybrid with a weak disease rating can show positive results, but they might not be representative of how the product performs on your soils with your hybrids.

agriculture scientific research trials

You can use your precision ag equipment to do trials in your own fields to achieve valuable results from your most challenging soils and fields. As human medicine has moved to evidence-based decision making, one thing they discovered is that approximately 15% of the time, an established treatment has been overturned or reversed. Since medical research greatly outspends agricultural research, it will be interesting to find out how much of what we thought we know isn’t correct.

Premier Crop has developed Enhanced Learning Blocks. These scientific trials enable you to test new crop production inputs in randomized, replicated trials to identify optimal input rates for your local area with minimal risk. The scalable patent pending approach from these trials create local agronomic knowledge specific to your geography.

Fact Check Your On-Farm Trials

New agronomy products are being brought to market every year, with claims of adding bushels to your bottom line. Every farmer is curious whether or not these products actually perform. Whether it’s micros, in-furrow, seed treatment, fungicide, or biologicals, farmers want proof that a product will perform on their own acres. Most are willing to try a new product or two on a few acres to see what will happen before they invest in every acre. However, how they analyze that data is essential to getting a clear picture to that product’s success.

Every product will have a claim: “3 bushel advantage.” “7 bushel increase.” If that’s the average increase, how many bushels could you gain on your own operation? How do you measure the real numbers?

I recall a foliar trial on soybeans that was run for one of my growers several years ago. The results were astounding!  Maybe this was the “magic bullet” that the agronomic world was waiting for!

do on-farm trials work?

Then, I started to look at the rest of the story:

on-farm fertility trials

My excitement quickly simmered.  Was it really the product that was causing the increase in yield or was it something else?  Or, did soil fertility cause this amazing yield bump?

If I would not have had more information about the trial area and the area that we were checking against it, I may have recommended to the grower to go whole farm on this product and could have had to explain the following year why it did or did not perform.

On-Farm trials are essential for you, the grower, to find out where these products work best.  They wouldn’t be on the market if they didn’t work, but finding out where they work best is essential in placing them profitably on YOUR fields.  Simply looking at a yield monitor or drawing a circle around two areas and comparing yield alone does not tell you what you need to know.

on-farm trials strip trials

Analyzing the rest of the data, such as soil fertility and applied nutrients can help you to make a better decision for using these products.  Agronomy is not simple and there is not a one size fits all ‘magic bullet’ out there, but knowing what works and where will help you make more profitable decisions.

It pays to know what else is going on by looking deeper at all your data layers, not just the yield file. Like Paul Harvey said, and we agree, you need to know “the rest of the story.”

Improving Farm Efficiency with Nutrient Planning

Our approach to nutrient planning is based on the fact that we want to allow our advisors, partners, and growers to get ahead when it comes to planning for the next crop season. Some advisors are having this conversation early, even before growers start combining in the fall. As we dial our focus on helping growers create a plan before the growing season begins, we look at several things. Using a spatial soil sample as one of the foundation pieces is a large part of what we do. A spatial soil sample could be a grid sample where the field is divided into smaller sizes, giving you a number of samples within a field, two-and-a-half-acre grids are common in most areas. In other areas where the field is divided into zones, zone sampling can be driven by soils, historic imagery, or EC conductivity. Instead of capturing one sample for an entire field, they’re capturing more intense, site-specific samples. Layering all these samples into one computerized system and letting data science derive the factors for you helps, rather than trying to figure it out on your own in those frustrating excel sheets.

Soil Layers-01

We understand that with all nutrients, a combination of soil-supplied nutrients and the soil foundation feeds the crop. This means there are nutrients in the soil that are released to balance what the soil supplies to the crop versus what a farmer applies with manure or commercial fertilizer. But we don’t stop with only the soil sample and management zones. Another piece of what we do is use yield files to capture the actual nutrient removal rates. A farmer is capturing yield data every second they go across the field and we are able to calculate the phosphorus and potassium removal off the yield file. Not many other companies do this, because it can be difficult to export the yield file from the growers system. We believe this is the differentiating factor that leads to better yield efficiency and maximizing profits.

We then divide fields by productivity level because we believe we’re able to define some areas of the field that respond to more nutrients. We generally have a different equation for each productivity area within a field. Other companies will go to the grower with three different equations priced out with nutrients and have the grower choose just one. We believe this shouldn’t be a “one size fits all” approach, though. A grower shouldn’t have to choose aggressive versus conservative for the whole field. Having more complex equations is a big part of what we do, and this is why we believe you can treat parts of the field aggressively and parts of the field more conservatively. It makes sense to us that some areas of the field just respond more to nutrients than other areas of the field, and we want to take advantage of that. Again, this is another example of how we use our data science to calculate all the layers of data to create a customized prescription for your field. We are also able to test right rate technology using our Enhanced Learning Blocks®, using statical confidence to prove the best rates in the field.

data science farm trials

When you think about the rate of nutrients that should be applied, how do you make your final decision? You know that agronomy is local, meaning it is important when giving site-specific recommendations, to pay attention to every field, specifically each different productivity area within each field. This makes it important to create unique prescriptions by putting trials in growers’ fields. It really doesn’t get more local than using your own fields. These trials are scientific trials within each part of each grower’s fields, using analytics and data science to inform our recommendations. Each trial has replications of different rates in different areas of a grower’s field to statically understand where in a field the best rates win.

The goal is to produce yields efficiently and profit as much as possible. When we go into areas where a grower hasn’t been soil sampling or doing variable rate nutrient applications, we typically find that the lowest fertility areas are the highest yielding. These low fertility areas come to be because the high-yield areas have mined down the nutrients from the field being treated uniformly. Growers will tell us, “I put the same blend on every acre, and I’ve done it for the last 10 years.” However, the problem is that they haven’t been removing nutrients as uniformly as they’ve been applying them. Those consistently high-yield areas have pulled down nutrients, and the consistently low-yield areas have allowed nutrients to build up in the soil. We capture that when soil sampling, which can be a foundational piece. We also find the areas that are consistently higher yielding are hard to keep up with. The more that certain nutrients are applied, the better the yield. We never try to even out the field and make it one color on a soil test map. The question we ask ourselves is, “How do we generate more dollar return for every dollar we invest within those areas of the field?” If we never catch up soil test-wise, it means we keep producing better and better yields as efficiently as possible.  It’s not uncommon for us to see 80 to 100 dollar-an-acre swings by single nutrients.

Screen Shot 2021-01-28 at 2.11.44 PMNutrient Planning-01-3

When growers realize there are that many dollars in play, it leads them to want to do better. We’re constantly surprised at how much yield response we’re seeing by being ultra-aggressive and applying a high rate. We’re just beginning to understand and to tap into what’s possible.

If you’re interested in taking a step towards highly analytical planning for the crop year, contact us today. For more information about nutrient planning, check out our precision ag conversations on the Premier Podcast.

Three Steps to Combine Farm Agronomics and Economics

We often use the phrase, “Everything agronomic is economic.” What does that really mean?

First, let’s first define agronomics and economics. What is agronomics? That’s everything that we do in the field related to making good management decisions. It’s deciding how much fertilizer to apply and where to put it, planting rates, crop protection, tillage systems and how to incorporate all of this into the farm. Those all go into how we grow our crop. On the economics side, we’re talking about all of the money involved in farming. Farming is a business, and just like any other business, you need to make sure you have cash flow so you have the opportunity to farm again next year, and the year after that. So, how do we focus on agronomics and economics? We do that by analyzing growers’ data. We use that knowledge to help them make decisions on their farm.

Knowing what you’ve done on the farm in the last five, 10, or 20 years can provide valuable knowledge as you plan into the future. However, if you never take that data and don’t use it to make decisions, it’s not doing you any good. It’s important to invest time into collecting your farm data. We work with growers to analyze their collected field data. We add costs to the layers of data including product cost, operations cost, management cost if they have any land-specific cost, and tie that to the yield file so we can see what is making agronomic and economic sense on the farm.

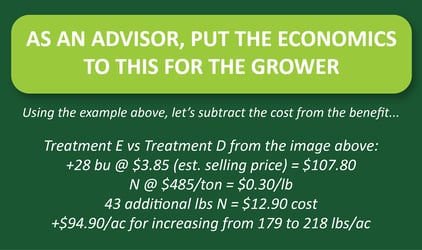
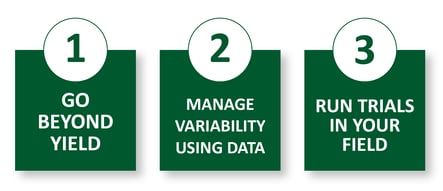
It’s fairly easy to tell where there are higher yields, but it’s a lot harder to know if that yield increase also caused an increase in the pocket book. Did the decision pay for itself? Did you produce enough bushels to offset the cost of production? Every pass across the field matters agronomically, but it also has a cost associated with it. We give you three steps to help combine your farm agronomics and economics below.

1. PLANTING

When you’re preparing to plant, your seed has the highest yield potential it’s ever going to have. Everything we do at Premier Crop is aligned with protecting yield potential, and planting population is a big aspect of this. If you overcrowd the plants, you’re going to make them compete for resources, which will end up reducing your yields. On the flip side, if you have too low of a population, then you’re reducing your yield potential by not having enough in the first place. You can’t produce more bushels of corn if you never plant the seed to begin with.

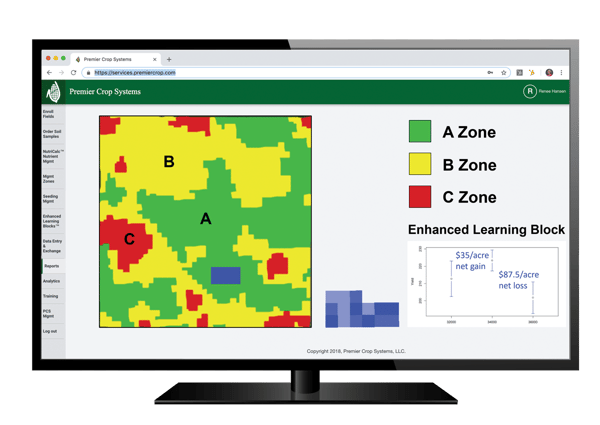
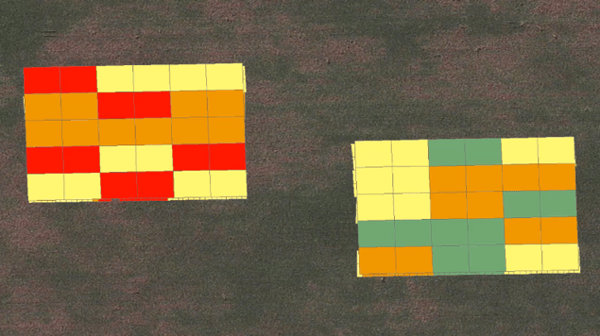
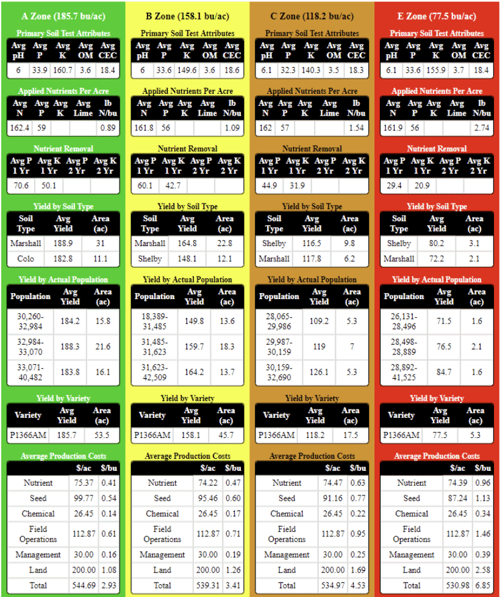
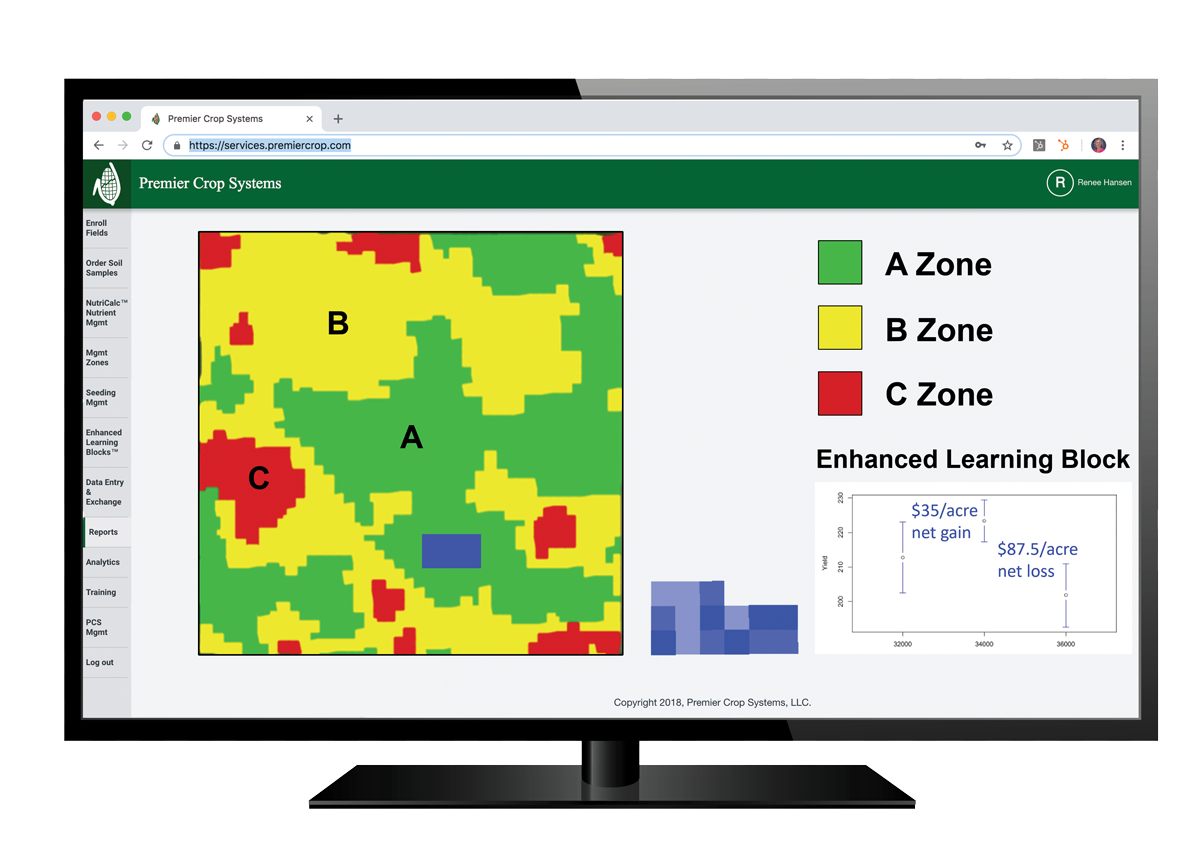
Combining agronomics and economics is about finding the right rate for the right part of the field, which we accomplish with management zones. A management zone is not just a seeding rate like it is with many other precision ag companies. We manage the field and the operation off of the zones. We break fields into high-producing areas, which are A zones, average-producing areas, which are B zones, and lower-producing areas, which are C zones. The B zones are the types of areas that do pretty well year in and year out, but they don’t have the capability to be the highest producing areas of the field. Our C zones could look like a wet spot, an area shaded by trees, or a family of deer could live nearby and eat it all the time. We manage nearly everything based on these zones.

premiercroppbreakevencostperbushel

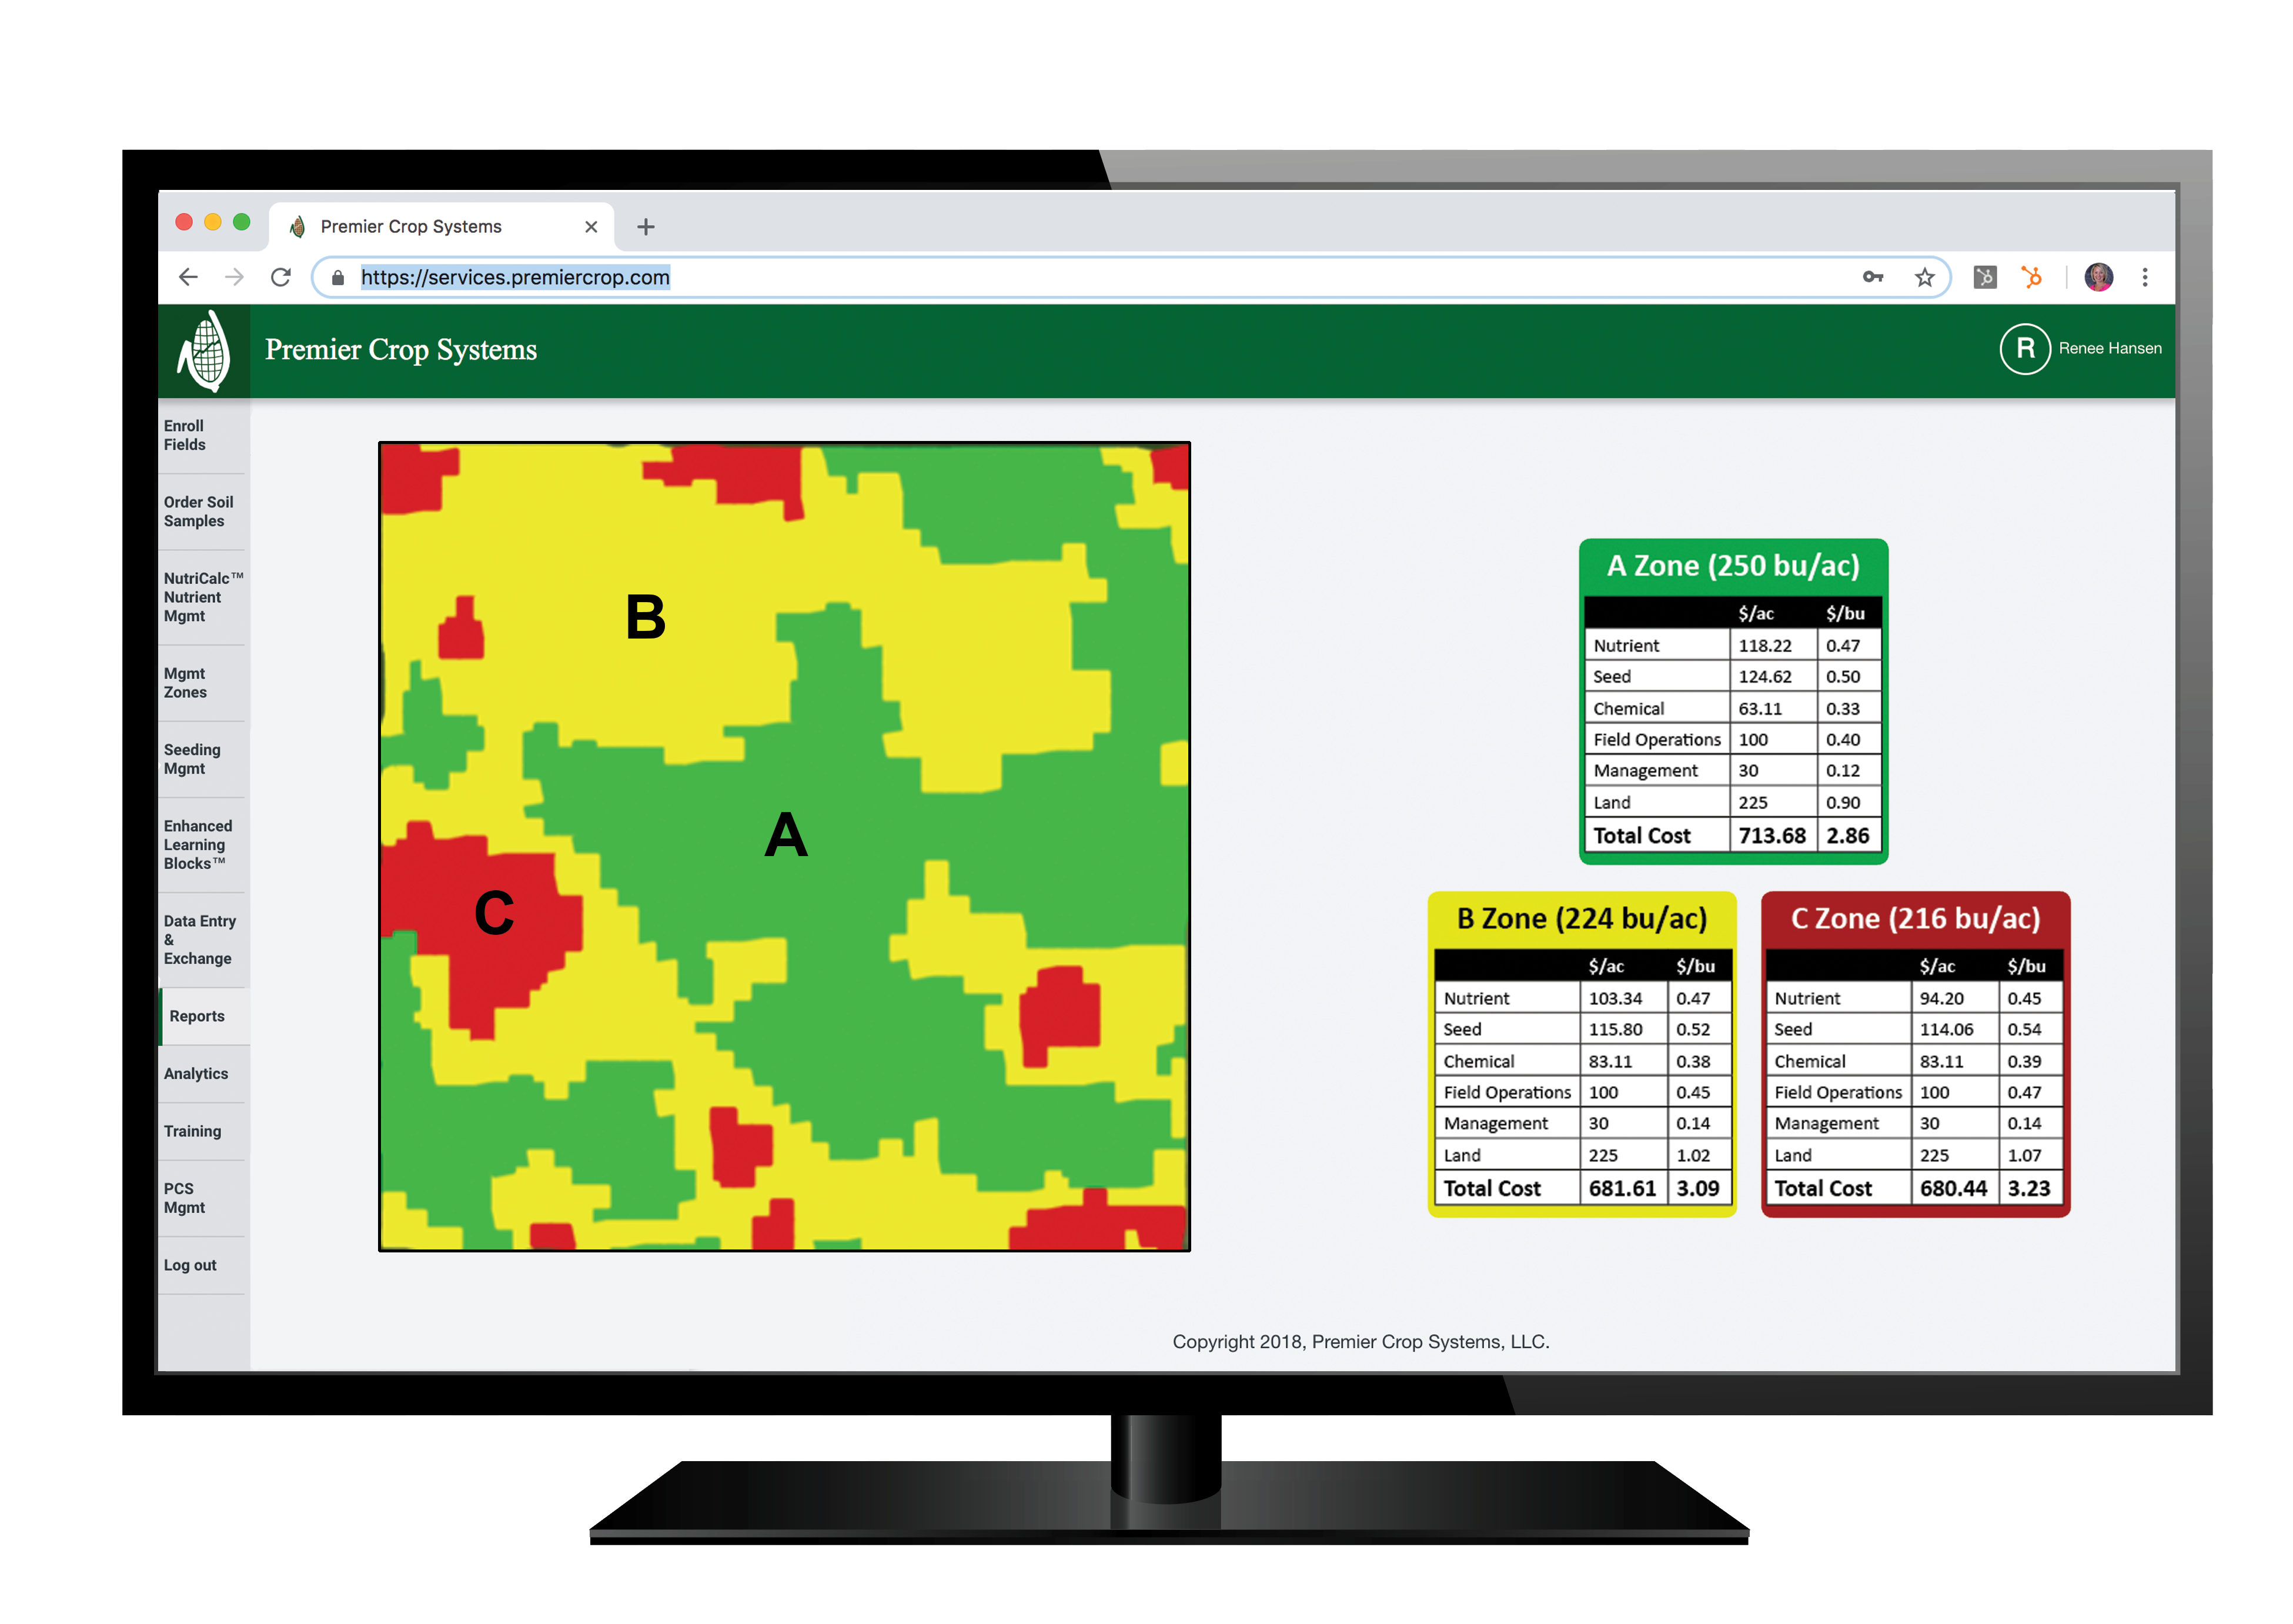
In the A zones, our high-producing areas, we push planting populations. We plant more seeds in these areas because these parts of the fields have the capability to produce more bushels. In the C zones, we’re going to pull back our population because we know those spots just simply don’t have the yield potential. By labeling it as a C zone and understanding that it is not going to produce as well, we can manage risk by lowering the planting population. This practice will save money on seed costs in this part of the field because by lowering the population, we have reduced seed cost, which helps the bottom line. However, if we can get part of the field from a C zone to a B zone, or from a B zone to an A zone with fertilizer or any management practice, we will go after that to increase our return to land and management, what we call yield efficiency.

2. FERTILIZER

When variable-rate technologies first came out, the discussion was: “It’s going to save you money and reduce your fertilizer usage.” We found that’s not always the case, though. Instead, grower’s are making better decisions with their planting or fertilizer dollars. They are putting those dollars in the areas of the field where it’s needed and where they can get a return on their investment. We are driving farming towards thinking more on the economic side of the business.

In general with farming, if you’re doing a straight rate across the field, you’re essentially treating every acre the same. We know that every acre is not the same because when you’re harvesting, even if you don’t use a yield monitor, you can see variation in the amount of loads you’re taking off. You can tell how good or bad the corn is as you’re driving across the field. So, why would you treat your inputs the same if you’re not taking the same amount off of it at the end of the day? That’s why it’s so important to tie the economics to planting, and fertilizer. That is where the real benefit lies.

Even if you are locked in on your planting populations, placing different checks in a field through different years allows you to gather historical data and be able to check and say: “In this year, if we’re looking at a cold, wet spring, this is the best population to go with.” Even if we don’t use that specific data in the next year, we are still collecting it for future years.

It is also important to factor in your planting population when you’re determining your nitrogen rates. We often use the example: If you invite more plants to dinner, you have to have enough food to feed them. We could apply a straight rate, but we’re going to be overfeeding the poor-production areas and underfeeding the high-production areas. So, if you have a higher population in the A zones, you need to account for the added food they’re going to need. We can also push the nitrogen rates a little higher in the A zones because we have the capability to produce more bushels, not just because of the higher population but just because the ground is better. By pushing that, you’re taking a little bit more risk, but it’s a smart risk.

3. ANALYTICS

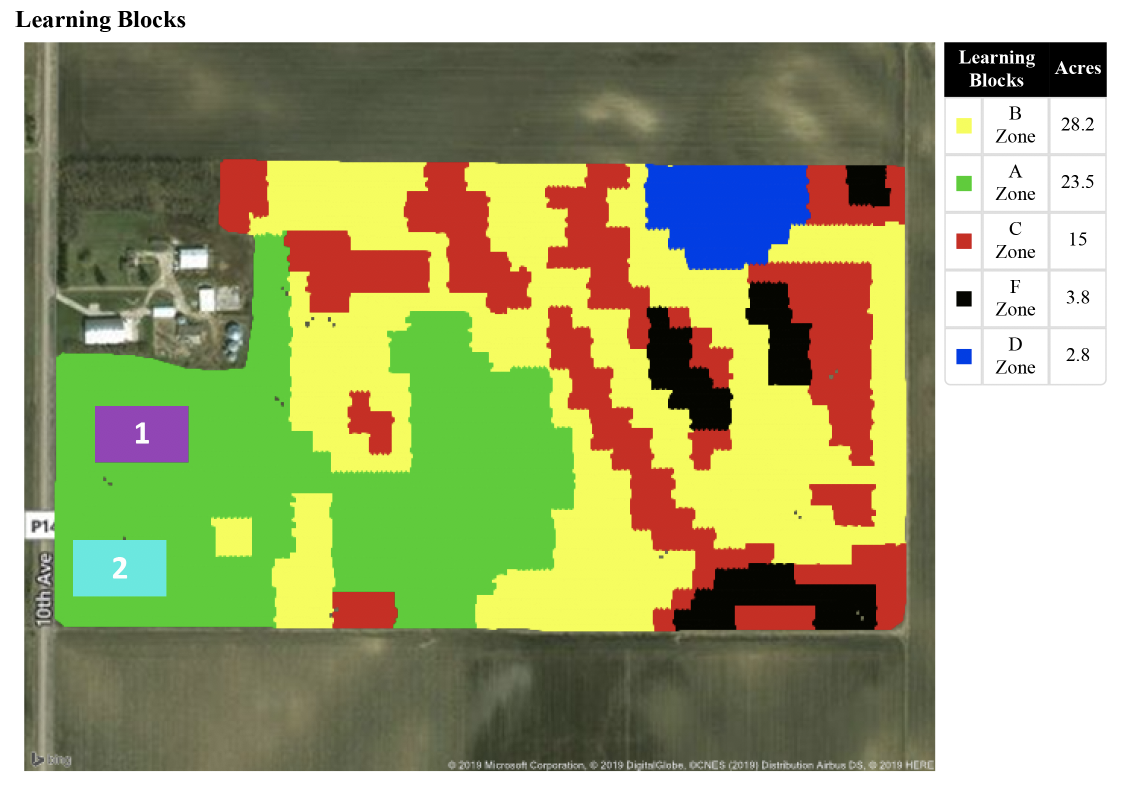
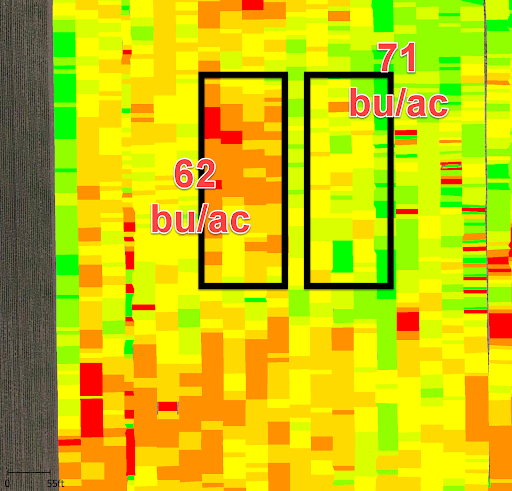
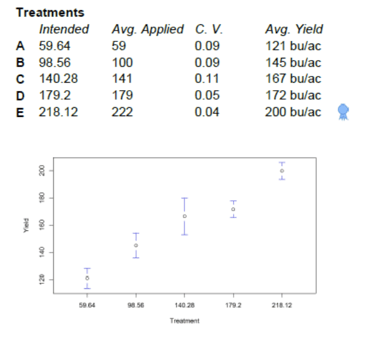
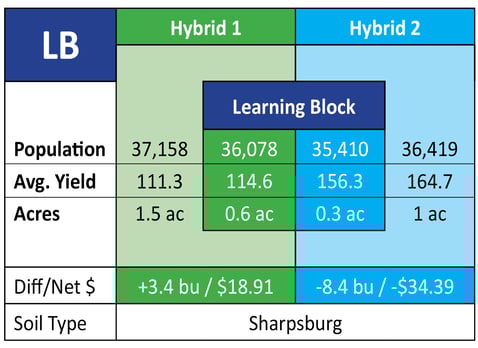
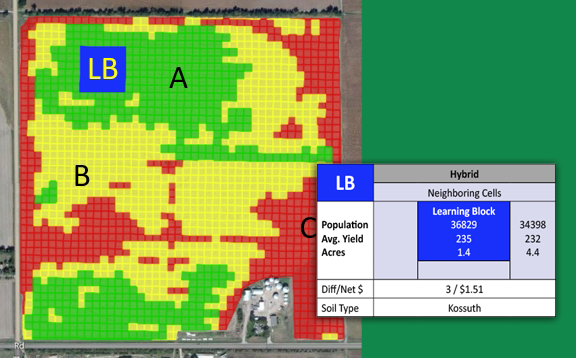
To get started looking at a grower’s analytics, we first pull yield monitor data. Then we look at everything the grower has done throughout the year, whether it’s fertilizer, lime, planting, nutrients, or crop protection products. We dig in and see what the economic benefit was. When planting, did we build small test plots into the planting maps for our growers called Learning Blocks. We then use the information from our all of our data within a management zone to see if we have the right rate. Learning Blocks not only show us what produces the highest yield, but it also shows which population provides the greatest return on investment. Once the prescription is in a grower’s monitor, they can just focus on farming. It’s very little thinking on a grower’s part because we’re constantly constantly checking our work.  It is important that we prove what we’re doing is the best option possible.

premiercropgrowerseedingtrials

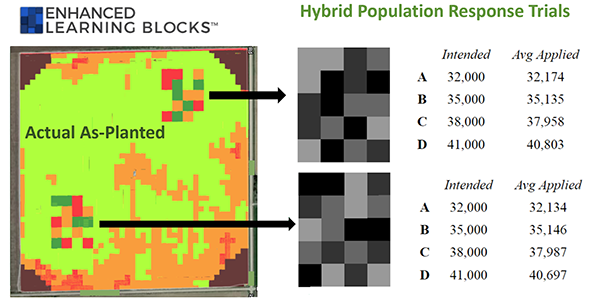
The analytics is where the magic happens. Not many companies look at what happened after harvest. Premier Crop uses our platform to make informed decisions based on what the growers data is proving through on-farm trials, Learning Blocks and Enhanced Learning Blocks to provide statical confidence to help the grower see their profit.


Not every operation has the same goals and not everyone sets out to produce the max amount of bushels. It’s a “do it and check” process. We go out and do something, we check our work, and then we make corrections for the next year. As a grower, you’re always busy. You are going from one thing to the next, and there’s always something to do. Going through the data can be a tedious task that leaves you feeling like your time would’ve been better spent elsewhere. The benefit of working with a Premier Crop Advisor is that we retrieve the data, clean it up, and enter it into the system. A grower just needs to hit “record” when they’re running through the field.

Want to learn how you can work with an Agronomic Advisor to start making agronomic decisions based on your economics? Contact us to schedule a demo today.

Learn more about the farm profitability.
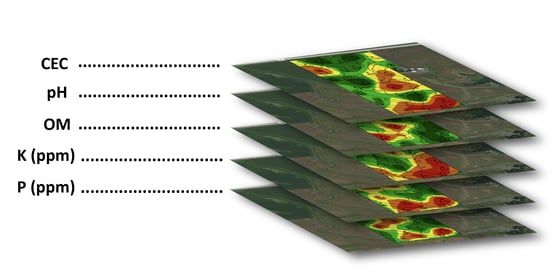
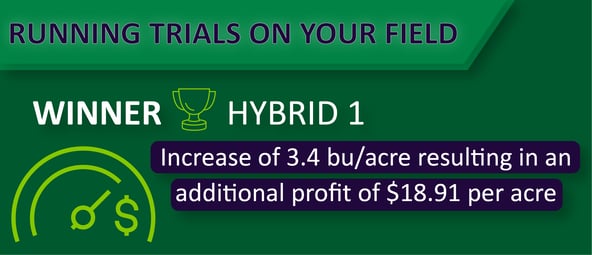
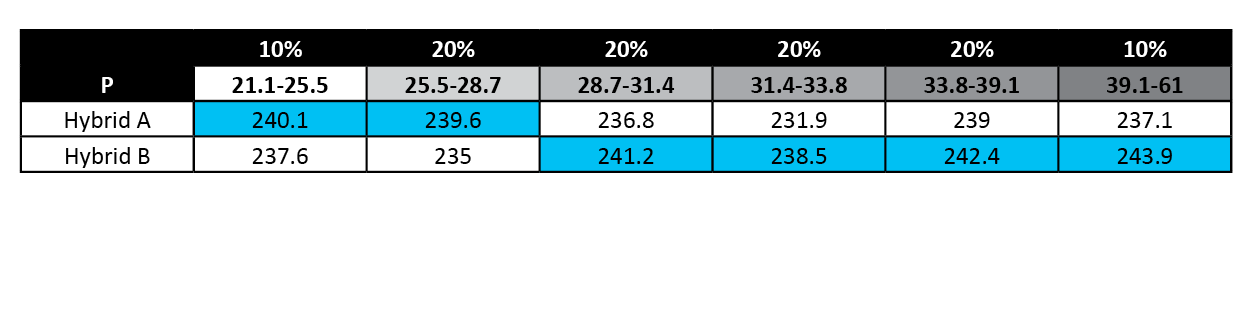
Big Data With Local Context

Big data is a phrase that has integrated this world of technology across industries. It’s about capturing relevant data from a huge number of sources, and translating it into something that people can use. Big data provides actionable insights to solve problems at scale and at speed. In this world of ag, we have billions of dollars of venture capital funding pouring into agriculture through technology builds. Big data has been at the center of that.

There are several ways big data can be advantageous to agriculture. It depends on your goals. What do you want to accomplish with the data? Obviously, big data is enabled by computing power. We have much more capacity because of server farms and cloud computing. These let us collect more and crunch through more data.

In ag, the topic of big data is relatively recent. Before yield monitors, we made many decisions in ag based on what I would call small data, which was a lot of replicated trials. A replication in a trial might be 25-feet-long, replicated three times, and becomes an observation. So now with yield monitors and all the other devices, we’re able to collect data at a high resolution. In a hundred-acre field, we would divide that field into 4,000 unique observations that are geo-referenced, tied with a lat, long, yield value and hundreds of layers of data underneath.

There’s a ton of data being collected today in ag from many different sources. Much of it is public. It seems like there are newer companies trying to take advantage of public data and the complexity of sourcing it and putting it together into some usable format. Public data is not drilled down to a level where I think it’s all that helpful. If you’re a company selling an analytics package to a grain trading company, you don’t need it refined. With that type of data, you’re trying to understand global yield trends and how it will move the supply chain. So a lot of the public sources aren’t as valuable to a grower as they are to other stakeholders.

MYTHS OF BIG DATA

Let’s talk about some of the myths out there on big data. We often hear the words “weather modeling,” but what we’re talking about is predicting the future. It might be future weather or future performance.

All models are based on assumptions. It’s about understanding specific geographies within fields, and how they’re similar to geographies in other fields. It’s almost like the more data you get, the more it lets you break it apart into more meaningful insights. The power of what we have in ag is that you have different growing environments every year. As a company, we get to observe different growing environments within the same year. So, Nebraska or Minnesota can have a dramatically different growing environment than Indiana and Ohio. For example, you could see how a hybrid or variety performs in the same year in dramatically different growing environments because you’re seeing it across these big geographies. It’s highly dependent on believing in the idea that agronomy is local, that agronomy and geography have a really close relationship with each other. It relates to the idea of big data, and aggregating it across multiple different agronomic environments. So how do we give it enough credibility that people can make decisions?

Over the years, the ability to aggregate data geographically has been a big deal. The ultimate power of all this is at a subfield level because that’s where you drive change. Every farmer who works with us wants to see beyond their own operation. They want to see agronomic practices, trends and rates.

When a farmer starts working with us, they usually want to see the biggest data set possible, meaning they want to see data from a large geography. However, we believe that local data is king in agriculture. The bigger, richer data set from a local perspective is more powerful because there are more things that are relevant and stay the same. We almost went through a decade where it seemed like the whole seed industry on corn was going to fixed-year numbers. The only way you could drive yield was to drive population. No matter what size of database, we saw a trend. We were marching up 400 or 500 seeds per acre for a decade because that’s what it took in order to drive yields.

Now, we’ve gone through almost a decade where it seems like there’s more flex in numbers. We’re producing much higher yields at lower populations. However, when we were going through that match up in population, growers started looking at row width. We had this phenomenon where everybody was chasing 20-inch corn or even narrower corn. The plants were on top of each other, and needed to be more spaced out. In the data, 20-inch corn was a South Dakota and southern Minnesota phenomenon. That’s where we were seeing the most 20-inch corn. We had people outside of that area that wanted to drill down. They wanted to see data outside of their area because they were trying to make a decision about switching to a narrower row of corn. This was a way to space out the plants as they continue to drive the population.

Since we’re capturing data off the planter, as it goes across the field, we’ve been able to calculate planting speed. One of the very early signs was we had a report that showed the faster they planted the corn, the better and higher the yield. That’s an example where faster planting speed was correlated to higher yields, but when you actually interviewed the grower and talked to the grower about what happened in that field, parts of the field worked up rough. And so, they slowed down because they were trying to maintain seed-soil contact. As they went into those areas that worked up rough, they slowed the tractor down and slowed the planter down. In the part of the field that worked up great, they planted at normal speed or higher speed and, sure enough, that was where the higher yields were. The rougher areas worked up rough, so the real correlation was to field conditions of planting, but it showed up as planting speeds. So, it was an example where you can have correlation, but it doesn’t necessarily mean causation.

One of the many myths people believe about big data is that if you haven’t got involved already, you’re probably too late.

Many growers are sitting on data and no one has helped them put it to use. There are growers who quit caring about yield data because they haven’t been able to use it. One of our successes is that we grab that historic yield data and try to use it to capture the variability within fields. You can go from zero to big data really quick in farming. You can start at any time and begin creating value right away.

3 Ways to Start Utilizing Your Data

Technology is great… when it works like it’s supposed to. Whether it’s your cell phone, computer or agriculture equipment, we’ve all had our fair share of battles with technology. Like it or not, technology isn’t going away. In fact, it’s going to continue to grow and become even more prevalent in our lives, even in agriculture. We see this every year in agriculture as we continue to add technology to our planters and combines. Monitors continue to become more complex, and tractors are driving themselves. So, where do we go from here?

Here are three ways you can get on board with technology and start utilizing your data to make decisions.

3 ways to utilize farm data

GO BEYOND YIELD

When determining the success of a growing season in farming, yield is one of the first things we refer to. Higher yields equal more bushels, and more bushels equal more money. But what does it take to achieve those higher yields?

For instance, in order to gain a 5% yield increase, you’ll have to increase your input costs by 10%. Is that worth it? Tying input costs to yield is a great way to utilize your on-farm data. Breaking down your total cost per bushel (break-even selling price) is a great place to start when determining profitability in your fields. Take it one step further and break down your break-even price spatially by Management Zone, which allows you to really zone in on different areas of each field to reach your greatest return on investment.

As you can see in the graphic above, at Premier Crop we pride ourselves on diving deeper than the competition and gathering all the information to give you a very detailed report so you can visually see, in each management zone, in each part of your field, how you profit. This helps you make better management decisions using your data.

MANAGE VARIABILITY USING DATA 

Every field has variability. Don’t believe me? Look at your yield maps from the last 5 years. More than likely, those maps are not one consistent color, and discarding years of weather damage, the maps are fairly consistent through each year. Using historical yield data to identify areas of your field that are consistently underperforming or over performing is a great way to make use of your data. Some areas of your fields are going to produce differently than others.

At Premier Crop, we start with your historical yield data, putting it together to achieve a relative yield map of all years of yield data for that specific field. This allows us to find areas of the field that are constantly performing above or below the field average. The next step is to determine the limiting factor (or factors) in that area. For underperforming areas, is it something that can be fixed with nutrients, tile, etc.? Or maybe it’s a sandy area that no matter how much nutrients we pump into it, it will always underachieve. For a higher yielding area of the field, the question becomes ‘how hard can we push that area to continue to increase yield while still maximizing our return on investment?’ Once we establish your zones, Learning Blocks are a great way to prove what the best rates are for each zone. This determines more confidence in your management decisions year after year.

RUN TRIALS IN YOUR FIELD

We have been running on-farm trials for many years at Premier Crop. We use Learning Blocks to test input rates and seeding populations using a prescription and technology. It’s important to note that there is so much variability across every field, therefore different rates work better in specific parts of your field. One way to prove the best profitable rate or population is to trial by blocks instead of strips. By using a Learning Block, we can strategically place a trial in one zone and compare the results of that block to the immediate surrounding area of the same zone, giving us an accurate result.

Learning Block Example

In the example above we tested two different hybrids to see if lowering the population would be beneficial not only by yield, but economics too. You can see that Hybrid 1, tested a lower population by 1,080 seeds/ac and created a +3.4bu/ac with a profit of $18.91/ac. And lowering Hybrid 2 by 1,009 seeds/ac created a profit loss of -8.4/bu and -$34.39/ac. Therefore, the grower can make an informed decision on this specific management zone in his field that Hybrid 1, at a lower seeding population of 36,078 will help him profit in this zone.

Learning Block Winner-02

At Premier Crop, in addition to the yield results, we tie the economics to the trial to determine the profitability of making that change. This leads to more confident decisions and more profitability on every acre.

________________________________________________________________________________

Technology can be complicated and frustrating, especially during the busy seasons. The last thing you want to do during planting is stumble through the monitor trying to load a planting prescription. This is where Premier Crop can help. We focus on the data so that you can focus on farming. We handle all of the button clicks and data organization, so when the time comes, you are able to farm without having to worry about setting up your monitor or capturing good data. At the end of the year, we compile all of the data we have collected on your farm, create reports, and meet with you. Together, we take a look at areas that did really well, as well as areas we could change for the next growing season in order to continuously maximize your profit.

As technology continues to evolve, there will be more and more opportunities to utilize our on-farm data. At Premier Crop we continue to monitor the technology changes in agriculture year after year, and help you adopt and adapt to these changes in your operation. Contact us now to get in touch with an advisor in your area.

farm efficiency