Farm Analytics Show Valuable Insights

I was meeting with a grower who asked the question, ‘Is the direction of Premier Crop going from a prescription company to an analytics company?’ My answer was: ‘Premier Crop has always been about analytics. We are not only a company known for analytics, but what to do with the information that is received within the data, in those analytics.

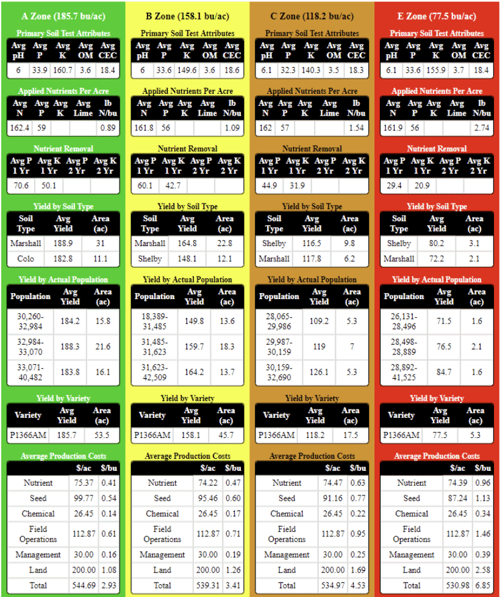
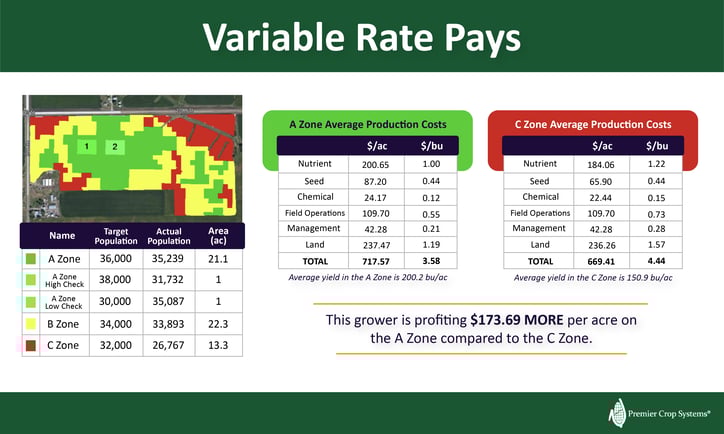
I could kill you with paperwork. But really, it’s about the reports and insights that I can take to be able to help growers make better decisions. The report I’m walking through today is our Management Zone Report. This report is almost like a report card for a grower because it showcases the cost per acre in each of the management zones. In this report, you’ll see that we’ve invested more dollars per acre for nutrients and seed. The chemical costs, operations costs, management and land are going to be flat rates, or they’re equal across each of these zones. When we get down to the very bottom of this report, we can see that we’ve invested $48 more in our A zone, our best parts of the field, than in our C zone. When we look at that break-even cost per bushel, or the amount it costs us to produce a bushel of corn, it’s $0.86 cents less in our A zone compared to our C zone, even though we spent more money to produce it. It’s amazing to actually be able to use this report to illustrate to a grower that variable rate does pay.

Let’s do the math on this report. If we’re yielding 200.2 bu/ac bushels in the A zone, and I’m using a selling price of $4.50 for corn, that would bring us to $900.90 of revenue per acre. If we take out our cost per acre of $717.57, that’s going to be $183.33 profit in that A zone versus our C zone yielding 150.9 bu/acre and revenue of $679.05, which is $9.64 revenue per acre. That’s $173.69 more per acre in your A zone.

Katie Farm Analytics Blog-01-2

Now, we an produce reports and pretty graphs, but it’s so much more than that. I’ve always laughed and thought: What other business takes a look at a pretty map or graph and says, “That’s really neat!” and puts it in a 3-ring notebook in their office without doing anything about it? This is where the agronomic advisor should come in, take that data and ask, “What can I do with this?”

Another part of this Management Zone report shows the soil test attributes, applied, and removed nutrients in each of these zones. As an advisor, I can very quickly look and see what the average applied nutrients were in these zones and the actual nutrients that were removed within these zones. With so many inputs (P, K, Seed, etc.) being variable rated, it helps me to get the complete picture and help growers make sense of what happened in their fields and how we can improve next year.

As we’re going into the fall with these fertilizer inputs — and, actually, all inputs — being what they are, growers are going to be concerned. I’ve been telling people for the last month, my worry is that when farmers get shown these prices, they could make some emotional decisions. In fact, those emotional decisions. In fact, those emotional decisions of cutting across every acre could be cutting profitability in the areas where they could be returning the most.

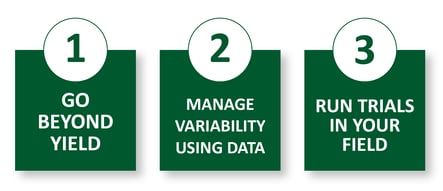
So the question is: how can we take this information to make a better recommendation or a better prescription for next year’s crop.

First, we have to figure out what we actually have control over. There’s so much in the data world and there are certain things we don’t have control over. So, let’s look at the things that we can help growers with. I’m not saying to starve out any area, but instead, reallocate. What does the grower’s pocket book look like for a given field? I chuckle when growers tell me that their yield goals are the same across every field. If you treat every field the same, you can’t tell me that yield goals or, on the flip side, removals, are the same on every field. We’re talking about removals spatially, with that yield file. That’s a huge variance.

When you’re in the combine, and you’re watching the monitor, you see those high areas of the field. Well, those high areas of the field are removing a lot more nutrients than when that monitor hits those red areas on the map. That means if there’s a big difference in yield, there’s a big difference in removals.

iStock-1180642027

Using that removal file as part of a grower’s nutrient plan or recommendation is going to be really big this coming year, in addition to establishing the goal for that field moving forward for this following year. What kind of a goal are we going to have based on input prices? I sent an email to one of my growers last week, and said: ‘We really need to talk in the next 10 days. If prices are going to remain as they are, what are you thinking for fall fertilizer?’ We’re going to need to put some on, what does it look like if prices stay this way? Then, how do we pivot as we move into harvest season and that sort of thing in order to prevent those emotional decisions? Growers with a plan don’t make emotional decisions. They’re a lot more confident and a lot calmer in fall and harvest time.

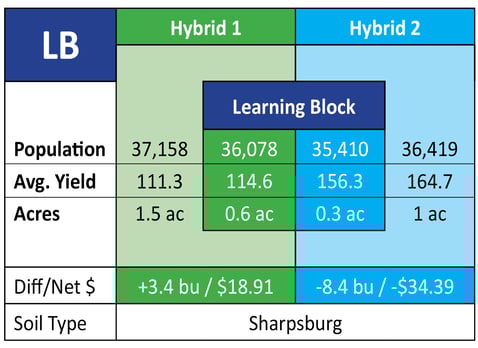
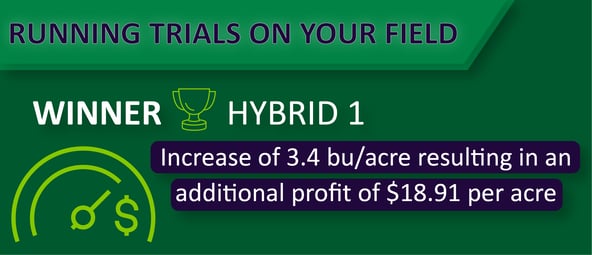
I share all of this to prove to you that variable rate clearly pays. So, what if you were to flat-rate this whole field? What would this look like? I mean, you would clearly be losing your money in the C zone, more than if you’re over-applying your nutrients. There’s a clear reason that these reports show that the profitability of variable-rate pays. Using something like Premier Crop and looking at the farm analytics is highly beneficial. If you are only using yield as your measure of success, you really don’t know how much money there is out there that you’re missing out on.

crop management

3 Ways to Start Utilizing Your Data

Technology is great… when it works like it’s supposed to. Whether it’s your cell phone, computer or agriculture equipment, we’ve all had our fair share of battles with technology. Like it or not, technology isn’t going away. In fact, it’s going to continue to grow and become even more prevalent in our lives, even in agriculture. We see this every year in agriculture as we continue to add technology to our planters and combines. Monitors continue to become more complex, and tractors are driving themselves. So, where do we go from here?

Here are three ways you can get on board with technology and start utilizing your data to make decisions.

3 ways to utilize farm data

GO BEYOND YIELD

When determining the success of a growing season in farming, yield is one of the first things we refer to. Higher yields equal more bushels, and more bushels equal more money. But what does it take to achieve those higher yields?

For instance, in order to gain a 5% yield increase, you’ll have to increase your input costs by 10%. Is that worth it? Tying input costs to yield is a great way to utilize your on-farm data. Breaking down your total cost per bushel (break-even selling price) is a great place to start when determining profitability in your fields. Take it one step further and break down your break-even price spatially by Management Zone, which allows you to really zone in on different areas of each field to reach your greatest return on investment.

As you can see in the graphic above, at Premier Crop we pride ourselves on diving deeper than the competition and gathering all the information to give you a very detailed report so you can visually see, in each management zone, in each part of your field, how you profit. This helps you make better management decisions using your data.

MANAGE VARIABILITY USING DATA 

Every field has variability. Don’t believe me? Look at your yield maps from the last 5 years. More than likely, those maps are not one consistent color, and discarding years of weather damage, the maps are fairly consistent through each year. Using historical yield data to identify areas of your field that are consistently underperforming or over performing is a great way to make use of your data. Some areas of your fields are going to produce differently than others.

At Premier Crop, we start with your historical yield data, putting it together to achieve a relative yield map of all years of yield data for that specific field. This allows us to find areas of the field that are constantly performing above or below the field average. The next step is to determine the limiting factor (or factors) in that area. For underperforming areas, is it something that can be fixed with nutrients, tile, etc.? Or maybe it’s a sandy area that no matter how much nutrients we pump into it, it will always underachieve. For a higher yielding area of the field, the question becomes ‘how hard can we push that area to continue to increase yield while still maximizing our return on investment?’ Once we establish your zones, Learning Blocks are a great way to prove what the best rates are for each zone. This determines more confidence in your management decisions year after year.

RUN TRIALS IN YOUR FIELD

We have been running on-farm trials for many years at Premier Crop. We use Learning Blocks to test input rates and seeding populations using a prescription and technology. It’s important to note that there is so much variability across every field, therefore different rates work better in specific parts of your field. One way to prove the best profitable rate or population is to trial by blocks instead of strips. By using a Learning Block, we can strategically place a trial in one zone and compare the results of that block to the immediate surrounding area of the same zone, giving us an accurate result.

Learning Block Example

In the example above we tested two different hybrids to see if lowering the population would be beneficial not only by yield, but economics too. You can see that Hybrid 1, tested a lower population by 1,080 seeds/ac and created a +3.4bu/ac with a profit of $18.91/ac. And lowering Hybrid 2 by 1,009 seeds/ac created a profit loss of -8.4/bu and -$34.39/ac. Therefore, the grower can make an informed decision on this specific management zone in his field that Hybrid 1, at a lower seeding population of 36,078 will help him profit in this zone.

Learning Block Winner-02

At Premier Crop, in addition to the yield results, we tie the economics to the trial to determine the profitability of making that change. This leads to more confident decisions and more profitability on every acre.

________________________________________________________________________________

Technology can be complicated and frustrating, especially during the busy seasons. The last thing you want to do during planting is stumble through the monitor trying to load a planting prescription. This is where Premier Crop can help. We focus on the data so that you can focus on farming. We handle all of the button clicks and data organization, so when the time comes, you are able to farm without having to worry about setting up your monitor or capturing good data. At the end of the year, we compile all of the data we have collected on your farm, create reports, and meet with you. Together, we take a look at areas that did really well, as well as areas we could change for the next growing season in order to continuously maximize your profit.

As technology continues to evolve, there will be more and more opportunities to utilize our on-farm data. At Premier Crop we continue to monitor the technology changes in agriculture year after year, and help you adopt and adapt to these changes in your operation. Contact us now to get in touch with an advisor in your area.

farm efficiency