How Yield Efficiency Can Impact Your Operation

“It’s just putting data to work for you. You can drill down on which fields, and which parts of fields are most profitable, and which aren’t. I think the more you help growers know their costs, the better managers they are.” – Dan Frieberg

DAN FRIEBERG: When we talk about yield efficiency, to me, it comes down to us being willing to track the economics of the decisions that we’re influencing with the grower and tie it out economically for the grower. In a lot of people’s minds, yield has theoretically represented higher profits, but we also know that’s not necessarily the case. Sometimes higher yields come at so much higher costs that they aren’t more profitable. In general, that hasn’t been that wrong. If we can produce higher yields many times, it is more profitable because you’re spreading more units of production over the same fixed cost, and one of the big fixed costs is land cost. Whether you produce 100 bushel of something or 200 bushel of something, unless you have a flex lease, a lot of times your land cost doesn’t change. There are rental agreements where the land owner is sharing both in the upside and the downside associated with higher yields and all that. So, yield efficiency, for us, is the dollar-per-acre return to land and management, and the reason we define it that way is because we don’t influence what somebody pays for land. We don’t influence their land cost.

Don’t get me wrong. They can use data. They can use the analytics we provide to make land rent decisions, to make land purchase decisions. So, they always have. They use analytics to help them decide what to rent and what to buy and all that. On a yearly basis, we’re not impacting land cost, and management cost is another one where we probably don’t have as big an influence. So, there’s a lot rolled into management. For a lot of operations, it includes family living and health insurance and a whole bunch of other things that are really a key part of the operation but not something that we advise on. But we do advise on nutrients. We spend a lot of time helping growers manage their nutrient investment. We help them a lot with the seed investment, both what they choose to buy and where they plant it and at what rates. And we also help on crop protection decisions. Then, the fourth one is operations. We don’t advise on operations. We don’t get into what equipment they should buy. There are a lot of data analytics tied to operations. We can analyze no-till versus conventional till, and we can break down and analyze differences in cost associated with different tillage types. Yield efficiency, for us, is just about how do we drive higher return to land and management? We do that through how we advise growers, how we advise them to spend nutrients, seed and crop protection dollars.

RENEE HANSEN: So, why is that becoming so much more important now than it was 10 years ago?

DAN FRIEBERG: It has always been important.

RENEE HANSEN: But are margins getting tighter than they were 10 years ago?

DAN FRIEBERG: Not today. They just blew. Margins are record high. I mean, people’s optimism at the farm gate has bounced way back. We’ve had this dramatic uptick, so margins are stretching back out. So, opportunities for people to make money, but Renee, it doesn’t matter. In good times and bad, this message resonates. It makes sense no matter what. Spending your money wisely just makes sense. Are growers more aggressive when the commodity prices are high? Some of them are. Some of them are way more aggressive. Will more growers take a chance on fungicides because of high commodity prices? Absolutely. Commodity prices have increased more than fungicide prices. When commodity prices are high, it takes less bushels to pay for the fungicide. So, more growers will probably take a shot at fungicides this year than in past years.

RENEE HANSEN: We also talk about, sometimes, growers wanting to grow their operation. Tell me more about that.

DAN FRIEBERG: It’s really natural. It’s just the competitiveness of agriculture. There are a lot of growers who are adding to their operation. They’re wanting to add. It’s all about spreading yourself and your employees and your equipment over more acres. If you can add another thousand acres and still farm in a timely fashion, it makes it more economical. Combines are really expensive, so being able to spread that combine over another thousand acres drives your per-acre costs down, which is the same with your labor. There is additional labor cost to farm another thousand acres. But even labor — employees come with a benefit package. You have to pay benefits. There are a bunch of employee costs that, if you can spread it over another thousand acres, it helps pay the bills and helps you be more profitable.

RENEE HANSEN: So, can you explain the metric that we’re using? We’re using a gauge or a metric, or we’re giving a yield efficiency score. We’re using that per operation, and we’re also doing it per field because we can do it spatially. So, can you just tell me more about each of those?

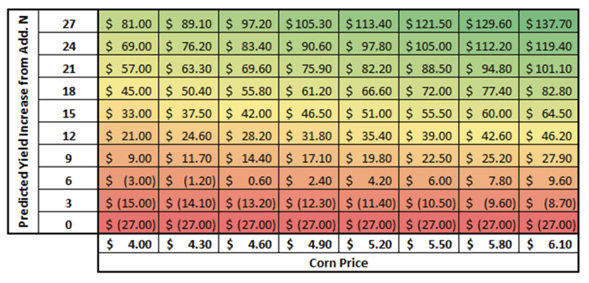
DAN FRIEBERG: Sure. So, the gauge you’re referring to is what we call the Yield Efficiency Score. Really, it’s a fairly simple formula. It’s just a benchmark selling price that every user gets to set. We’re not benchmarking who sold the best, so it’s a benchmark selling price times your yield. So, Premier Crop, part of our analytics program is we’re using the yield file. So, we’re receiving all this yield data. It’s benchmark selling price times yield minus your investment in nutrients, seed, crop protection products and field operation. What’s left is return to land and management. How many dollars per acre do you have left to pay for your land cost and your management costs? So, what you referred to is part of what we’re able to do. Let growers benchmark themselves, their yield efficiency score versus other growers in their area anonymously. Growers like that. It’s just another way to make sure you’re on track or just see how you’re doing compared to others. So, that comparison, people like. They like to be able to anonymously compare with really quality data. That attention to getting the data right is really a big deal and having good quality data. So, that’s a big piece of it, but then the other part you referred to is being able to take it down to a field level. It’s not just benchmarking outside your operation. How do you compare to others? It’s within your operation. If you’re farming 50 fields, just being able to rank order those 50 fields from a yield efficiency standpoint, return to land and management, that’s a significant piece of analysis.

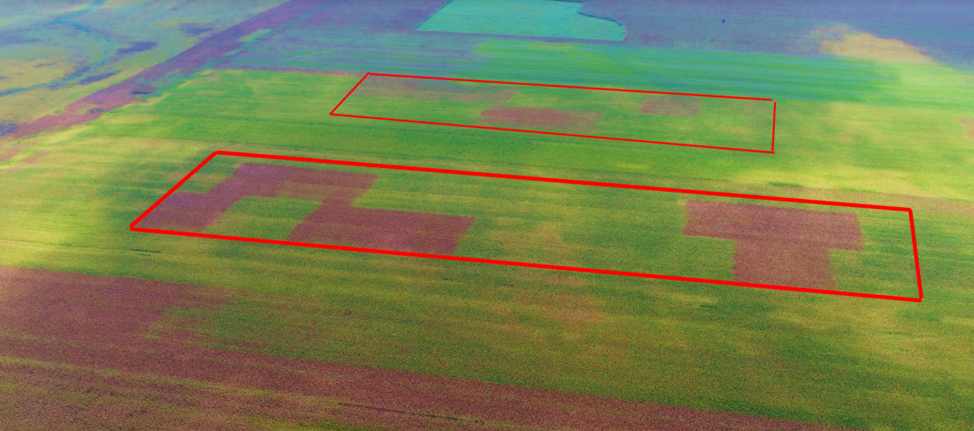
Renee, as soon as growers see those scores, trust me, they do the math so fast on land costs. They know exactly what their land cost is for each field. It’s not something they have to go look for. Then, the last one that you talked about is being able to do it spatially within a field, which means we can do it by management zone within a field. Which is really, by far, the most important to me because what we consistently do for our customers is we spend more in certain parts of the field. We know there are a lot of times, if you’re following our recommendations, it could be a $50-or-$80-an-acre higher input spend. In some parts of the field, we’re spending significantly more on nutrients, and we’re increasing the seed population. So, we could easily spend more in part of the field, and the reason it’s so important to be able to track yield efficiency spatially within the field is so that, at the end of the year, we can prove to the grower that extra $50 an acre in the best part of the field generated more, far more, than the $50 of additional input costs. For me, this is, just this yield efficiency thing, is what we should have done. 10 years ago, yeah, we probably should have pushed harder to do it then because I think growers always respond to anything if you can prove that something pays for a grower. They’ll respond to that. For a lot of new growers — we’re really blessed with a lot of growers who have been with us for decades, and the reason they have is we’ve convinced them over the years that it pays. They wouldn’t keep buying our service if they weren’t sure it was paying. But for a lot of new growers, this ability to tie economics and just have a report card every year that shows: where we spent more, we made more, or where we spent less, we made more. Throughout the entire field, being able to document that what we spent made them more in either higher input investment or lower input investment. Really, growers respond to profitability, but there are so many people who talk about it, and they have no way to prove it. Everybody that drives up the driveway talks that way, but they can’t prove it. They can’t. That’s kind of the magic of what we do. This is the grower’s data. We’re using all the grower’s data, and we’re proving it.

RENEE HANSEN: Yeah, so tell me about using all the grower’s data. You say others are saying that they use profitability. So, what are we doing to prove it? You kind of gave a list of the seed, the nutrients, operations, crop protection, but can you go dive a little deeper?

DAN FRIEBERG: Sure. So, when we talk about all the grower’s data, it starts with just naming the field and getting a field boundary. Once you get the field boundary, you can go get the soil’s data, and now you can get LIDAR data, which is elevation data. So, you can kind of have an idea of how water moves within the field, but then we just keep adding to it. Soil sample information is a big part of it, whether it’s zone or grid sample. A lot of our customers are grid samples, which means we’re measuring organic matter and pH and soil test nutrient levels within the field in small increments, like couple-acre blocks. So, we’re measuring all those layers of data, and then, when the planter makes a pass across the field, we’re grabbing planting date. We have row spacing and population and the hybrid and variety that got planted. And that hybrid and variety is not just the company and the number, but it’s also the trait package. We’re able to sort SmartStax versus VT PRO versus some other traits. So, it’s trait packages, and then, when it comes to nutrients, we’re grabbing the soil sample data. We’re getting what’s in the soil. But then, for us, it’s about what we add, whether we’re making the addition of nutrients through manure, or whether it’s with commercial fertilizer. So, we’re tracking the rate of the nutrient, the cost of the nutrient, the timing of the nutrient, if it’s fall versus spring versus side dress. We can track all those details. If the nutrient had an additive, we’re tracking that, and then you step into crop protection. Now, because of weed resistance, crop protection is, again, becoming much more complicated than it was for a decade when it was just how many ounces of Roundup people were using. Now, it’s a lot more. There are a lot more products being used. It could be 40 different combinations of additives and crop protection products. Each time, it’s the product, the rate, the source, timing, costs, so just terrific detail. Tillage, field operations, how many passes, what the passes were. Just try to incorporate as much detail as we can about what’s happening within the field so that we can do the best possible job of managing all those inputs.

RENEE HANSEN: So, how do we compare this anonymously with another grower, apples to apples? Because you just listed a ton of data layers, a ton of cost information, and let’s say somebody else doesn’t have all that information in the system. How can you compare that apples to apples and get a benchmarking yield efficiency score?

DAN FRIEBERG: We can walk people through this really quick. Renee, there are a lot of growers who have data. They just don’t — it’s scattered. I mean, they have data in the Ops Center. They have it in Climate. They have it in some retailer’s software. I mean, it could be a retailer’s software. It could be on their own. I mean, it’s all over the place. Sometimes it’s not in a digital format. Sometimes it’s written down. It’s just all over the place. But a lot of growers have data, and part of it is how we pass down farm equipment. Every time somebody buys a new piece of equipment, they trade. So, it’s like existing farming operations. They trade, and as they trade, somebody else trades. And when they trade, they trade the technology with it.  They’re not stripping the monitors out of the cab each time they trade. A lot of times, they’re not. So, that technology is being passed down, meaning there are a whole bunch of growers who don’t operate new farm equipment, and they have the technology in the cab. There are just a lot of growers who have the capability. They have the capability of collecting data and capturing data, and they have a lot of variable-rate capability of which a lot of them aren’t using.

RENEE HANSEN: Yeah, I was just going to ask you that too. Can you elaborate? The growers have so much that they can do with their data. Do you feel that they don’t even know what they’re capable of getting and gaining with the technology they already have?

DAN FRIEBERG: I think, a lot of times, with a lot of people — a lot of growers and a lot of people — it’s finding somebody you trust. If the person you trust for advice doesn’t talk to you about this or doesn’t have a solution, you might not ever pursue it. You might not pursue it on your own because, in your circle, nobody’s championing why you should be using the technology in the cab or your data to make better decisions.

RENEE HANSEN: Well, if somebody doesn’t mention it to you, you don’t know what you don’t know.

DAN FRIEBERG: Yeah, you don’t. You literally don’t. So, I think that’s part of what happens. Another place I wanted to go, Renee, was people talk — I mean, when I talk about everybody that drives down the farmer’s driveway has a profitability message, a lot of times, they say return on investment. They wrap everything. So, the number of times people say ROI or return, it becomes a buzzword that nobody backs up. Nobody has. When they talk about backing up their ROI, they pull out some plot book. It’s some trial that happened someplace else. I think it’s one thing that we just really do a lot. You can’t really tell somebody the ROI unless you do an experiment in the field, and that’s really what we do all the time. We just do experiment after experiment, in volumes, in growers fields. It’s all in pursuit of having better recommendations. So, the reason we do experiments is so we can calculate ROI. It’s so that we do know whether that input paid or not. If I go out to a grower and I talk to them about nitrogen rate, and their total N rate is 200 pounds of actual N, and I think that they’re over-applying, the best possible way for me to have that discussion is just to suggest that we put a lower-rate experiment in their field. It doesn’t have to be a lot of acres, but if that works, then the grower saves money and gets higher yields or same yield. That’s a starting place and a discussion.

Same with everything. Every input decision can become an experiment. So, to me, the best way to get an ROI is to simply do a trial. And we’re not talking about — when I got in the business, a trial meant flags. It meant field flags, and it meant a ‘weigh wagon.’ That’s how you did trials. You just spent all your — like I spent all fall running around with a ‘weigh wagon.’ Literally, just day and night, running around with a ‘weigh wagon’ because that’s the only way you could do a field trial. And now, everybody’s got the ability to measure. The monitor in the cab is measuring. So, a little bit of help on calibration, making sure you’re calibrated, and you’re off and running. We can use the technology to execute field trials, and it’s just so much easier than it was years ago. And it really just opens the door. It opens the door to back up the ROI message over and over again. It doesn’t have to be results from somewhere else. We say growers love local data, and you can’t get more local than my fields. That’s who we are. It’s not: ‘How did it do somewhere? How did it do for your neighbor?’ It’s: ‘How did it do for you?’ And doing trials is a big piece of what we do.

RENEE HANSEN: Yeah, and you’re talking about the buzzword of ROI, and I feel like Premier Crop has coined the buzzword of yield efficiency. I’m starting to see yield deficiency pop up in other places, people talking more and more about yield efficiency rather than using ROI. And why is yield efficiency a more important message than ROI?

DAN FRIEBERG: So, for me, they can be really similar. I mean, they can be part of the same discussion. So, for me, yield efficiency is just combining economics and agronomics, and it’s at every level. It’s sub-field, in a trial. It’s management zones, in a field. It’s this field compared to another field. Across your whole operation, how do my fields compare? Then, it’s being able to go beyond your own operation to: ‘How do I compare to peers in my neighborhood or my region?’ A lot of times, when I think of ROI, I tend to think of it as — so, yield efficiency is this all encompassing bucket of nutrients and seed and crop protection and field operations. But, for me, ROI is more about individual components that make up those buckets. If I’m a grower, it’s like: ‘What’s my ROI if I put 50 pounds of Y-DROP nitrogen on?’ So, later nitrogen. What’s my ROI if I do a fungicide? What’s my ROI if I do a biological? All those things, all those decisions roll up into yield efficiency because they’re all input costs. And, hopefully, they impact yield. So, all those things roll up into yield efficiency. But when I think of ROI, I’m thinking of individual decisions. I mean, decisions I’m making about input components of what goes into yield efficiency.

RENEE HANSEN: Well, and I think it’s important to note, also, it doesn’t have to be with a variable-rate application of anything. You can still get a yield efficiency score with flat rate.

DAN FRIEBERG: Sure. As we onboard new growers, that’s a big deal, just to capture where they are. Before you started doing anything, what was your yield efficiency?

RENEE HANSEN: Yeah, so if somebody is coming on board and is not doing any variable-rate nutrients or seed, they can still get a yield efficiency score in a benchmarking setting.

DAN FRIEBERG: Yep. Renee, earlier on, I just remembered what it was I wanted to talk about. Earlier on, you kind of said or you asked something like: ‘Why don’t more growers, or why do I think more growers don’t do this or think like this?’ I think that a lot of growers have the attitude of: ‘Been there, done that. Got the T-shirt.’ They think they tried it. Somebody pitched them an idea. Somebody told them about precision ag or whatever buzzword they used at the time. Somebody told them how this was. Somebody created this expectation, and then whoever that was didn’t deliver.

RENEE HANSEN: There’s no follow through.

DAN FRIEBERG: Yeah, so there are a lot of growers who, you meet with them, and they say: ‘Tried that 15 years ago. Didn’t work here. Doesn’t work here. Maybe it works where you’re at. It doesn’t work here.’ Then, you really start asking questions about: ‘What do you mean it didn’t work?’ And what you find out is they never compared. They never looked at the relationship of yield and the prescription, whatever it was. Nobody did the basic analytics for them or the classic one. The classic one, 20 years ago, was people would say: ‘I’m going to grid-sample your field. We’re going to variable-rate apply nutrients. And all these multi-colors, from high to low, on the map, we’re going to even all those out. We’re going to build up the low areas. We’re going to pull down the high areas, and your map will all be green. We’re going to make your field uniform.’ And 12 years later, the field is no more uniform than it was to start with. And my point is that should never have been the goal. You get paid on yield efficiency. You get paid on generating more return for every dollar you invest. You don’t get paid for making your fields uniform. The reason it didn’t work, Renee, is because the high-yielding areas tend to pull down nutrients because you’re consistently removing more nutrients from those areas. And even though the equation, the variable-rate equation, was supposed to be dealing with that, it never caught up. Those high-yield areas just kept producing more and more, removing more and more, and the reason the field wasn’t more uniform at the end of four years or 12 years was just they never kept up with that additional crop removal associated with really high yields.

RENEE HANSEN: So, the way I see it, utilizing a yield efficiency score, the way that we are calculating it, can potentially help a grower to grow their operation in a multitude of ways. Not only by gaining more acres, but they can also, potentially, gain more profits with what they already have by optimizing and utilizing some variable rate to see where their yield efficiency score is. They should be able to see what fields really aren’t producing as high, so they shouldn’t be spending as much in that field, in certain parts of the field.

DAN FRIEBERG: I think the whole yield efficiency message is just, I think, it helps growers know their costs. It helps them know. I mean, it’s just putting data to work for you. Really, like you say, you can drill down on which fields are most profitable, which aren’t. You can drill down on which parts of fields are most profitable. I think the more you help growers know their costs, the better managers they are.

RENEE HANSEN: But I feel like they already know their costs. I feel like most of them are like: ‘Oh, no, I got that. I got it on a spreadsheet. I have my tally. I know exactly what I’m going to be spending on my inputs.’

DAN FRIEBERG: And you’re right. They know their costs across the whole operation, probably. I think the difference is just knowing it within field by field and within fields. So, it’s probably just the nature of being able to break it down into finer resolution. Renee, what we don’t do is take university-average cost associated with farming and divide it by their yield. This is not pretend economics. This is tracking. Like I say, we track if that part of the field is getting 10,000 more seeds than the other part. We’re tracking the cost associated with that 10,000 more seeds in the best part of the field.

RENEE HANSEN: We talk about plans, like having a plan and then pushing that to ‘actual.’ This is the ‘actual.’ I mean, we’re talking about what actually happened.

DAN FRIEBERG: Growing your operation is a tough one, Renee, because there are so many pieces to it.

RENEE HANSEN: Right.

DAN FRIEBERG: One thing that stands out to me is — it was from a winter grower meeting. And these growers were talking about how there was an area where there’s a lot of livestock also, and they were talking about how every pen of pigs or cattle that they sold, they knew the economics associated with that pen, meaning they tied it out economically. In livestock, it’s just such a part of the culture. Every unit of production gets tied out economically. So, sometimes, I’m so jealous of the livestock industry because I feel like: ‘Okay, you guys are way ahead, like we’re playing catch up.’ But that’s really what we’re trying to do. Tie out every unit of production economically. It’s not enough to know just what the total weight was. It’s converting the weight and the input cost into dollar returns. And that’s kind of what we’re focusing on.

RENEE HANSEN: Thanks for listening to the Premier Podcast, where everything agronomic is economic. Please subscribe, rate and review this podcast so we can continue to provide the best precision ag and analytic results for you. And to learn more about Premier Crop and farm efficiency, visit our blog at premiercrop.com.

farm efficiency

Understand Your Field Profitability

Now is always a good time to start managing your farm decisions at a finer scale.  If someone were to ask you if you know your cost of production, you’d likely have an idea.  But, when I say it’s time to manage at a ‘finer scale,’ the question that precedes it is, “Do you know how much it costs you to raise a bushel of grain in each unique part of your field—that is—as your productivity changes across the field?”

Most growers focus on understanding their costs and profitability based on assumed averages with an understanding that some ground is subsidizing other ground.  Growers understand diversification and spreading risk.

How could your management decisions change if you started to understand your field profitability based on actual field performance? While knowing field averages is important for marketing decisions in season, layering your costs with your actual yield data tells a different story.

Not all fields are created equal, we know that.  But how does it change our farming practices?  Understanding breakeven cost per bushel at a finer scale compared to the overall operation can change how you manage those fields.  Here are our 4 key takeaways that drive how we help growers understand their profitability and plan for the next year.

  1. There is drastic variability within each field
  2. Higher yields are key to success
  3. It’s important to know the ‘why’ behind profitability
  4. Look deeper into average production costs across your operation

______________________________________________________________________________

THERE IS DRASTIC VARIABILITY IN EACH FIELD

There are certain parts of your field that consistently outperform the field average. On the other end of the spectrum, there are parts of the field that produce well below the field average year after year. This shows that variability in your fields is real, so how are you going to manage this variability? We do this by using variable rate prescriptions to drive down your breakeven cost/bushel at the sub-field level. Below you will see an example of a field that had variable rate fertilizer and planting applied to it using our Management Zone method. As you can see, this grower invested $33.24/acre more into the A zone of the field versus the C zone of the field, but he was still able to lower the breakeven cost/bushel by $0.37/bushel.

One grower we’ll use as an example had not yet invested in variable rate seeding. He was variable rate spreading fertilizer based on actual yield combined with soil test data, but his seed costs were not always being covered by the bushels raised. He ran the numbers on how he could use technology to adapt his seed costs to the productivity of his fields, and decided to put electric drives on his planter for the next year.

HIGHER YIELDS ARE KEY TO SUCCESS

You can’t save your way to prosperity.  Choosing to cut costs in a way that is contrary to what is agronomically correct will not gain you bushels. Without bushels to cover your costs–ultimately you will not be profitable. Lenders can be quick to encourage cost-cutting. But cutting nutrient, plant health and pest management investments can cut yields and profitability.

We frequently lead our customers to spend more input dollars only on the best field zones creating higher margins. That is possible when you can track and record those cost/investment differences, then share a profitability analysis (see graphic above) at the end of the growing season.

In corn and soybean production, you can spend your way poor but you can’t save your way into prosperity. Frequently, the only way to lower your cost per bushel and increase profits is to produce higher yields.

FIGURE OUT THE ‘WHY’ BEHIND PROFITABILITY

Here is an example of a time where soybeans cost the grower more to raise than the grower had planned. Even when the average yield was 60 bu rather than the 50 bu estimate the banker used, the actual costs ended up just over $12/bu. We needed to figure out why, and what could be done differently to be profitable on soybeans. By looking at each breakeven cost per bushel map, the grower found some major problem areas in a few fields, mostly related to weed pressure and sandy soil. While he knew there were some issues in weedy areas, he could now visualize what it was truly costing –upwards of $19 per bushel on over 7 acres.  Contrast that with an adjacent high yielding area that only cost $7-10 per bushel of beans–it got their attention.

LOOK AT AVERAGE PRODUCTION COSTS ACROSS YOUR OPERATION

Using the same grower from above, his owned acres were covering high costs on their rented acres in a bigger way than he realized.  By looking at each fields’ cost per bushel map alongside a rank of their fields’ average production costs against each other, he found that his rented land was costing them $.50 more per bushel for corn and $.71 more per bushel on beans (when still assigning some value to the cost of owned land).

average production costs

Through transparency with multiple landowners and sharing of information, they had productive conversations. While rent was not lowered, it wasn’t raised on any of his acres. They also were able to show specific areas of fields that needed tile and could articulate what it was costing them.  One landowner signed a new flex lease agreement including execution of cost sharing for tiling.

__________________________________________________________________________

If you’re a grower reading this, you might be comparing your own breakeven costs to this example and thinking “I’m doing better than that.”  Our question to you would be—do you know that for sure?  Have you analyzed it to this degree?  You might still be leaving dollars on the table that could be in your pocket.

One of our biggest takeaways for understanding your field profitability is the understanding that managing differences in productivity is key. You need to increase profitability on every acre.  The best parts of the field can’t be relied on to cover the costs for the rest. Using technology and data analytics to prove what works in each unique environment so that it can be managed will be critical to your successes. If you don’t measure it, you can’t improve it!

New call-to-action

Understanding In-Season Decisions with Economics

For the most part, farmers will have made their input purchasing decisions before the soil is warm enough to begin planting.  Those in-season decisions that still remain can be some of the most challenging to make.  Not because they’re the most financially significant, but because there are so many factors present once the crop is planted (current weather, short and long-term forecast, crop condition, grain markets, fluctuating input prices, and an endless list of tasks to complete).  All of these factors can have an influence, consciously or sub-consciously, on a grower’s ability to make an effective in-season decision.

In the book, How to Decide: Simple Tools for Making Better Choices, the first chapter is titled, “Resulting: Outcomes in the Rearview Mirror May Appear Larger Than They Are.”  Resulting, or outcome bias, is when a decision is made based on the quality of a prior outcome.  This type of rationale for decision making happens frequently and can lead to poor or unintended outcomes.  Here’s an example of what a resulting-influenced decision could be for a grower.

Last year Farmer John applied a fungicide to a field and left a few check areas.  The areas that received fungicide yielded 20 bushels more per acre.  Farmer John was so happy with the result he decided to apply fungicide on all of his corn acres going forward.

Will Farmer John see a 20 bu./acre yield advantage for using fungicide again this year?  Potentially.  The point I’m trying to make is that making decisions based solely on a previous personal experience isn’t a great process, especially when you’re in up-to-your-knees with other crop production tasks.  Even if the result were to turn out positive, I think it is important to balance data with ‘gut-feeling’ and instinct when making in-season decisions (80% data, 20% gut-feeling).

Starting the growing season with a plan is the first step to managing in-season decisions.  A comprehensive crop plan should factor in all potential applications and products that may be applied to a field within the given growing season.  The ability to reference a sound agronomic database with multiple years of local and regional data will help give confidence to the decisions outlined in the plan and prevent or minimize questions like these when time is of the essence:

1. How should I best-place the hybrids I’ve already purchased?

2. What are the right seeding rates for the hybrids / varieties within each field?

3. When should I start planting?  What if there is rain in the forecast two days out?

4. Do I need to use a starter fertilizer on my manured ground?

5. Do I need to be applying sulfur with our weed & feed, pre-plant?

6. Does my corn have enough nitrogen or should I make a side-dress application?

Using historical agronomic data relative to your own fields allows you to quantify the yield impact of many different agronomic variables.  Historical data isn’t a guarantee of future performance, but it’s a crucial component of quality in-season decision making.  For example, the ability to reference historical data of yield response to applied nitrogen from wet or dry years, and anything in between, provides a guideline for current conditions.  The next step in the process is to add current economic values, input costs and grain selling price, to the data being referenced.  Here’s another example.

Farmer Tim currently has an average nitrogen rate of 150 pounds applied to his corn fields.  The weather has been hot and dry for a few weeks, but there is a chance of rain in the nearby forecast and long-term predictions are trending slightly wetter.  The corn market has been volatile, but Farmer Tim has forward contracted some bushels and the current price is well above his breakeven.

www.weather.com

Weather

https://www.tradingview.com/x/wGu8tudh/Corn Futures

Referencing local historic data, Farmer Tim and his agronomic advisor determine that there is likely an 18 bu./ac opportunity to applying an additional 30 pounds of nitrogen.  At the current cash price that equates to $60+ per acre additional profit (Assumptions: New Crop Cash Corn = $5.00/ bu.; UAN = $.50/lb.; Application charge = $12/acre).

Marginal Return on Additional Nitrogen:  (Predicted yield increase x Corn Price)  –  (30# of Nitrogen + Application Cost)

Marginal Return on Additional Nitrogen

It’s important to incorporate economics when making in-season decisions to ensure return on investment (product and application expense).  In the example above, if the data showed only a 6 bu./ac gain, much closer to breakeven, the decision becomes harder to make.  Understanding the amount of economic risk or reward associated with in-season decisions should be included in a crop plan.  Formulating your crop plan to incorporate ‘What If’ scenarios will make it easier to pull the trigger on in-season decisions.

In-season agronomic decisions are challenging and often don’t receive the attention their economic impact warrants.  It’s important to work with a trusted agronomic advisor to help generate your crop plan so you can incorporate data and economics.  Having scenarios outlined ahead of season will increase the quality of your in-season decisions, and hopefully make them easier to make. Also, consider putting in some trials with your in-season applications (on/off fungicide or different nitrogen rates) – the best data comes from your own fields.

Response to Fungicide: It Varies

You don’t have to look very hard to find chemical manufacturers’ advertisements claiming a significant positive yield response (15, 20, 25+ bu./ac) to using one of their fungicide products. There are many effective products on the market that provide good control and protection against fungal pathogens, but advertisement claims based on ‘average trial data’ aren’t guarantees for your fields. Three critical components (a host, favorable environment, and pathogen) must come together at the same time for a plant disease to thrive. These three components are commonly referred to as the Plant Disease Triangle. Management or alteration of just one of these components prevents or reduces disease severity.


diseaseHost

It’s important to refer back to the Plant Disease Triangle when gauging the need for fungicide application, as well as past local trial results and current crop economic conditions. How do environmental conditions within the field (soil pH, fertility levels, applied nutrients, etc.) affect the vulnerability of the host (corn or soybean plant) as it relates to disease pressures? Is a pH imbalance affecting nutrient uptake, which in turn makes this specific hybrid more susceptible to fungal disease pressure? Does it make sense, economically, to apply fungicide to lower productivity areas within fields? Variability exists in all fields and managing the yield-limiting factors is what will show a yield response come harvest. Agronomy is complex and agronomy is local. Yield response to fungicide fluctuates within each field based on the interactions of many variables, which are all part of the disease triangle. Conducting on-farm fungicide trials generates more agronomic knowledge related to this complex interaction, which improves decision making for future applications.

Being able to use my family’s farm as a ‘testing ground’ makes working with the solutions Premier Crop provides to our partners even more enjoyable. I am able to experience first-hand what many of our partners and advisors put into practice each and every day. Last year I placed a few fungicide Enhanced Learning Blocks (ELBs) in one of our fields to test the effectiveness of a popular fungicide product. An Enhanced Learning Block is a randomized, replicated trial of different rates, products or application timings. ELBs provide a formal testing environment within a field to determine whether or not the treatment had a statistically significant impact on yield.

Trials were setup to be an on/off scenario – 20 gal/ac and 0 gal/ac each replicated 6 times within the trial area (ELB). Two of the ELBs were placed within the same hybrid – one on heavier soil and the other about 800 feet away in lighter soil on a hill. The product was applied at R1 with a Hagie sprayer. Prior to application we had been receiving ample rainfall, so we anticipated potentially higher fungal disease pressure, however that was not the case.

The image below was taken with a drone about one month after application. You can easily see the replicates in the trial area that did not receive any product. Based on the image what do you estimate the yield difference to be between the treated and non-treated rates? What would an imagery solution come up with for a yield difference based off their algorithm calculating yield from NDVI?

fungicide_ELB

As we were harvesting this field we could see the location of the fungicide trials as we worked towards them. While combining in the trials the difference in plant structure was obvious – the tops of the corn plants in the untreated replicates had all broken off. Both the drone image and visual observations at harvest pointed to a significant yield response to fungicide in both trials.

When I received the Enhanced Learning Block trial report I was a bit surprised with the actual results – visual observations are deceiving! One trial had a 1 bu/a yield response and the other was 8 bu/a. I was expecting at least a 15 bushel difference.

#1 – lower ground, heavier soil.

#2 – higher ground, lighter soil.

Why did the trial results end up this way? I have some ideas, but no definite answers. Likely the yield response shown in the trial on lighter soil was due to the treated plants’ improved ability to withstand late-season moisture stress, which wasn’t a yield-limiting factor in the heavier soil environment. What I do know is that a 1 bu/a response didn’t come close to paying for the product and application costs, and an 8 bu/a response was likely a little better than break-even. Understanding when, where, and to what degree these products work will allow for better utilization (spatial application), ultimately increasing ROI.

Are we going to spatially apply our fungicide next year? Probably not. Are we going to continue to conduct on-farm trials and Enhanced Learning Blocks to learn more about when, where, and how well fungicides work? Definitely. With the power of local agronomic knowledge, I don’t think it will be too long before spatial application of fungicide becomes a normal practice in crop production.

Why You Need Farm Analytics Software

We can all probably think of a product, service, or brand we feel biased towards. Then think about how you make decisions on your farming operation. Do you have any bias on how different fields respond to a certain seed, fertilizer, or crop protection product? Allowing your bias to persuade field decisions can be very costly and frustrating. Your knowledge of your own farm is invaluable. Using farm analytics can enhance your decision making by removing or challenging the bias with objective analysis.

I am guilty myself. It is easy to make assumptions and decisions based on previous experiences. However, using Premier Crop’s analytics platform, you can begin to dissect the different yield environments on your fields.

WHERE TO START? 

You can start anywhere. Do you have computers or hard-drives full of unused files or binders full of printed maps? Organizing and analyzing this data, and using it to make more informed decisions could be the biggest ROI on your farm.  You don’t have to be an expert on computers or an IT wizard, all you need is a trusted partner to help take the complexity out of your data so you can validate or challenge your own assumptions in order to optimize profit. Looking to read further about how to start using the data you’ve already collected? Download our Five Steps to Get Started Guide.

WHAT ABOUT MY AGRONOMIC ADVISOR?

A traditional field agronomist who is providing scouting services and making product recommendations is still a valuable resource for your operation. The difference between an Agronomist and a Precision Ag Specialist is that an Agronomist has years of experience scouting for and monitoring the physical characteristics of your fields. A Precision Ag Specialist can take those physical characteristics and visualize them over your field and compare them to see how ALL of the layers are working together.  When you combine the two with a powerful farm analytics platform, you can really increase your return on investment!

I once had an experience working with a grower and his agronomist reviewing yield maps and grid sample data. During the discussion, the agronomist looked at me and said “You know, I have been scouting these fields for 20 years, and in one hour, you have just identified many of the key issues I have spent years identifying by presenting his data in an organized fashion and bringing these data layers together.”

DOES PRECISION AG PAY?

At Premier Crop we focus heavily on PROVING what you’re doing on your farm. We frequently encounter a situation where a grower has been frustrated with precision ag in the past. Their frustrations come from the fact that there is not a good analysis of the precision practices being  implemented. One example we commonly see, and have proven, is a $100/acre swing in profit by increasing yield and saving seed with variable rate seeding, simply by optimizing the seeding rate to unique areas of the field. The dollars that are left on the table can be shocking if you’re not implementing VR Seed and VR fertility practices, AND verifying “it works” by marrying your agronomics to the economics.

BRING IT ALL TOGETHER

Implementing a farm management system that organizes your most important farm information in one place can be eye-opening at first. You might be surprised that your original biases, thoughts, and intuitions may not have been as “true” as you thought. Premier Crop Systems simplifies and visualizes where to best spend your input dollar and how it can improve profits across all of your acres. We use Yield Efficiency to determine much is left to pay land and management after your costs are subtracted from total revenue.  Below you will see our Yield Efficiency by field across your farm. With this metric, we help growers determine which fields are making the most money.

Premier Crop Systems is proud to be the leading farm analytics platform since 1999. We continue to advance and improve alongside our partners and growers on a daily basis. Together, we help you gain more insight into your operation for confident and profitable decision making. Let us come alongside you to reduce the complexity and add another dimension so you can exceed your own expectations. Contact us now to schedule an information meeting.

Why do you need to start using farm analytics software? Here’s 4 reasons:

  1. Fully utilize the data you’ve already collected and use it to make decisions
  2. Take advantage of the benefits of having a team of agronomic professionals working together for your operation
  3. Optimize seeding, nutrient, and fertilizer rates to see swings in profitability and savings per acre
  4. Become confident in your decision making while reducing the complexity of data

    New call-to-action

Use Agronomic and Economic Data to Make Management Decisions

At this time of the year, it’s easy to feel like yields are largely a function of weather – temperature and rainfall. Over the years in hundreds of grower meetings, I’ve heard that sentiment repeatedly. If you are inclined to think that way, think about this scenario.

Imagine a flat 160-acre field in your area, farmed by the same grower for 30 years, is going to be auctioned to the highest bidder. The field is unique in that it is all one soil type ( I know there is no such field in most areas – but we’re pretending so please play along). Pushing for the highest value, the auctioneer splits the field into two side-by-side 80 acre tracts – selling the field fast as two 80’s and then as 160.

The price received as two 80’s is higher, so the next year two different growers farm each of the 80’s. The entire field was soybeans the year before, so both growers planted corn in the first year farming their new purchase. Both will receive the same growing degree units and virtually the exact same rainfall. So, how much yield difference could there be between each of these two 80’s the following harvest?

Screen Shot 2021-08-05 at 2.24.22 PM

Over the years, I’ve used this example with growers in small group meetings and usually the answer is in the 40-50 bushel per acre range – sometimes as high as 75-80 bushels per acre difference!

How can there be that much difference? Simple. It’s because management matters. Our goal at Premier Crop is to encourage you to use your agronomic and economic data to make better management decisions.  With over 20 crop years in the books, we’ve seen it over and over again – similar soils and weather but dramatic differences in results. Usually, it’s not one decision, but the combination of multiple decisions.

Yield by Variety by Soil type-01

When it comes to hybrid and variety selection, it’s common to find 20-30 bushels per acre differences on the same soil type and same weather events. A starting place is to look at your own hybrid and variety performance data by soils – both at a field level and across your entire operation. Your data can be a guide for not only making next year’s hybrid and variety selections, but also where to place specific genetics. The more data you collect, the more you can make data driven decisions. Applied fertility rates, planting dates, planter performance, trait packages, soil test levels, planting populations are examples of some of the critical agronomic decisions you make every year. You might be able to hold Mother Nature accountable for the first 50% or even 75% of your yield results, but the other half (or less) and all the profit is your responsibility.