“We’re all about tying the economics to the agronomics, which just means when we’re adjusting nutrient rates and plant seeding rates and decisions about what we spend in different parts of the field, we’re tying that out at the end of the year.”
– Dan Frieberg
RENEE HANSEN: Welcome to the Premier Podcast, where everything agronomic is economic. Today, we’re talking with Shay Foulk with Ag View Solutions on his Ag View Pitch podcast. We recommend that you go listen to the Ag View Pitch podcast and subscribe. They have numerous podcasts out there with lots of valuable information. Today, Shay is talking with Dan Frieberg and Brenton Rossman about the value of Premier Crop.
SHAY FOULK: Welcome back, everyone, to another episode of the Ag View Pitch. Today, you have Shay Foulk with some special guests from Premier Crop Systems. I appreciate everybody taking a little bit of time to join in. We have Dan Frieberg and Brenton Rossman, as well as Renee Hansen, tuning in. Dan and Brenton, I’m hoping here that we can get a good introduction from both of you and learn a little bit more about what Premier Crop Systems is. I’ll preface this by saying we really enjoy having this perspective and different conversations on what organizations can provide and what value they can bring to the farmers that are listening to this podcast. So, if we could just start with a quick introduction from each of you and get going from there.
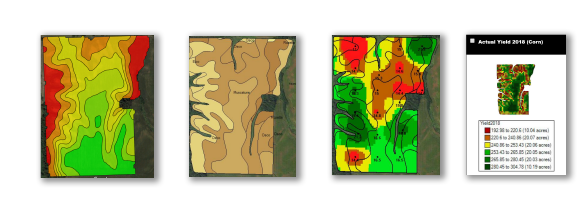
DAN FRIEBERG: Sure, I’ll go first. Dan Frieberg, and I started the company in 1999. Really, Shay, it was kind of the advent of a lot of spatial files, meaning georeferenced files. So, if you think of a yield file, we were starting to be able to tie the yield monitor out to a GPS receiver. Then, soil sampling and variable-rate nutrient activity was going on. So, it was just all this agronomic data that now could be georeferenced to a spot in the world. It was just kind of born out of that idea of being able to tie it all out and build a database file that is a georeference for each field each year and be able to analyze the results and provide insights and turn that into action the next year. The company does just a lot of variable-rate activity. We just believe that the right rate changes within a field boundary. That’s how we got started, and I’ll let Brenton go from his perspective.
BRENTON ROSSMAN: Yeah, thanks. Brenton Rossman. I’ve been with Premier Crop Systems for five years now. Started with the company right after college. Primarily work with our retail partners in delivering our program through the retail channel. So, I live in northwest Iowa, which is where I grew up and have the opportunity to help on my family’s farm. I enjoy getting to utilize our tools and get firsthand use with them on our own operation, as well. Happy to be visiting with you today.
SHAY FOULK: Yeah, that’s great. When it comes to that georeferencing that you were talking about, Dan, I recently read a report that anywhere from 62 to 70% of farmers across the United States are utilizing some form of yield mapping systems or variable-rate applications. How have you seen the adoption of these technologies change over the last decade or so, in particular, I guess, through the Midwest here, where we’re generally located? What do you think that opportunity looks like in the future?
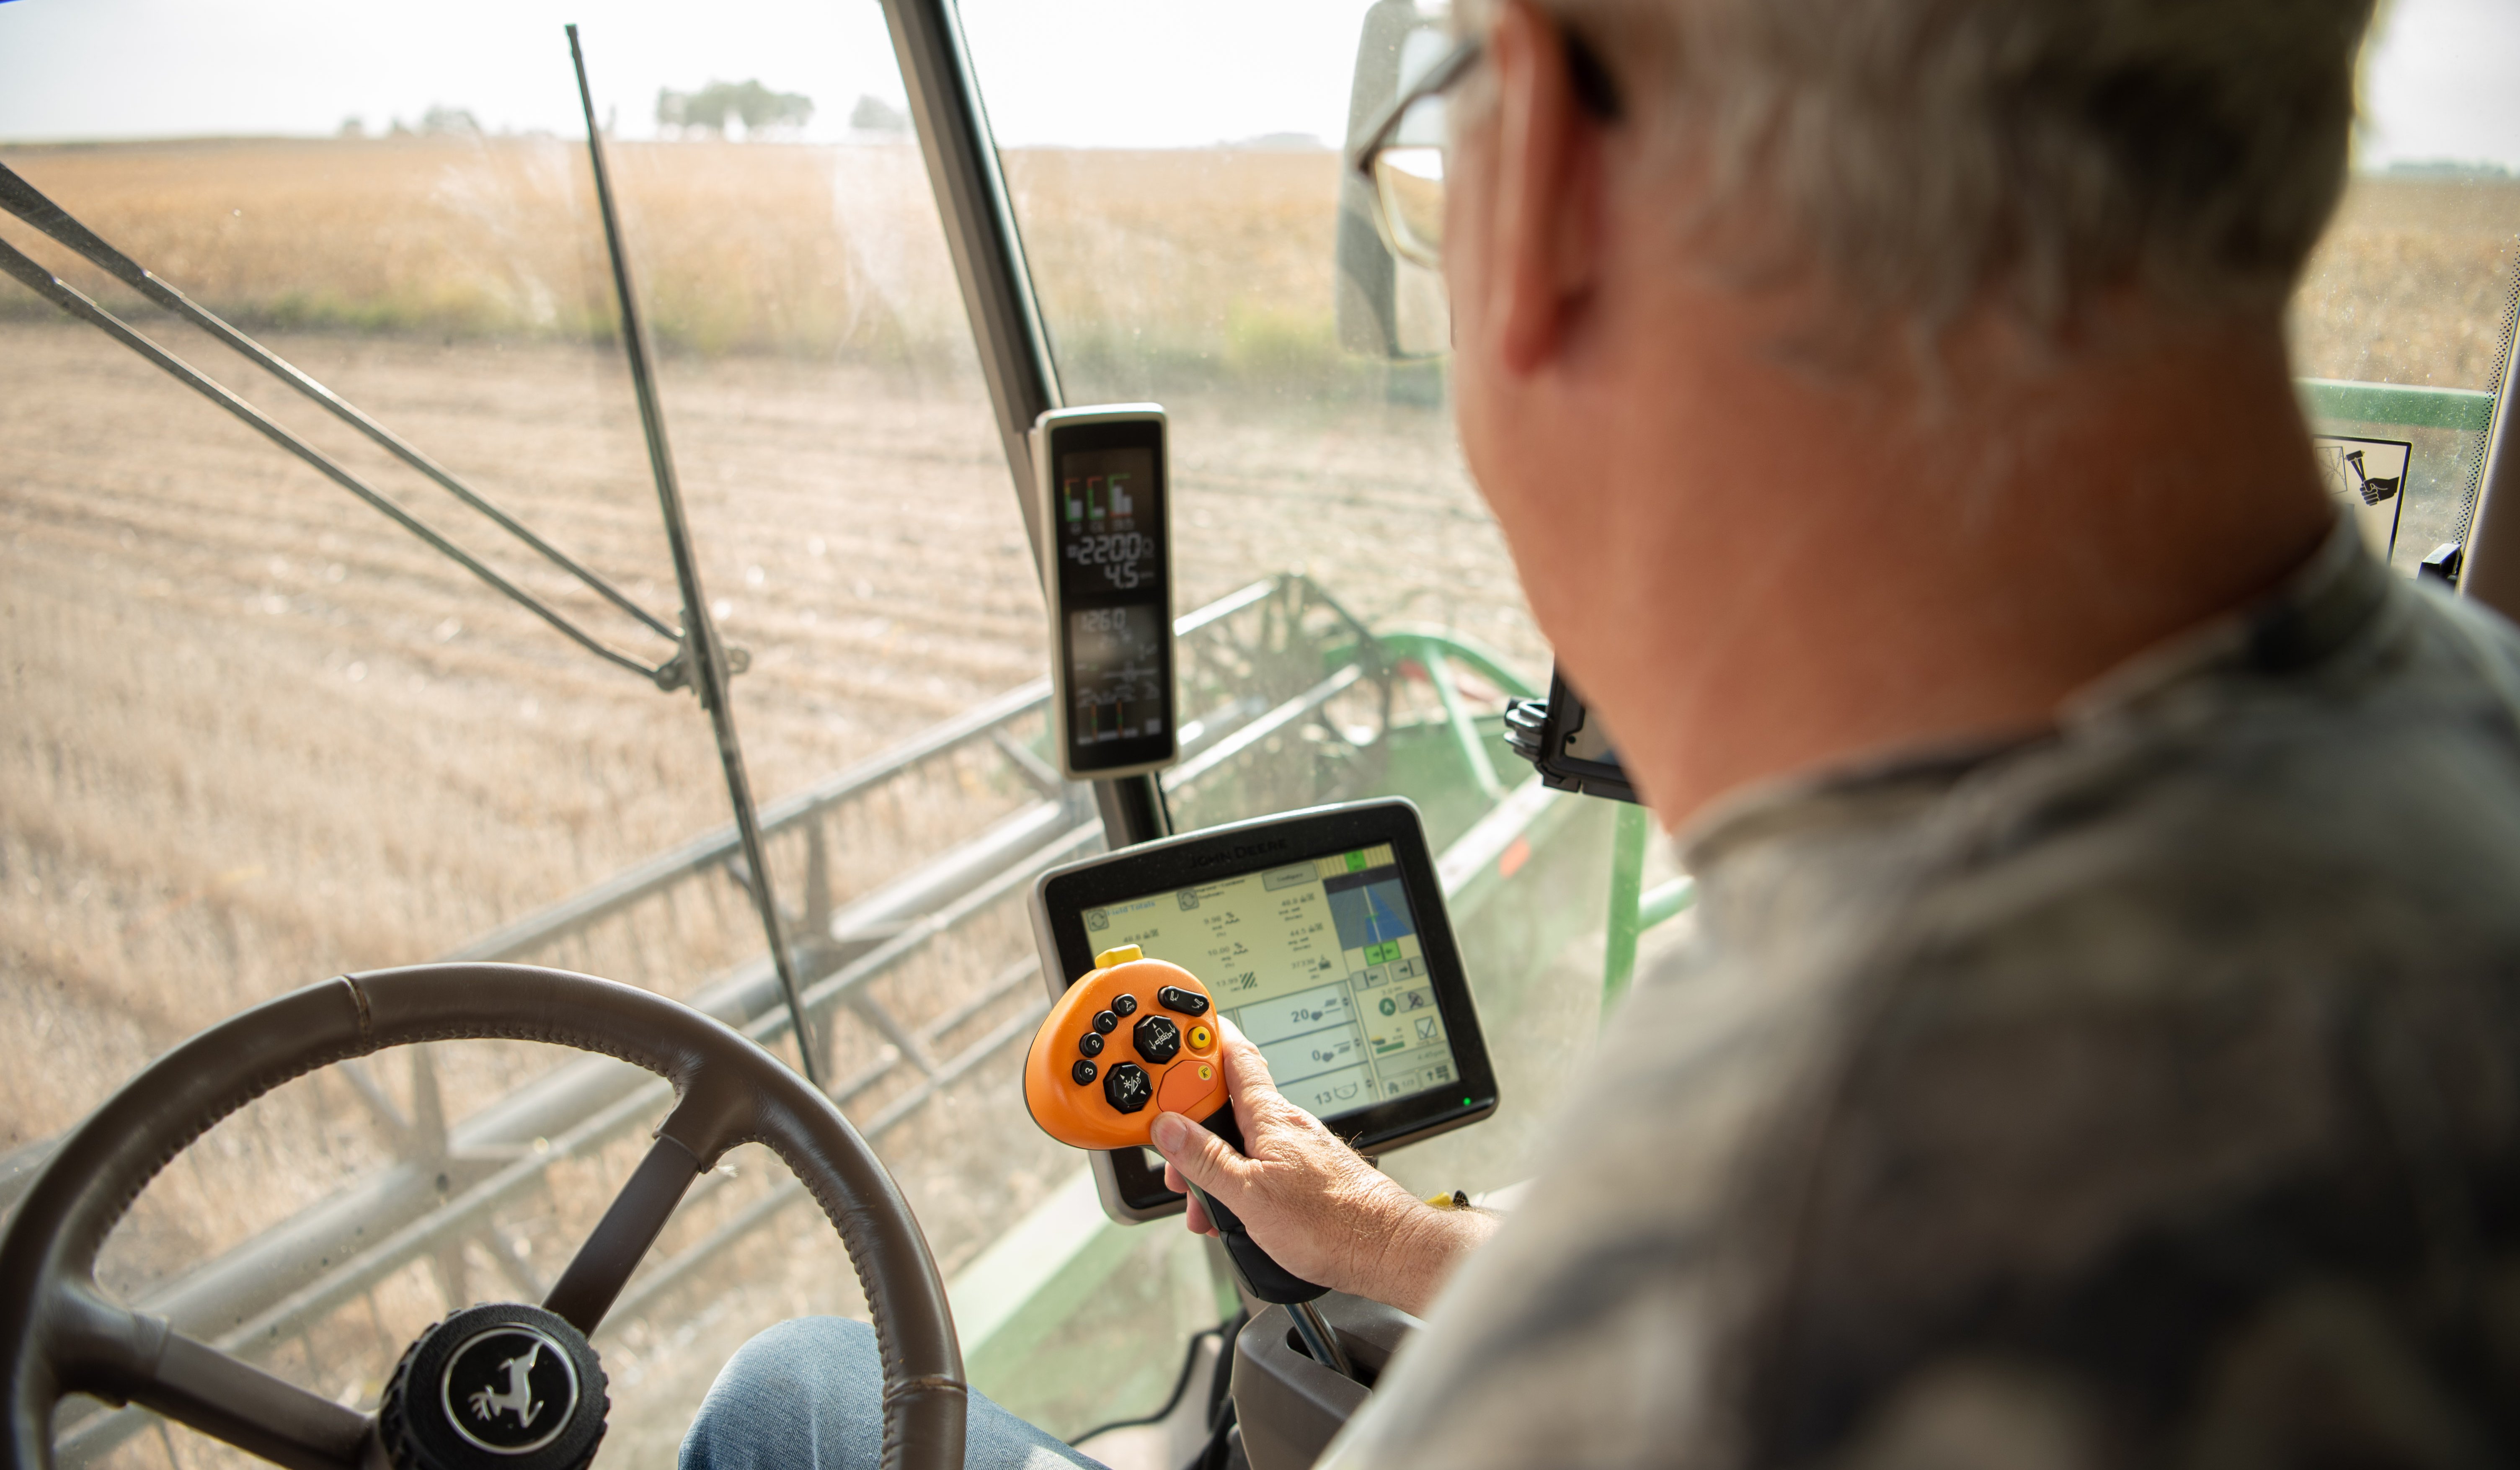
DAN FRIEBERG: I think we went through a period of high commodity prices the last time. The equipment companies, really, were one of the beneficiaries of high commodity prices. So, a whole bunch of people upgraded equipment, and every time that happens, they upgrade technology, as well. Then, that means that the technology they were using passes to the next buyer of that equipment. So, there’s kind of this ripple effect of more and more technology. That’s why surveys come back like that, but what we find is a lot of people aren’t really utilizing the data the way we think it’s possible. So, a yield monitor can become “Harvest TV,” where it’s almost like an expensive moisture sampler, which is great because you’re able to direct grain to the right spot for drying and things like that. But we think there’s so much more possibility to use your yield file as a way to measure agronomic and economic success.
SHAY FOULK: You better be careful, Dan. I might steal that “Harvest TV” and make a YouTube channel out of it. I like that term. Brenton, from your perspective as the farmer and the background that you’ve had with your family operation there, how long have you had some of this technology in the farm operation, and where do you see advancements from the farmer perspective moving forward?
BRENTON ROSSMAN: I would say my dad has been a fairly early adopter to the hardware side of the technology. Variable-rate drives on our planter probably the last 12 years, at least, I would say. Collecting yield since the nineties. So, we’ve been early adopters on that stage of the conversation, but as far as taking that information that we’ve been collecting, if you go into my dad’s office, he’s got notebooks and binders full of maps, all of this information, but now we’ll be able to use the data behind that information. So, where I see it going is just the ability to collect, analyze more of this machine data and information, have it stored in one location and then utilize the power of computers and software to, then, look at it in different ways so we can make decisions going forward.
SHAY FOULK: I think how you phrase that is a great segue into the next question that I have. I know some of what you deal with, with Premier Crop Systems, is looking at yield efficiency and how are we taking these variables and making really good decisions with it? So, Dan, I was wondering if you can kind of talk on some more specific things that Premier Crop offers to the farm operations that they’re working with. What does that look like today if someone was interested in finding out more about what you all do?
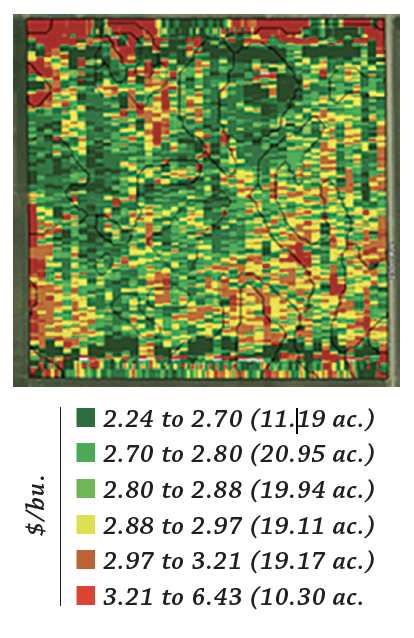
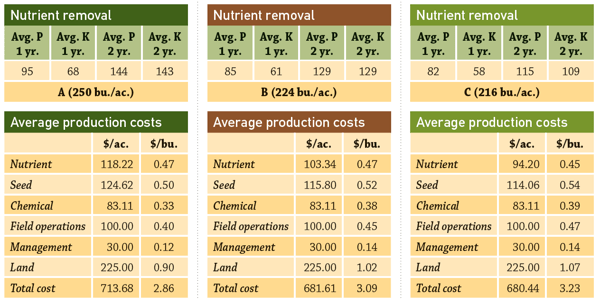
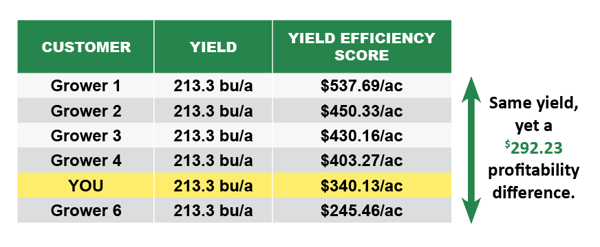
DAN FRIEBERG: Gladly. Shay, a lot of times, we use the phrase “everything agronomic is economic.” We’re all about tying the economics to the agronomics, which just means when we’re adjusting nutrient rates and plant seeding rates and decisions about what we spend in different parts of the field, we’re tying that out at the end of the year. So, we’re capturing that spatially. That cost is tied to the file. If we recommend and encourage you to plant more seeds in what we think is the best part of the field, we’re capturing that additional seed cost as an input cost. We can map it all the way to breakeven cost per bushel, and that would include land and management costs, but we describe yield efficiency as return to land and management at a benchmark selling price. The user interface lets the grower set their own selling price, so it’s calculating revenue minus what you invested in nutrients, crop protection, seed and field operations. Shay, we wanted a way to take land cost and management cost out of the benchmarking nature of it. We found that land cost can really be a real distortion when you’re trying to benchmark across operations. It’s really that same message. If we adjust inputs, we’re tracking the cost either up or down. So, we’re able, at the end of the year, to show whether that was the right decision or not.
SHAY FOULK: I was talking with a really good operation here in western Illinois, about 30 minutes before we were recording this podcast here. He made the comment that you kind of have to have three to four years of good information to make decisions off of it. And, of course, there’s low hanging fruit. Year one, you’re going to see some things that are pointed out: variable rates, quickly identify issues, particularly when it comes to soil sampling or plant tissue sampling, and learn more about your operation. You use the term benchmark there, and, with some of what we do, we’re very careful with benchmarking from a standpoint of no two operations are the same. But I think what, sometimes, people get confused with is benchmarking doesn’t have to be against other farm operations. Benchmarking against your own operation, and, like you said, that land cost can throw such a wrench in understanding how that ties into an overall system and what management decisions you can be making out of that. But I’m sure that information is extremely powerful once you have two, three, four years worth of information at your own benchmark and then making decisions for your operation moving forward. Do you have any comments on that?
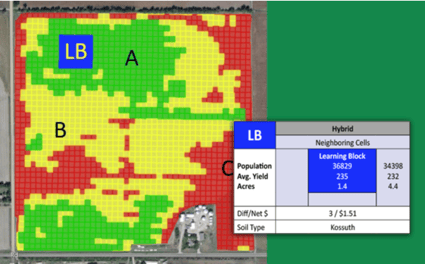
DAN FRIEBERG: I think, for me, the internal benchmark, like you say, is by far the most powerful. Amazingly, the growers love to benchmark against each other. Sometimes, I don’t understand why, but they love to be able to see beyond their own operation. So, whenever they look beyond their own operation, it’s anonymous, and they don’t know who they’re benchmarking against, and it can be extremely local or regional or a fairly good-sized group. So, benchmarking, growers love that piece of it, and they love the economic piece too. Personally, I think the most powerful is within your own operation, just field by field and then drilling down within a field by management zones. Shay, the one thing I would tell you is we’ve come up with a way to start making decisions even quicker. In 2005, we started putting check blocks inside prescriptions, and we trademark that as learning blocks. A learning block is just a comparison area. It’s like introducing an experiment into the field, and we’ve just automated the process. That’s kind of what software is really good at, is automating processes. But what it does is it lets you, in a single year, it lets you go to school in areas of the field. It’s really, really popular. If I suggested you plant 39,000 in the best part of the field, you’d have anxiety about whether that was too much or not, or whether it was worth the seed investment. But you’d try an acre. You would try an acre of 39,000 in a heartbeat just to see if it worked or see if it paid. So, learning blocks, now we’ve added more to that where you can do replicated trials. You can do multiple rates and have it be replicated, but it’s really opened the door to how do I get there quicker? How do I get on that journey of making decisions and getting this constant feedback? Every year is different. So, what you said a little bit ago is exactly right. Three or four years of data is way better than one year, but you can get started really quick. We’ve had people start where, like on variable-rate soybeans, they were so unsure of what to do that they just seeded the field at the normal rate, and they put a bunch of learning blocks in just to experiment with different rates.
SHAY FOULK: That’s great. One thing I want to go back to on the benchmarking, too, is a reason why a lot of farm operations that we work with like that exterior benchmarking. I’m not saying benchmarking is bad, so I don’t want that to be misconstrued here. But the reason they like that additional benchmarking is, sometimes, as farmers, we are the CEOs and the shareholders and the managers and the laborers all in one. Not every operation is a collaborative opportunity amongst different farmers. Not everybody has a community infrastructure where they can ask questions and look at economics in comparison, or maybe they don’t even have a family member to rely on, anywhere from first-generation farmers to someone that has just had to take on a lot of responsibility. So, I can see that benchmarking being a very valuable tool and then taking that information, like you said, with these learning blocks and applying that as quickly as possible. Brenton and I were talking here offline. One of the challenges with the learning process with some of this data is when it gets to variety or hybrid-specific crop analysis because in the industry, I mean, three to five years is about the lifetime that we’re seeing in these, and you can’t always make good decisions. About the time you learn what a hybrid does or how it responds, aside from the information that you’re getting from the seed companies, right when you get comfortable with it, there’s something else new out. And you have to take advantage of that because of the genetics and because of the advancements that we’re seeing in chemistry and herbicide resistance and things like that. So, I guess, Brenton, can you talk about that a little bit from a farmer perspective? It sounds like there are other things that we can quickly learn. Then, as we learn these products, the variety and hybrid-specific products, we can continue to make good decisions off of that, correct?
BRENTON ROSSMAN: Yeah, and that’s one thing. A passion of mine is on farm trialing and learning as much as I can, trying to put data into practice on our own farm to make the next step faster with a hybrid in year two or year three if this was its first year in season. What can we learn about all the different agronomic situations or scenarios on our own farm? How do hybrids perform differently? Lighter ground, heavier ground. High soil test P and K versus low soil test areas. We’ve done a lot of population trials on our farm, and it’s interesting. Definitely not bashing seed companies or anything, but we’ve done trials where we plant a certain hybrid at 35,000. That may be the suggested rate. On a certain soil type in a certain environment on my own fields, we see the highest return at 31,000 seeds per acre, so a lower seeding rate. Just having the ability to do some of this testing on our own farm, learning about the local environment, I’m going to trust the data from my own farm and use that for making decisions going forward.
SHAY FOULK: Well, and Dan, you said it really well at the beginning of this podcast. You have variability within your field boundaries. Whether it’s a 10-acre field, a 4,400-acre field, it doesn’t matter what size it is. There’s variability, and farmers know how to manage that instinctively, especially as you get time and experience in there. But if we can take that information from learning blocks or farm management zones and make better decisions off of it, hopefully we can learn quicker, and hopefully we can save money. Are you guys generating profit maps at this point?
DAN FRIEBERG: We do. Right now, it’s breakeven cost per bushel.
SHAY FOULK: Okay.
DAN FRIEBERG: So, we kind of focus that way, and it goes back to that we want to deliver the map the second yield file hits versus when the crop is marketed. A lot of growers sell over a 12-month period, so they don’t actually know their selling price, a lot of times, until months after harvest.
SHAY FOULK: That’s where the marketing decisions can be key, though, on knowing that cost of production and having it dialed in. Of course, that’s what we spend a lot of time working with growers on, and Chris and I will be the first ones to tell anybody out there. We run a system called Profit Manager, and you don’t have to use Profit Manager. You can use university systems. You can use any number of programs that are out there, but knowing that cost of production, and then how it ties back into the whole operation, is key and, I think, looking at it at a breakeven cost. If I know, as a farmer, instinctively, what my cost of production is, if I have that dialed into the penny, for me, let’s say it’s $3.72 or whatever it is on corn. If I’m looking at an area of the field that’s saying, hey, your breakeven is $5.43 here, that’s pretty eye-opening because we market in bushels. We’re not marketing off of dollars revenue per acre most of the time. Some operations do it that way, and they are successful at that, but it can be a pretty easy way to look at that. So, I think that’s interesting from the profit mapping perspective. How long have you been doing that?
DAN FRIEBERG: We actually started doing that in the very beginning. Almost killed the company in 1999 by doing it because what we ran into when we rolled it out is, first of all, back then, there was a lot of disorganization among growers. So, you would ask a grower for the cost information, and they would hand you a folder full of seed invoices and say, here, you sort it out. Back then, there were just a lot of growers who weren’t super organized. We’ve transitioned a lot in the last 20 years. But the second thing, Shay, is it really ratchets up the trust level between the grower. When you’re starting to track, when you really are getting to breakeven cost per bushel, that’s the most private information. If you put your actual land and management costs into it, too, that’s really private information. It’s the P and L for the field, so it’s super private. We kind of walked our way into it. Now, a lot of times, people start out, and it’s a faster transition now than it was back then. But they kind of have to get confidence before they’re really willing to share every detail about their operations.
SHAY FOULK: Yeah, and I understand that. I mean, farmers have a certain level of independence that they like, and there’s a reason, sometimes, that they’re in the industry because they’re their own boss. They can make the decisions. They can choose who they share the information with. So many operations we’ve seen have taken the understanding of, maybe, I can’t do all of this as effectively as someone else can by helping me. I talk with people all the time on that. When it comes to the reservation of sharing numbers, folks like us with the consulting side, or you all with the data management, we don’t care personally what John Farmer’s numbers are in north central Iowa or southwest Indiana. I mean, we don’t have the capacity to do anything with that information nor would we want to. We keep that wholly private, and having conversations with you all offline, too, I think, is one of the reasons I wanted to conduct this podcast. It’s just understanding that anytime you can get linked in with a company that really, truly values what the farmer is looking for and providing the value in that relationship and ensuring that they have that privacy and that the numbers aren’t going to be shared, and you’re just here as a provider to help them grow, that’s an excellent business model. I really appreciate it from that perspective. Go ahead, Dan.
DAN FRIEBERG: Shay, when you were talking about the high-cost areas of fields, you were talking about breakeven cost per bushel, and then you said, but what if I have an area that’s $5.42 or whatever. That happens. That’s real. We typically don’t tell any grower that we’re going to save them money because, a lot of times, if we save money on one part of the field, we invest it in another part of the field. But there are parts of fields where not investing as much is the only way you can lower your breakeven cost per bushel. You just can’t continue to invest the same in those parts of the field. You still have to farm them, but, for us, it’s all about making sure that the investment in crop protection and nutrients and seed is right for that area of the field. Sometimes, those are the best success stories, just learning to manage your investment in those poor-producing areas. Again, on a per-acre basis, you’re going to spend that money on the best part, but investing less in the worst part of the field, sometimes, is the only way to lower your breakeven.
SHAY FOULK: Brenton, I’m going to pick on you for a couple of minutes here. Dan, having tons, decades of experience here and starting the company, for you, with the — and I’m not saying Dan doesn’t — but having the real boots on the ground and talking with farmers all the time and having these conversations, what would you say makes Premier Crop Systems different from others in the industry that are doing some of this? What do you think the future of this type of business is? How do you see it continuing to provide value to farmers?
BRENTON ROSSMAN: I think the first thing that partners I work with, or growers I come into contact with, is they appreciate our independence as a company not tied to any input sales. We sell our service and our solutions. So, that’s important to me, and I think that’s important to a lot of our customers, as well, and also having a system that is not a canned output. Output from our system changes based on the grower’s goals. Advisors have the ability to customize their delivery, maybe, as Farmer John, for example, has a real interest in dialing in his fertility rates and maximizing his efficiency with that aspect of his operation. But Farmer Tom down the road is much more interested in the seed side of things, so just the ability to have a holistic solution that is completely customizable. I just think the business model, or that mentality, going forward will just continue to have success as the farmer of the future continues to evolve, and the younger generation, like myself, becomes more involved and wants to make decisions from data, has questions and really wants to dive into this information.
SHAY FOULK: One thing I would add to that is, you said it there in a little bit of a different way, but even though we’re moving towards making better management decisions, it doesn’t make things less complex necessarily. There are more and more high-management situations and high-management decisions to push the yield or to push the yield efficiency in some cases, too. I think, as we start experimenting and working with more of these things, whether you’re putting liquid in your planter, or you’re having a multipass nitrogen system, or you’re trying any number of biological products or a lot of the great programs that are out there right now, I think it gets even more important at that level of managing that information because, not only on a cost of production side, but from an information overload side. Is what I’m doing really working? Is what I’m doing really having the yield efficiency outlook that I want and providing the revenue back based on the time, effort, money in management that I’m putting into it? So, I think, as we gain the complexity in these operations, you have to have some sort of data management system that reports back to you or that you can take those numbers and do something with it because it has to be actionable. Dan, I think you hit on this early on. We’ve had this yield mapping information for 20 years or more at this point. We’ve had variable-rate planting information, and yet, today, I still get questions probably once a week on, well, where are your soybean planting rates at? Or what are other farm operations doing for nitrogen and fertility management? There’s nothing wrong with asking those questions, but in order to take that next step in the farming operation, we have to take actionable information and do something with it. So, Dan, I don’t know if you have any other comments on that.
DAN FRIEBERG: No, just everything you said is right on. It’s also like what you were talking about. Before the podcast, I was asking you about your experience with cover crops because that’s a big one we get. There are a lot of growers who have never done anything with cover crops, so they’re wanting insights or wanting to know the economics, and we’re constantly trying to figure out how we help prove it out quicker. That’s exactly why I was asking for your experience, because there’s just a lot of attention right now on cover crops.
SHAY FOULK: Absolutely. Is there anything that I’m not asking or anything that you’d want the listeners of this podcast to keep in mind as we move forward? The podcast is distributed all over the United States and Canada, farm operations of any shape and size. What message would you want to leave the listeners of this podcast with, as we wrap up here?
DAN FRIEBERG: Agronomy is local. What matters in one part of the country sure doesn’t in another part of the country, or it’s different. So, nitrogen management would be a great example, where what strategy you use really changes based on where you are. There are major east-west differences. There are big north-south differences. That agronomy local message is really a key. When you were talking about benchmarking, and we were talking about sharing data, it’s one of the reasons growers love these aggregated data sets that we talk about, where you’re anonymously comparing to other operations. It lets you see hybrids and varieties that you didn’t get to plant. You probably had 30 or 40 elite numbers pitched to you, and you might’ve planted 10 of them. But at the end of the year, you’d like to know how the other 30 that you passed on did. It’s just all part of that learning faster. How does everybody learn faster? Having a data platform to help growers learn faster is just a big piece of where our hearts are at and where we believe our future’s at.
SHAY FOULK: From your point there, Dan, too, I want to bring in a point from Brenton and I’s conversation here a week or week and a half ago, whenever it was, of that independence. You’re not tied to a seed company. You’re not tied to a chemical company. So, regardless of which of those top 40 hybrids did best or varieties, or maybe it wasn’t even one of those that was pitched to you that just had a fantastic year, being able to learn from that information and seeing it and having it available and understanding how it might fit into your management zones on the farm operation. It can make some of those decisions a little bit easier. The other thing that’s really unique about this is, not only with it being non-identifiable back to a particular operation or not being able to see anybody’s particular numbers, is when it comes to managing those decisions. If you have 40 products in front of you, it can be really overwhelming, but being able to take that and make those decisions faster, I really appreciate that perspective. I’m going to turn to you, Brenton, on this. If someone’s listening to this and wants to learn more about Premier Crop Systems, how do they get a hold of you guys? How do they ask some of these key questions and see what your services look like?
BRENTON ROSSMAN: I’d say the best way to get a hold of us would be to just visit our website. From the website premiercrop.com, there’ll be a link on there for contacting us. Then, we’ll get you in touch with the right person.
SHAY FOULK: Absolutely. Dan Frieberg and Brenton Rossman, I really appreciate the time today, guys. Hopefully, those listening to the podcast got some value out of this, whether you choose to talk to someone at Premier Crop Systems, or just taking the information that you’ve learned here and maybe thinking about it as a different way. We have an exciting, new 2021 season ahead of us, and we all get opportunities to make good decisions. And the farmer is the eternal optimist. So, getting linked in with some of these people that can help your operation and take it to the next level, I think, is so important to hear more about those of you in the industry who are doing some of these things. So, Dan and Brenton, I really appreciate the time.
DAN FRIEBERG: Thank you, great to be with you.
SHAY FOULK: Thanks to Renee and Molly for getting us linked in. Really glad that we can do this. And, most importantly, thank you to everyone on the Ag View Pitch for tuning into another podcast, and we will catch you next time.
RENEE HANSEN: Thanks for listening to the Premier Podcast, where everything agronomic is economic. Please subscribe, rate and review this podcast, so we can continue to provide the best precision ag and analytic results for you. And to learn more about Premier Crop, visit our blog at premiercrop.com.
