
Several years ago, I had customers tell me we could grow our company a lot faster if we had something like their planter monitor that flashed the dollars being lost from poor singulation. We needed something visual on a display, changing as growers moved across their fields to get their attention. Something cool.
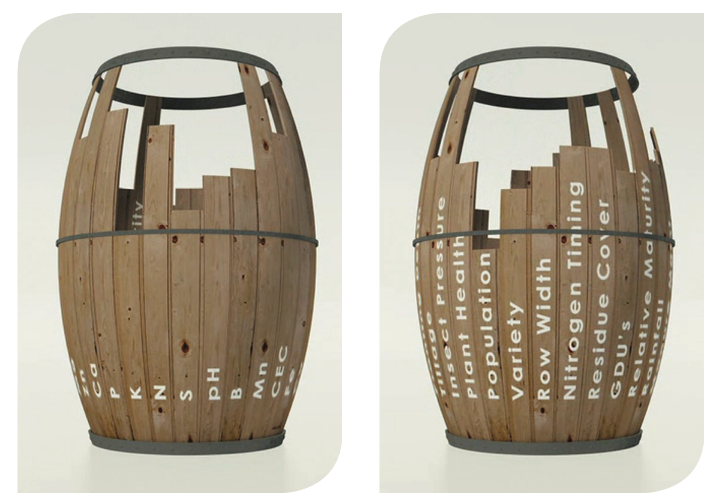
Back in the days of overhead projectors, when I started my career, I remember seeing a slide of a rain barrel with each stave labeled with a different nutrient and at various heights. I later learned that the rain barrel illustration is centuries old, made famous as Liebig’s law of minimum: Plant growth is controlled not by the total resources available, but by the scarcest resource or limiting factor. The message of the rain barrel is that over-applying one nutrient won’t pay if another nutrient is more yield-limiting. For example, applying the latest micronutrient blend isn’t likely to do you any good if your phosphorus and potassium levels are low. The rain barrel was a great illustration of the need for balanced fertility.
In the real world, the crop production rain barrel has many other staves that can be just as yield-limiting as nutrients: hybrid and variety selection, insect control, seeding rate, dis- ease management, tillage, compaction, crop rotation, planting date, soil type, drainage, and the list goes on and on. Identifying and managing what is profit- and yield-limiting in parts of each field is the ultimate goal of analyzing your data.
Your inputs aren’t just nutrient, seed and crop protection products. Your input choices extend to your equipment choices, and data recorded from your equipment can represent additional staves in your crop production rain barrel. Singulation, downforce and downforce margin are additional data layers that companies like Premier Crop now analyze, along with “normal” data layers collected with your planter, like seeding rate and logged hybrid or variety. But what does your yield data say about the relationship between singulation and yield?
How do you explain what seems profoundly obvious in the planter cab as the monitor flashes negative dollar amounts, when it’s no longer apparent at harvest when comparing that planting data to your yield results? One obvious answer is that your planter data is more refined than yield data. Your planter monitor can tell you how each row of your 24-row planter is performing, but your combine head aggregates 12 rows into one yield measurement at the yield monitor.
But there may be other reasons why ideal singulation doesn’t always seem to be driving your yield results. As important as getting picket-fence-perfect stands is, in many situations, singulation may not be the variable that is most yield-limiting — the lowest stave in that field’s or part of a field’s rain barrel.
I’m a believer that agronomic common sense and real-world observations tell us that avoid- ing doubles and poor seed spac- ing is critical to higher yields. But they are only a few staves in a very complex agronomic rain barrel, and the dollar signs flashing on the monitor screen are only real if proper seed placement is your lowest stave. Searching for profit-limiting variables will lead you to collect and analyze as many layers as possible, and to create “deep” data sets for each of your fields. Anything less would be to pre- tend that what is truly complex, is not.
Originally published in Corn and Soybean Digest.