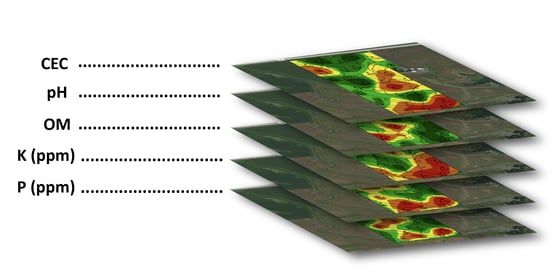
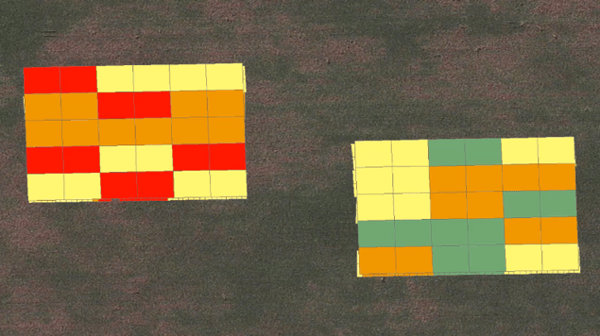
Our approach to nutrient planning is based on the fact that we want to allow our advisors, partners, and growers to get ahead when it comes to planning for the next crop season. Some advisors are having this conversation early, even before growers start combining in the fall. As we dial our focus on helping growers create a plan before the growing season begins, we look at several things. Using a spatial soil sample as one of the foundation pieces is a large part of what we do. A spatial soil sample could be a grid sample where the field is divided into smaller sizes, giving you a number of samples within a field, two-and-a-half-acre grids are common in most areas. In other areas where the field is divided into zones, zone sampling can be driven by soils, historic imagery, or EC conductivity. Instead of capturing one sample for an entire field, they’re capturing more intense, site-specific samples. Layering all these samples into one computerized system and letting data science derive the factors for you helps, rather than trying to figure it out on your own in those frustrating excel sheets.

We understand that with all nutrients, a combination of soil-supplied nutrients and the soil foundation feeds the crop. This means there are nutrients in the soil that are released to balance what the soil supplies to the crop versus what a farmer applies with manure or commercial fertilizer. But we don’t stop with only the soil sample and management zones. Another piece of what we do is use yield files to capture the actual nutrient removal rates. A farmer is capturing yield data every second they go across the field and we are able to calculate the phosphorus and potassium removal off the yield file. Not many other companies do this, because it can be difficult to export the yield file from the growers system. We believe this is the differentiating factor that leads to better yield efficiency and maximizing profits.
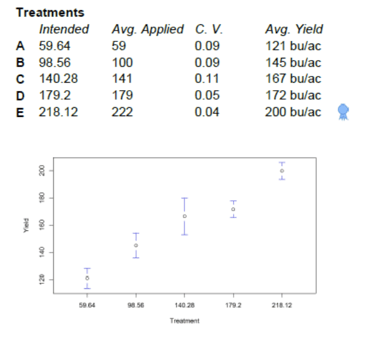
We then divide fields by productivity level because we believe we’re able to define some areas of the field that respond to more nutrients. We generally have a different equation for each productivity area within a field. Other companies will go to the grower with three different equations priced out with nutrients and have the grower choose just one. We believe this shouldn’t be a “one size fits all” approach, though. A grower shouldn’t have to choose aggressive versus conservative for the whole field. Having more complex equations is a big part of what we do, and this is why we believe you can treat parts of the field aggressively and parts of the field more conservatively. It makes sense to us that some areas of the field just respond more to nutrients than other areas of the field, and we want to take advantage of that. Again, this is another example of how we use our data science to calculate all the layers of data to create a customized prescription for your field. We are also able to test right rate technology using our Enhanced Learning Blocks®, using statical confidence to prove the best rates in the field.

When you think about the rate of nutrients that should be applied, how do you make your final decision? You know that agronomy is local, meaning it is important when giving site-specific recommendations, to pay attention to every field, specifically each different productivity area within each field. This makes it important to create unique prescriptions by putting trials in growers’ fields. It really doesn’t get more local than using your own fields. These trials are scientific trials within each part of each grower’s fields, using analytics and data science to inform our recommendations. Each trial has replications of different rates in different areas of a grower’s field to statically understand where in a field the best rates win.
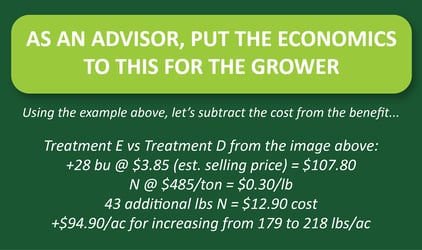
The goal is to produce yields efficiently and profit as much as possible. When we go into areas where a grower hasn’t been soil sampling or doing variable rate nutrient applications, we typically find that the lowest fertility areas are the highest yielding. These low fertility areas come to be because the high-yield areas have mined down the nutrients from the field being treated uniformly. Growers will tell us, “I put the same blend on every acre, and I’ve done it for the last 10 years.” However, the problem is that they haven’t been removing nutrients as uniformly as they’ve been applying them. Those consistently high-yield areas have pulled down nutrients, and the consistently low-yield areas have allowed nutrients to build up in the soil. We capture that when soil sampling, which can be a foundational piece. We also find the areas that are consistently higher yielding are hard to keep up with. The more that certain nutrients are applied, the better the yield. We never try to even out the field and make it one color on a soil test map. The question we ask ourselves is, “How do we generate more dollar return for every dollar we invest within those areas of the field?” If we never catch up soil test-wise, it means we keep producing better and better yields as efficiently as possible. It’s not uncommon for us to see 80 to 100 dollar-an-acre swings by single nutrients.


When growers realize there are that many dollars in play, it leads them to want to do better. We’re constantly surprised at how much yield response we’re seeing by being ultra-aggressive and applying a high rate. We’re just beginning to understand and to tap into what’s possible.
If you’re interested in taking a step towards highly analytical planning for the crop year, contact us today. For more information about nutrient planning, check out our precision ag conversations on the Premier Podcast.
