
Fourteen Years’ Data Guide Darle Elkin’s Decisions

Darle Elkin used to man Air Force nuclear weapon guidance systems, so it’s probably not surprising that his tractor cab looks like Houston Mission Control.
Since his days of launching missiles from bunkers in the 1970s, he’s replaced his sextant and celestial navigation with GPS and databases. On his Webster City, IA, farm, his 14 years of field data are a treasure trove of cause and effect.
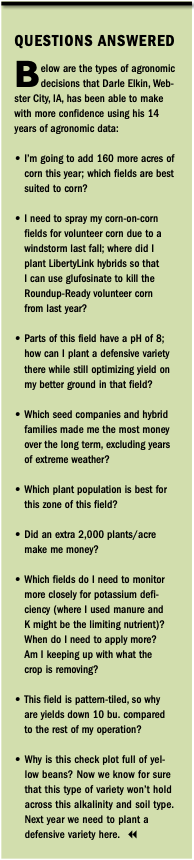
His agronomic records drive decisions such as corn hybrid selection, fertility programs, variable-rate plant populations, crop rotation, nitrogen stabilizer use, and where and when to use corn fungicides. He uses his data to select offensive and defensive soybean varieties, and plants each bean in the area of the field that it fits best.
Variable-rate planting as well as crop nutrient applications have been the norm on his farm for 5 years. Darle doesn’t like to make decisions based solely on intuition. “I have this data,” he says, “and I use it.
“Ben Rahe, our Premier Crop advisor, and I define A,B,C management zones on our farm based on GPS yield data, soil type, drainage, fertility, organic matter – any of the factors we can measure that affect our profit potential,” Elkin says.
“The A zones are where we aggressively push plant populations, fertility and spend more money to make money. Our corn population there might be 36,00038,000/acre. The B zones are the current field average values. We might plant corn there at 34,000. By contrast, the
C zones are where we use inputs conservatively, not wasting money where there’s a drainage problem or sandier soils. We free up inputs to put on the A zones, and preserve the profits across all zones,” he says.
This approach of variable-rate inputs is like knowing how many people are coming to dinner, so that you prepare enough food. Elkin lives to experiment. His maps show him how variable-rate inputs and seeding rates affect his profits. This year he added nitrogen stabilizers as another variable in the mix. He uses a 1 to 2acre check within field zones to contrast his experimental seeding and fertility rates with “standard” practice.
“We use checks on almost all the fields, experimenting with populations from 28,000 to 40,000, and variable-rating the nitrogen,” he says.
All these variable-rate treatments make for a large number of map layers, each representing areas within fields with different soil characteristics, input treatments, seeding rates, hybrid placement and yield histories. “That’s where Premier Crop’s database helps me out,” Elkin adds. “Their system helps make studying my fields and using my information efficient.
“The first time that we put all these map overlays together, it was the ‘wow’ factor,” Elkin says.
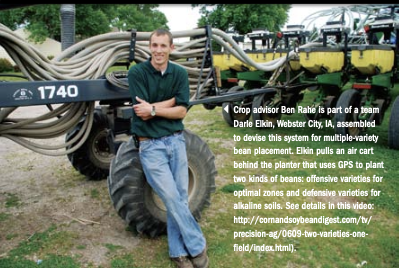
One experiment that’s attracted attention from the neighbors and ag journalists is his multiple soybean variety placement. He pulls an air cart behind his planter, enabling him to plant offensive varieties where conditions are favorable, and defensive varieties in tougher, high-pH soils.
“I have to be 5% ahead of everyone else to stay alive in today’s economic environment,” Elkin says. “Farming is no different than a Nascar race. We all have the same gas, tires, shock absorbers; it’s just how you combine and drive them that wins the race. We use our records to consistently finish among the top 10.”
Elkin’s yield and soil sampling maps date back to 1995. “With that amount of yield data, we can sort out the weather extremes and really bank on the rest of it,” Rahe says.
“The data reduces the number of guesses we have to make by informing our decisions,” Elkin says. “We may not always know why a given part of a field is off by 10 bu., but we can narrow the cause to just a few factors.”
Elkin can crosscheck and anonymously pool his farm results with his fellow Premier Crop Systems clients. Collectively, they represent 30,000 40,000 acres of local hybrid and agronomic data in a 60mile radius.
“Using their data, our growers can rate hybrids and varieties by profit in their fields,” says Dan Frieberg, Premier Crop Systems co-owner. “Just as dairy producers use DHIA records to benchmark each cow’s performance, our growers can base their decisions on real-world results.”
Originally published in Corn and Soybean Digest. Written by Susan Winsor.