Today we are talking about a grower’s experience with farm analytics and precision ag. We are joined by Aaron Seifert, Business Development Manager for Premier Crop Systems.
About Aaron: Aaron is a lifelong farm kid from Southern Minnesota. His family has livestock as well as a row crop operation. As a Business Development Manager for Premier Crop Systems, Aaron has the opportunity to help many different farming operations with precision ag. Aaron’s career history has been in the hardware side of precision ag, where he has worked with third-party hardware applications, and has now shifted to the software side.
In this episode we cover:
- Misconceptions about Data Analytics
- Cutting Inputs With Tight Margins
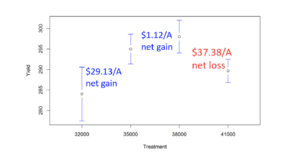
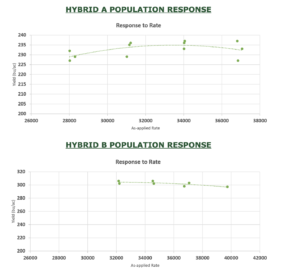
- Analyzing Good and Bad Spots in the Field
- The Evolution of Data and Farm Analytics over the Last 100 years
- Improving Yields Using Historical Data
- How Premier Crop Differentiates Through Advising
If you are enjoying the show, tweet us using #PremierPodcast.
Agriculture Through the Years
My grandpa turns 91 years old this spring. He has farmed for 75 years, and retired last fall. I can’t help but think of all the changes he’s seen in agriculture during his lifetime. The changes from equipment to genetics, chemistry, and technology seem almost endless. Though he’s made numerous advancements in his operation, change didn’t always come easily. When I was selling hardware, I thought auto-steer would be a great addition for him. I think his exact words were “If you can’t drive straight, you shouldn’t be farming!” He eventually adapted, but it’s not easy to let go of the wheel when you’ve driven for that many years. He started farming with horses, and now he runs a 500 horsepower QuadTrac steered by satellites.
Since the beginning of agriculture, farmers have always had to be analytical. It is impossible to survive in any industry without gaining an understanding of inputs and outputs. This usually involves some visual observations, measurements, and then potential adjustments. The amount of data we create as we farm, the speed at which we can do it, and the relationships and variables we can account for are some of the biggest advancements we’ve made since my grandpa started farming.
How Do We Use Farm Analytics?
All the different pieces of data we gather and create are independently important. They give us an idea of what may be going on in any given part of a field. However, it’s not until you bring all those layers together and let the technology crunch through it that you see the value. The value is in the relationships.
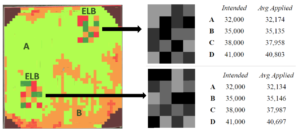
At Premier Crop, we go further than just analyze where the good spots and the bad spots are in the fields. We use soil samples, as-applied data, farming practices, weather, and much more to see exactly what the yield-limiting and profit-limiting factors are in each of those areas. By assigning cost and distributing it spatially, we see the economic impact of each input decision. We know variability exists, and we believe that all yield is not created equal. So, we understand that in different parts of the field, it takes different things to maximize a grower’s investment. Producing yield efficiently is our overall goal. Our system is designed to help growers make every input dollar matter more.
By utilizing Premier Crop, growers can use a software system to better understand what’s going on in a field. Growers also have the opportunity to work with an agronomic advisor. Our advisors work with growers to determine the areas where they should be aggressive. They also help manage risk when making agronomic and economic decisions. Ultimately, nobody knows a particular field better than the grower does. An algorithm doesn’t have all the answers. Being able to have that conversation and help enhance the software through shared learning with the grower is key.
Tying Agronomics to Economics
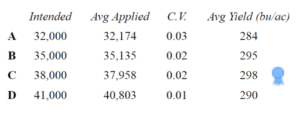
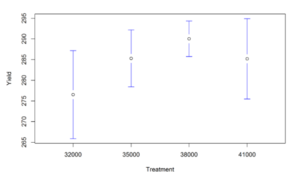
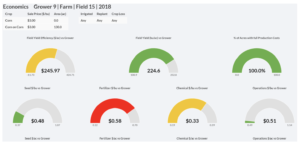
In the graph below, you can see a grower’s yield and Yield Efficiency in a particular field compared to his other corn fields. You are also able to see how each individual input decision contributed to the overall Yield Efficiency. Each area can be broken down further to better understand the impact.
The farm analytics are impressive, but sometimes there’s a false perception that the analytics are the only answer. In many cases, the farm analytics can lead to many questions such as:
- How can I take advantage of the best parts of each field?
- Can you help me manage risk in the poorer parts of my fields?
- What are some ways I can limit poor economic decision making?
Ultimately, if you’re not really looking through your data, you end up guessing. Sometimes you might be right, but more often than not, guessing isn’t going to get you any better returns. How many dollars do you leave on the table by guessing? The numbers we see are significant. Knowing the impact of each dollar based on your own data gives you the power to make better decisions, and take advantage of different market environments.
Using Data and Analytics to Make Decisions
What it really boils down to is: how are you using your data as you farm? How are you using the data to make more confident, profitable decisions? Tie dollars to agronomics and make sure you’re producing yield as efficiently as possible. You spend hundreds of dollars on input costs per acre. Wouldn’t you sleep better at night knowing you have the right product and right rate for each part of every field?
My grandpa was able to farm for all those years because he adapted to change, took calculated risks, and analyzed the results. The concepts are still true today even though the operations are larger and the technology is more advanced. The growers who continually look for ways to improve and who understand the economic impact of each decision will be the most successful and able to weather the storms and changes over the next 75 years.
______________________________________________________________________________________________
Free Resources:
- For more helpful tips and insight on all things data and agriculture, visit our blog at http://info.premiercrop.com/blog
- Curious about precision ag? Download our 5 Steps to Getting Started Guide: http://info.premiercrop.com/5-steps-guide
- Ready to cut through the bull? Download our No Bull Guide to Precision Ag: http://info.premiercrop.com/field-profitability-guide
- Podcast provided by Premier Crop Systems. Learn more about us at https://www.premiercrop.com
- View our blog post: http://info.premiercrop.com/blog/how-technology-has-changed-precision-ag-through-the-years