Making The Data Deliver

farmtofork-logo-reduced

Dan Frieberg, President of Premier Crop Systems, talks about data and breakeven cost per bushel on the Farm to Fork Podcast.

Listen Now

Host: A yield map will tell farmers what part of the field is performing well and what part is performing not so well. The temptation is to want to find out what is going on in the problem areas and fix them. But Dan Frieberg with Premier Crop Systems says that may not be the best decision economically.

Dan: We like to talk to growers about managing variability that exists within the field. We talk a lot about pushing the best part of the field a little harder and then maybe being a little more conservative with some of the lower production areas. Managing the growers input investment to get the higher return.

Host: Frieberg says growers can throw a lot of money and effort at low yielding areas of a field that may never provide the kind of return on investment they hope for.

Dan: Every decision that’s made has an economic consequence and we believe that high yields are important, but maybe more important is being able to deliver accurate breakeven cost per bushel. That’s where we take it, at the end of the day, that’s what growers are looking for. They want to know what the economic reason to do things differently.

THREE Ways to Determine Field Profitability Using Your Technology {Pt. 3}

This is a three part series focusing on ways to determine your field profitability using your technology. We will post the series over the course of two months. If you don’t want to wait, you can get the full series here.

__________________________________

In tough economic times, it is more imperative than ever to know your productivity and be able to evaluate the cost or benefit of your decisions. Our mission at Premier Crop is to make this easy for you and give you multiple ways to evaluate across your operation. I will walk you through the different methods of evaluation: cost/bu, variance reports, and learning blocks, along with why each is important.

The first measurement is the cost per bushel on a spatial level to give you a new look at each individual area of your field.

LEARNING BLOCKS

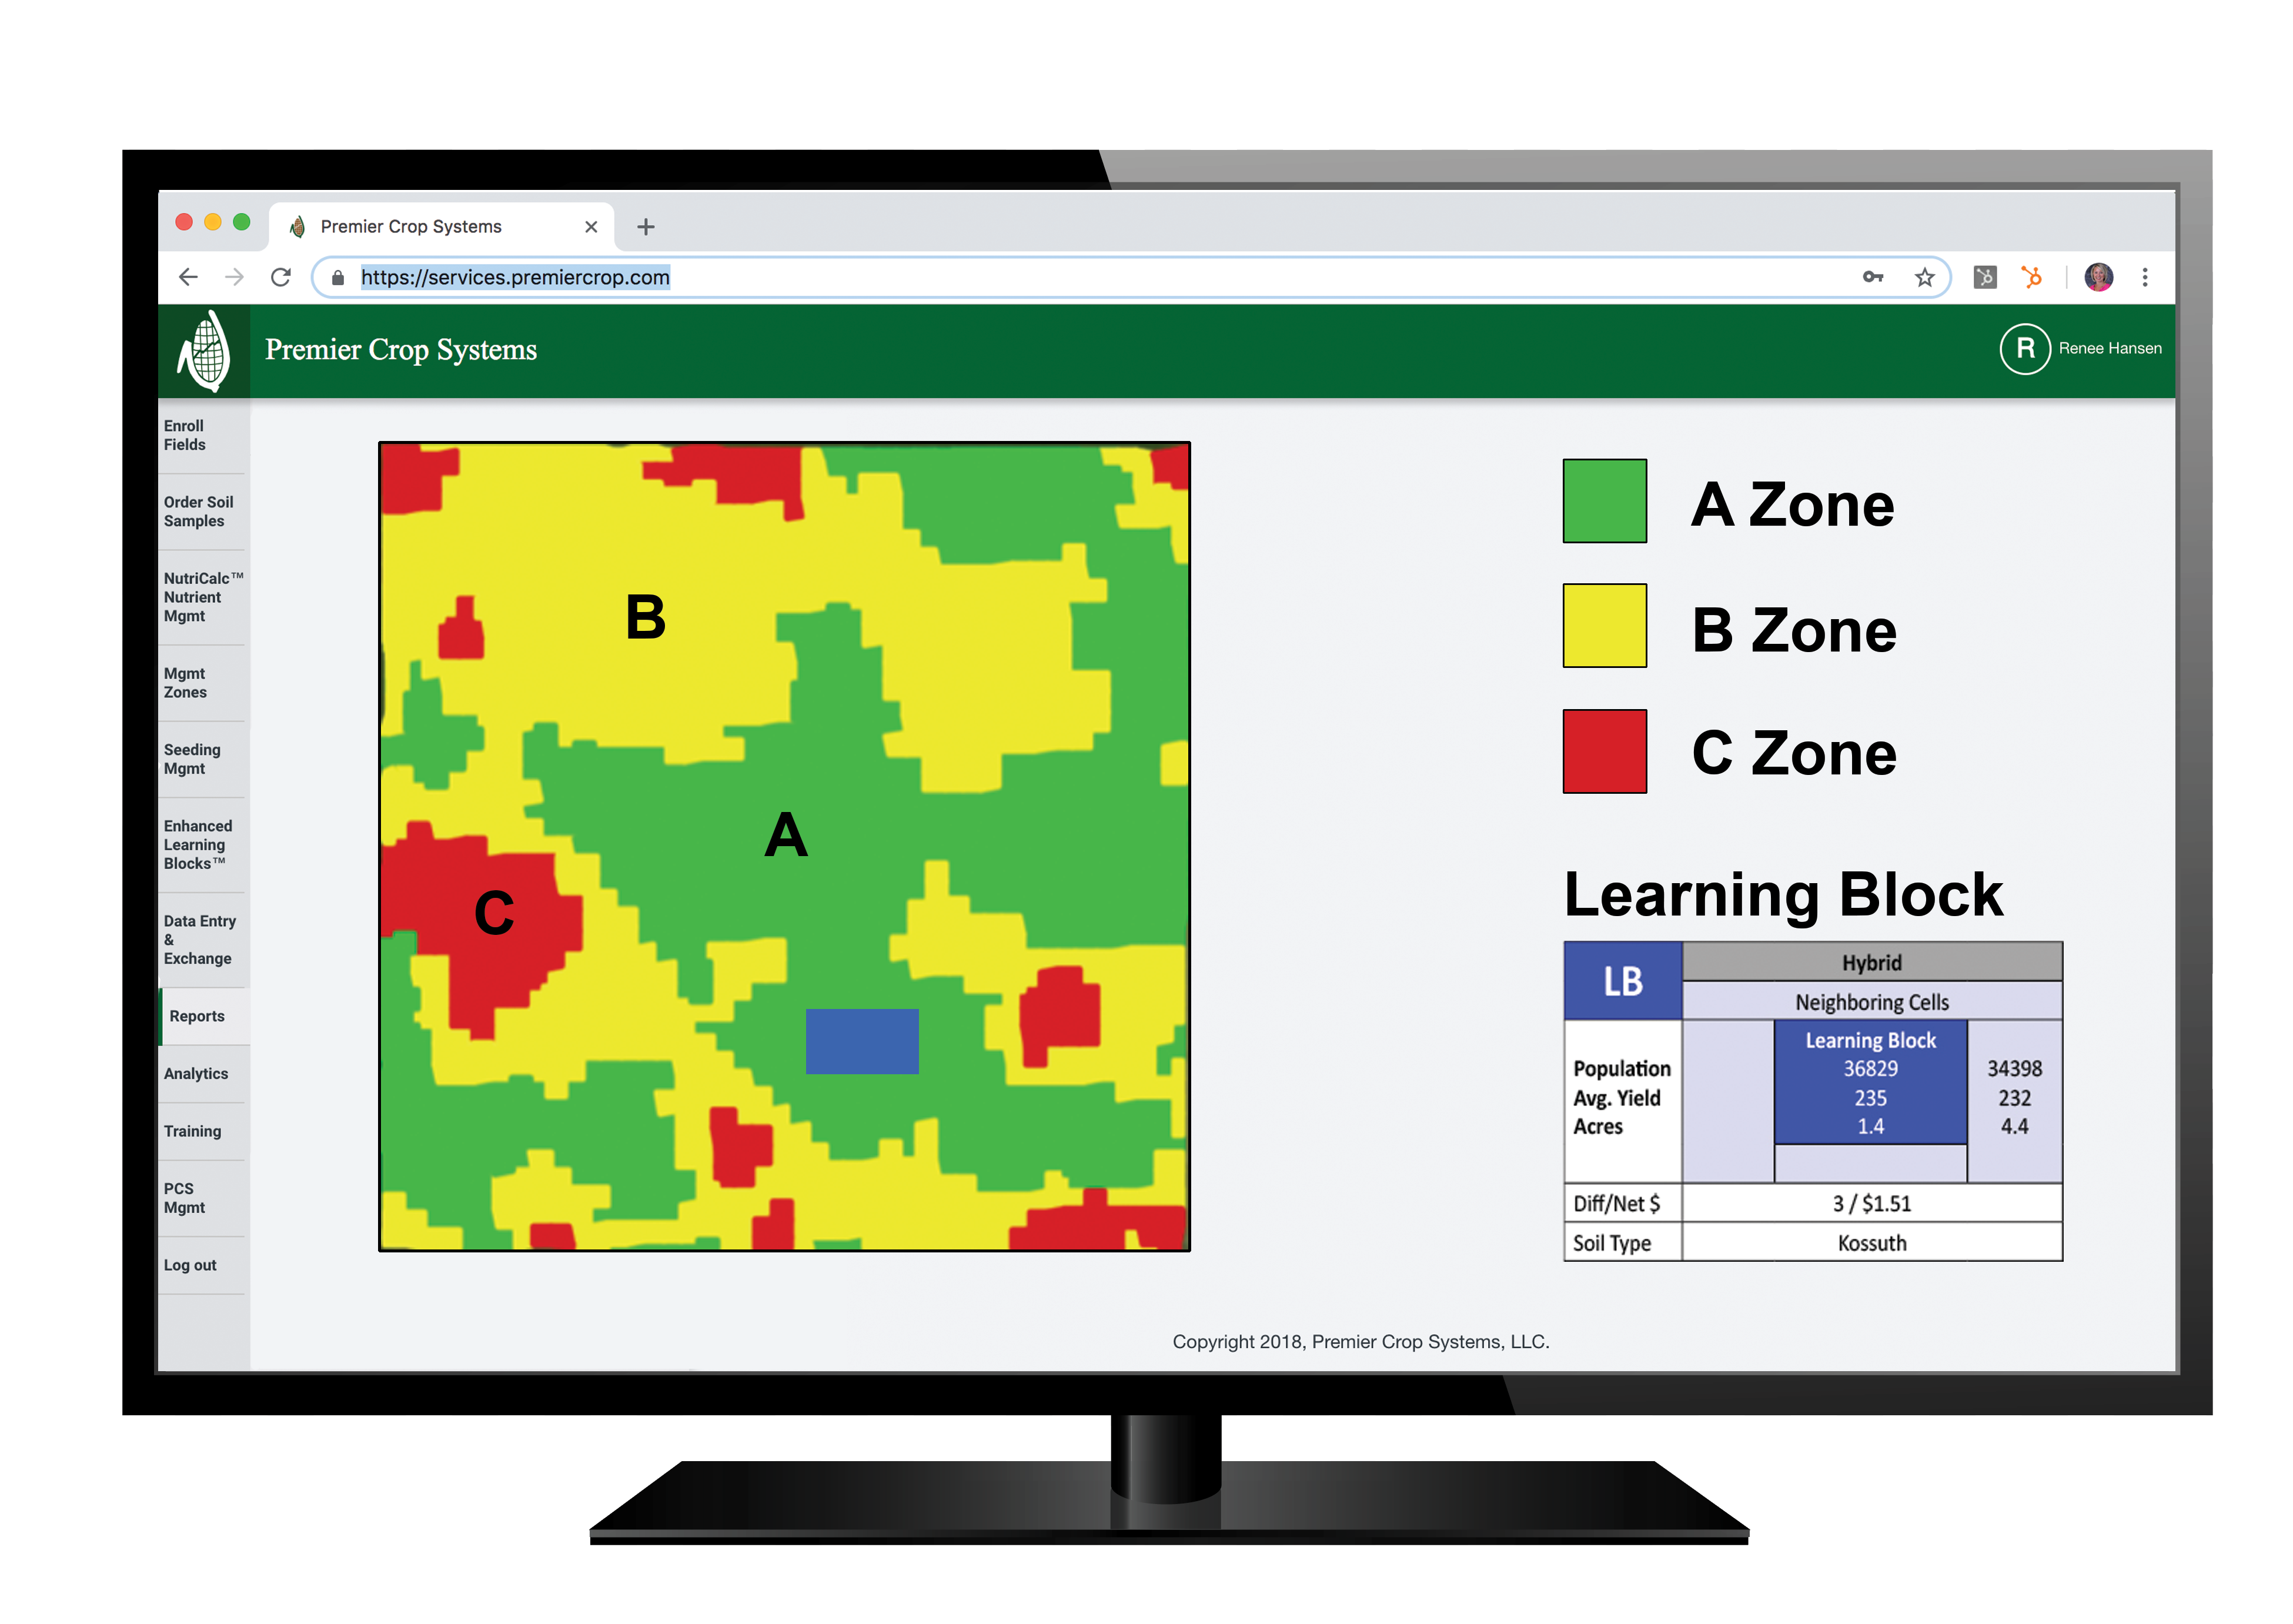
What is a Learning Block? Premier Crop has created a low-risk way to test and check variable rate seed populations, crop protection products and nutrient rates in one-to-three test acres, called Learning Blocks™. You have the ability to check if the optimal rate for that environment is higher or lower, in a low-risk way, built right into your prescription, using your technology.

After you have established management zones for your field, Learning Blocks prove whether a practice such as plant population or different nitrogen rates, are effective in that zone. Since Learning Blocks are one-to-three acre cells it’s a low risk way to prove and maximize efficiency.

premiercrop_learningblock_blog_THREEways

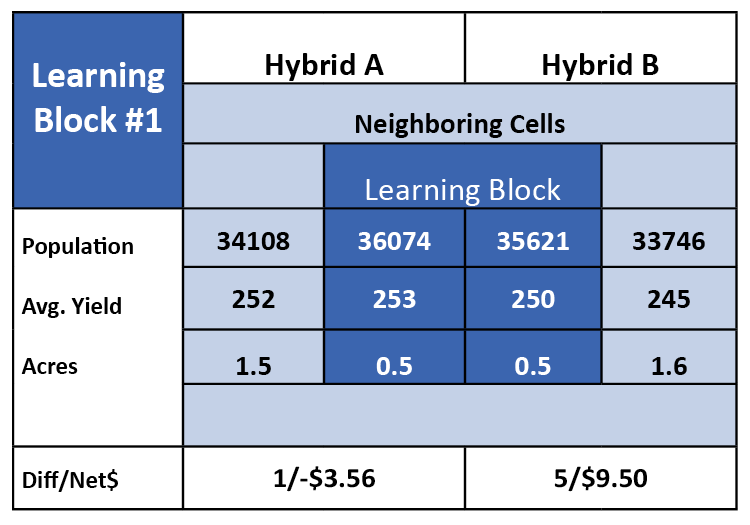
In the diagram above, this Learning Block was performed to test plant population. Did it pay? Yes and no. The Hybrid A did not have enough yield increase to offset increased seed costs. Hybrid B did have a yield increase to produce a positive ROI.

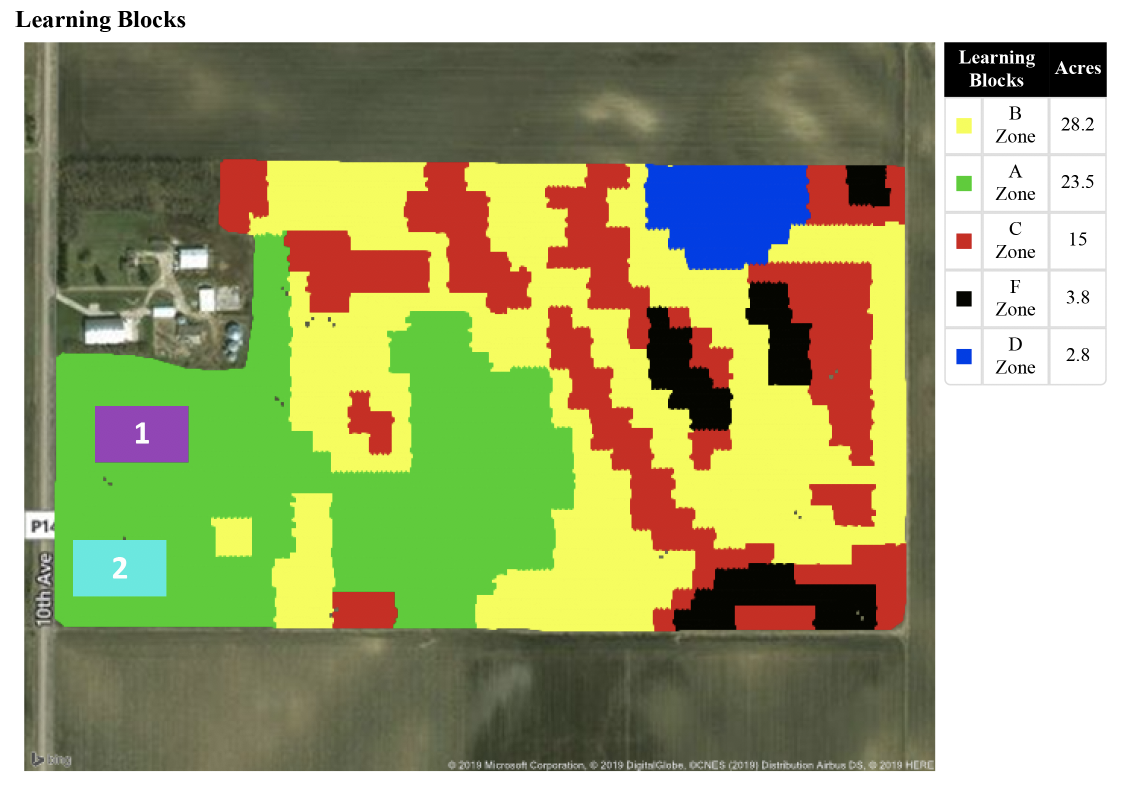
A great benefit to Learning Blocks is that you can place multiple Blocks in one field to test different management zones, soils, nutrients and more. This can ultimately help you make confident data decisions that will help you profit, all while using the technology you already have.

premiercroplearningblock

Get started, contact us to calculate your profitability and schedule a demo today.

Are you applying the right rates?

In 2005, Premier Crop trademarked a unique idea that has become a common practice with our customers. A trademark called Learning Blocks™. If you’ve conceded to the idea that your fields aren’t the same from fence line to fence line and you’re already managing your fields in zones, you’re ahead of the pack. But, are you checking your work? How do you confirm you are choosing the right rates for the zones in your variable rate planting or nutrient prescription?  Do you just trust that the prescription is right?

The concept of Learning Blocks was a way to test if the correct rates were chosen each zone, in a low-risk way. By placing small check blocks into an area that historically yields in a consistent manner, you can reliably check higher and lower rates against the rate you think is right.

premiercrop_learningblock_rightrates

For example, in a 30 acre area that has been your top yielding zone most years, you may choose to push corn populations to 37,000 seeds.  But, with nothing to compare against, how can you know that was right?  We’d recommend a high check at 40,000 seeds and a low check at 34,000 seeds within that same zone, only on 1-3 acres each.  Using the yield data and a few pieces of cost information, you can quickly understand the return on investment for those seeding decisions and the resulting yield impact they each had.

Now next year, you’ll have refined that planting population just a little more—and can do it again to keep checking your work.  At Premier Crop, we’re all about continually improving profitability, trusting the data to be our guide.

Learn more about Premier Crop’s trials here.

Produce (a lot) More with Less

I spend some of my best work days with growers – encouraging them to use their data to drive better agronomic decisions. Of course, I’m frequently also inviting them to become customers.

Tight economics for most corn and soybean growers has made selling anything more challenging. As tempting as it might be, I never suggest that data-driven decisions will lead to spending less on inputs. In fact, I believe the promise of spending less has hurt “precisions ag” adoption. Variable-rate lime applications might be the lone exception.

Rather than promote the input-savings message, for me, it’s all about investing more wisely within each field and across your operation. Everything you save in one part of a field will likely be spent in another. Every seed saved in the worst part of the farm will be invested in the best part.

The first step in using your data to drive efficiency requires a change in thinking. It requires that you stop pretending all fields are the same. Technology allows us to measure the differences that exist. And variable-rate technology allows us to treat each part of each field differently.

Is it working? Are precision ag tools really allowing us to be more efficient? Is the concept of producing more with less real?

premiercropblog_producemorewithless

Paul Fixen, senior vice president of the International Plant Nutrition Institute, recently summarized some encouraging evidence, and the answer is “yes.” Fixen writes that in the U.S. in the past 35 years, we have raised corn yields by 70 bushels per acres (70% increase). During the same time period, average nitrogen rates have only increased 6 pounds per acre (5% increase). This is a success story that needs to be told over and over again!

Fixen also cites precision ag’s role in increasing soil testing and notes that “nutrient use has never been as measurement-guided as it is today.”

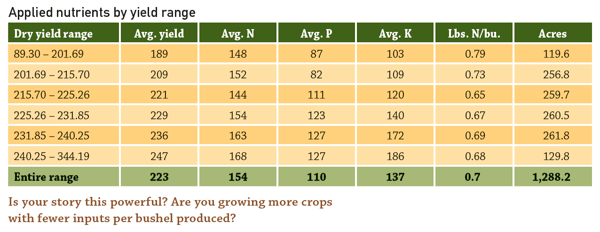
Premier Crop has many customers who focus on using all their layers of data to drive efficiency in all their corn and soybean production. The table above is an example of data from a grower’s first-year corn acres where the grower split-applied his N and focused on stretching every pound of N while maintaining high yields.

Results like these don’t happen by accident. Achieving higher yields while dramatically lowering pounds of applied N per bushel produced requires using variable-rate technology to execute an integrated and complex agronomy plan each year.

Remember the old days of 1.2 pounds of N per bushel of yield less credits for legumes? Those days are long gone for many of the best operations. We need to tell our story to others – family, friends, urban neighbors, legislators and public policy makers.

Learn more about crop management.

Intuition Doesn’t Match Data

I’m a big believer in the practice of split-applying nitrogen – specifically sidedress – applying a portion of the nitrogen after planting. Being able to apply part of the nitrogen closer to plant uptake always made sense to me because the nitrogen is less available for loss before that time. However, oftentimes it is difficult to find the advantage of sidedressing in the data.

It can drive me crazy having access to millions of acres of data and not have the data to confirm something I believe! Or worse yet, show the exact opposite! For example there have only been plenty of years when fall-applied nitrogen appeared to do as well, if not better, than spring- or split-applied.

Here are some of the lessons I’ve learned over the years. First, there can be “selectional bias” in the data. For example, growers select their heavier soils for fall applications for agronomic reasons – ability to hold ammonium nitrogen. Likewise, they might choose their lighter soils for side dressing. Simply comparing yield by nitrogen timing and lead to a wrong conclusion. Looking at nitrogen timing by soil type can be an obvious next step for correcting selectional bias.

A second reason that sidedressing might not show up in analysis as being superior in data analysis is due to the fact that nitrogen applications might not be the yield-limiting factor! If applied nitrogen is not what’s yield-limiting, then timing of application won’t likely matter or show up in data analysis. In much of the high organic matter portions of the U.S. Corn Belt, university researchers estimate that 50% to 70% of the nitrogen that feeds the plant is soil-supplied and not fertilizer-supplied. It’s no wonder there are years when the relationship between applied nitrogen – regardless of timing – and yield is insignificant.

yield limiting nitrogen applications

The last reason is the one I hate – it’s that I could just be wrong. When believing so strongly in a concept, it’s very difficult to consider that you have it wrong. But I’ve been there with sidedress nitrogen applications. From the data, the best explanation is that there are years when, in some areas we don’t get enough rain after the sidedress nitrogen application to move that newly applied nitrogen to the root zone. In those drier years, the top of the soil profile is dried out and the plant is feeding deeper. You’ve all been to a field day where someone uses a backhoe to do a “root dig” to illustrate this point. You may have walked away with a mental note that what is below ground is bigger than what is above.

What do you do when data analysis doesn’t support your own theory? For me the first answer is to keep digging in the data. I’m sill a believer in split-applying nitrogen – including sidedressing a portion – but living through those dry summers would lead me to get the work done early. My second answer is to focus on pounds of applied nitrogen per bushel. Can I produce the same or more with less applied nitrogen by altering timing?

Got Data?

1. What are some of your theories or beliefs that are not showing up in your data? Can you dig any deeper

2. How might you weather-proof your nitrogen program? How might your data help in the process?

Paving the Way to Easy Data Transfer

I have had the privilege of being in the “Precision Ag business” for over 20 years now. A lot has changed since I started, but some fundamental issues still plague our ability to make it easier for users to leverage the various technologies that are available: having systems “talk to each other” technically referred to as “interoperability” is a key challenge. This issue is apparent from a recent survey conducted by AgGateway, a non-profit industry consortium that is focused on promoting and enabling the industry’s transition to digital agriculture with a goal of maximizing efficiency and productivity (www.aggateway.org). As an industry our goal is to make these technologies relevant to a large cross section of growers, so in the future we don’t refer to “Precision Agriculture” instead we just say “this is how you do Agriculture.”

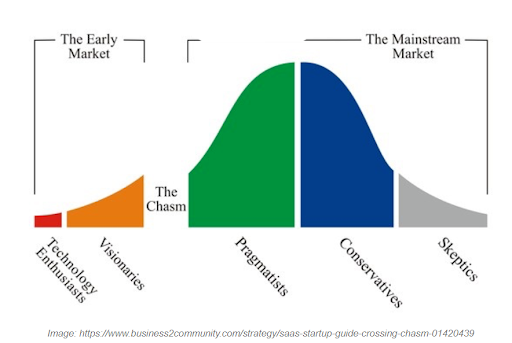
First, a little context – there is a generic technology adoption curve that is referenced in several industries which speaks to the challenges of achieving broad adoption. That challenge is referred to as “crossing the chasm.” Here’s a visual of what I’m talking about:

agriculture data transfer adoption curve

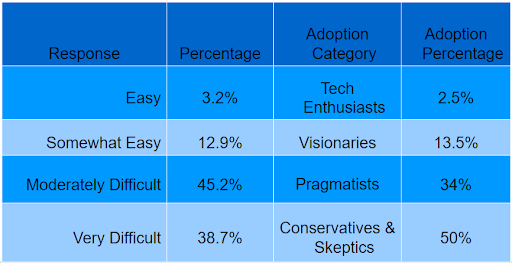
Let’s look at that survey now, here’s the question: “How easy or difficult do you find it to compile and analyze data from various sources?”  Essentially the question is asking how easy is it to get the systems of your choosing to “talk to each other?” I find it amazing how the responses follow a technology adoption curve which I show in the two right columns of this table:

agriculture data transfer ADAPT

84% of respondents indicated it is either moderately or very difficult! You can’t see broad adoption with those sort of experiences. At Premier Crop Systems we work with Advisors to make this process as easy as possible, and we have been very active as part of a larger industry effort within AgGateway to get to a common file format (or a “data decoder ring”) that can be used by any software or hardware system. It is a long journey, but a significant milestone has been achieved recently. The AgGateway “decoder ring” (a software component known as ADAPT) has been awarded a 2018 Davidson Prize for being one of the top three newly introduced products that are perceived to be the most innovative and will likely have a significant impact on agricultural production, efficiency, and/or safety https://www.asabe.org/DavidsonPrize. This speaks to the importance of solving this issue for the entire industry to take advantage of technology.

Getting systems to “talk to each other” is easy to say, but it is a complex problem to solve. One key ingredient to make it happen is to make sure the software and hardware companies know it is an expectation by the users for this to be accomplished. The AgGateway survey results are a telling indicator of the issue, but a larger signal came from the formal encouragement for “Precision companies” to commit to use ADAPT by the American Soybean Association, the National Association of Wheat Growers, the National Barley Growers Association, the National Corn Growers Association, the National Cotton Council, the National Farmers Union, The National Sorghum Producers, the National Sunflower Association, the U.S. Canola Association, the U.S. Dry Bean Council, USA Rice, and the American Farm Bureau Federation.

http://precision.agwired.com/2016/10/27/manufacturers-encouraged-to-implement-adapt/

At Premier Crop Systems we are actively working on using this “data decoder ring” to make it easier to have our software “talk to” other systems. While it is a work in progress, we are making great strides in the right direction to solve this complex problem.

How to Lower Your Breakeven Cost Per Bushel


Dan Frieberg talks with Delaney Howell and Mike Pearson with Global Ag Network sharing his insights on how to lower a grower’s breakeven cost per bushel. Dan talks about the strategy you need to sell bushels and not acres and how Premier Crop is different by offering a more refined and detailed management system. He compares what Premier Crop does to the Dairy Herd Improvement Association (DHIA), when the dairy industry started tracking production by the individual cow, and how Premier Crop is viewing data not only at the field level, but within parts of each field.

Therefore, as a farmer using Premier Crop, you are able to track your data by small increments of each field to increase profitability.

The Precision Ag “Easy” Button

Virtually every precision ag survey done with growers and industry over the last 20 years would rank “getting different systems to work together” as the greatest frustration and obstacle to growing the overall market.

It has seemed like each piece of software, each monitor and each system had their own unique file format. Sometimes “precision ag experts” could be defined simply as people that could make all of the technology talk to each other and actually work in the cab. Their value to growers wasn’t measured on whether the prescription made sense agronomically or economically – but just that they could make it work.

precision ag easy button

I want to take a break from this column’s normal message, using your data to make better agronomic decisions, to highlight a major industry effort to solve this daunting problem. The industry effort is called ADAPT and the ADAPT project is organized as part of AgGateway, an industry standards organization. For the past two years, two teams from participating industry companies have been meeting online every week. One team focused on technical issues and one team focused on business issues. ADAPT’s purpose: eliminate the major pain points to the broad use of precision agriculture data by easily enabling interoperability between different software and hardware applications.

Now, I’m not quite geek enough to understand some of terms and descriptions these folks use so I’ll try to explain their work as simply as possible.

The ADAPT solution allows each equipment manufacturer to keep their own proprietary software and technology in cab and monitor (Mobile Implement Control System) but all participating companies will “export to” and “import from” a common open-source ADAPT file format! Farm Management Information Software (FMIS), the industry’s term for companies like Premier Crop, will be able to program “one-time” and be able to receive data from all companies using the ADAPT format, including other FMIS companies. And program “one-time” to be able to export a prescription to any monitor that is using ADAPT.

This isn’t something that will happen – it’s something that IS happening right now! The ADAPT Team’s hard work has now paid off. Virtually all the major equipment companies and software companies have committed to using ADAPT. A formal press release will be issued soon.

You can lend your support to drive the effort even faster. Since companies respond to what growers (customers) want and need, you can add your support by logging on to www.adaptframework.org and follow the link to “CLICK HERE TO TAKE THE DATA MANAGEMENT SURVEY”. Let them know how important this effort is to you and your operation.

If you’ve been looking for the “Easy” button – it’s on the way!!!

Crop Research: Evidence-based Decisions

I’m always looking for parallels – examples from other industries on how they use data to drive better decisions. While on the road, I listened to several Freakonomics podcasts. One that related well was titled Bad Medicines, Part 2: (Drug) Trials and Tribulations.

Much of the podcast discussed how human medicine is transitioning from being “eminence-based” to “evidence-based”. Eminence is where decisions are based on the advice of a distinguished expert who has a combination of practical experience and powerful communication skills (still happens in agriculture). Evidence-based decisions results from randomized and replicated trials to drive future decisions.

Some of what the medical community believed to be true has now been proven to be wrong. But even the move to doing trials has had issues.

In the late 50’s and early 60’s, a new sedative called thalidomide was introduced in much of the world as a sleep aid. What was unknown about the drug, which was given to the general population including pregnant women, was that it caused fetal deaths and serious birth defects. At the time, President John F. Kennedy praised our FDA because the drug had not yet been licensed in the U.S.

One of the results of this tragedy was a decision to exclude women (because the risk of pregnancy) from all clinical drug trials. The podcast highlighted the fact that not doing trials on 50% of the population had unintended consequences with other drugs which behaved differently because of the differences in metabolism between men and women.

One of the obvious parallels for crop production is that most agronomic trials are done on the best soils in the best parts of the best fields. Most variety trials are intentionally located on well-drained, high fertility environments – the trial design is to eliminate any variables other than genetic differences. Just as women represented a significant under-tested percentage of the population, we don’t have many trials on our less than ideal soils. Using your own data to compare varieties or treatments on your less productive soils can be more valuable than any plot book.

Another similarity between medicine and crop production trials occurs when trial protocols are tilted to situations that favor the product’s performance. In drug trials, it can be as simple as choosing younger patients with the medical condition. Younger patients, as compared to older, tend to have fewer “additional” health issues that might mask or override the drug’s effects. Crop production trials can have a similar protocol bias. Testing a nutrient enhancer in a low fertility environment or a fungicide on a hybrid with a weak disease rating can show positive results, but they might not be representative of how the product performs on your soils with your hybrids.
agriculture scientific research trials

You can use your precision ag equipment to do trials in your own fields to achieve valuable results from your most challenging soils and fields. As human medicine has moved to evidence-based decision making, one thing they discovered is that approximately 15% of the time, an established treatment has been overturned or reversed. Since medical research greatly outspends agricultural research, it will be interesting to find out how much of what we thought we know isn’t correct.

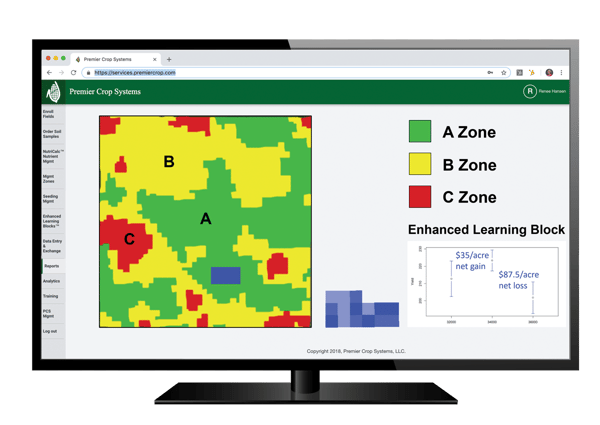
Premier Crop has developed Enhanced Learning Blocks. These scientific trials enable you to test new crop production inputs in randomized, replicated trials to identify optimal input rates for your local area with minimal risk. The scalable patent pending approach from these trials create local agronomic knowledge specific to your geography.