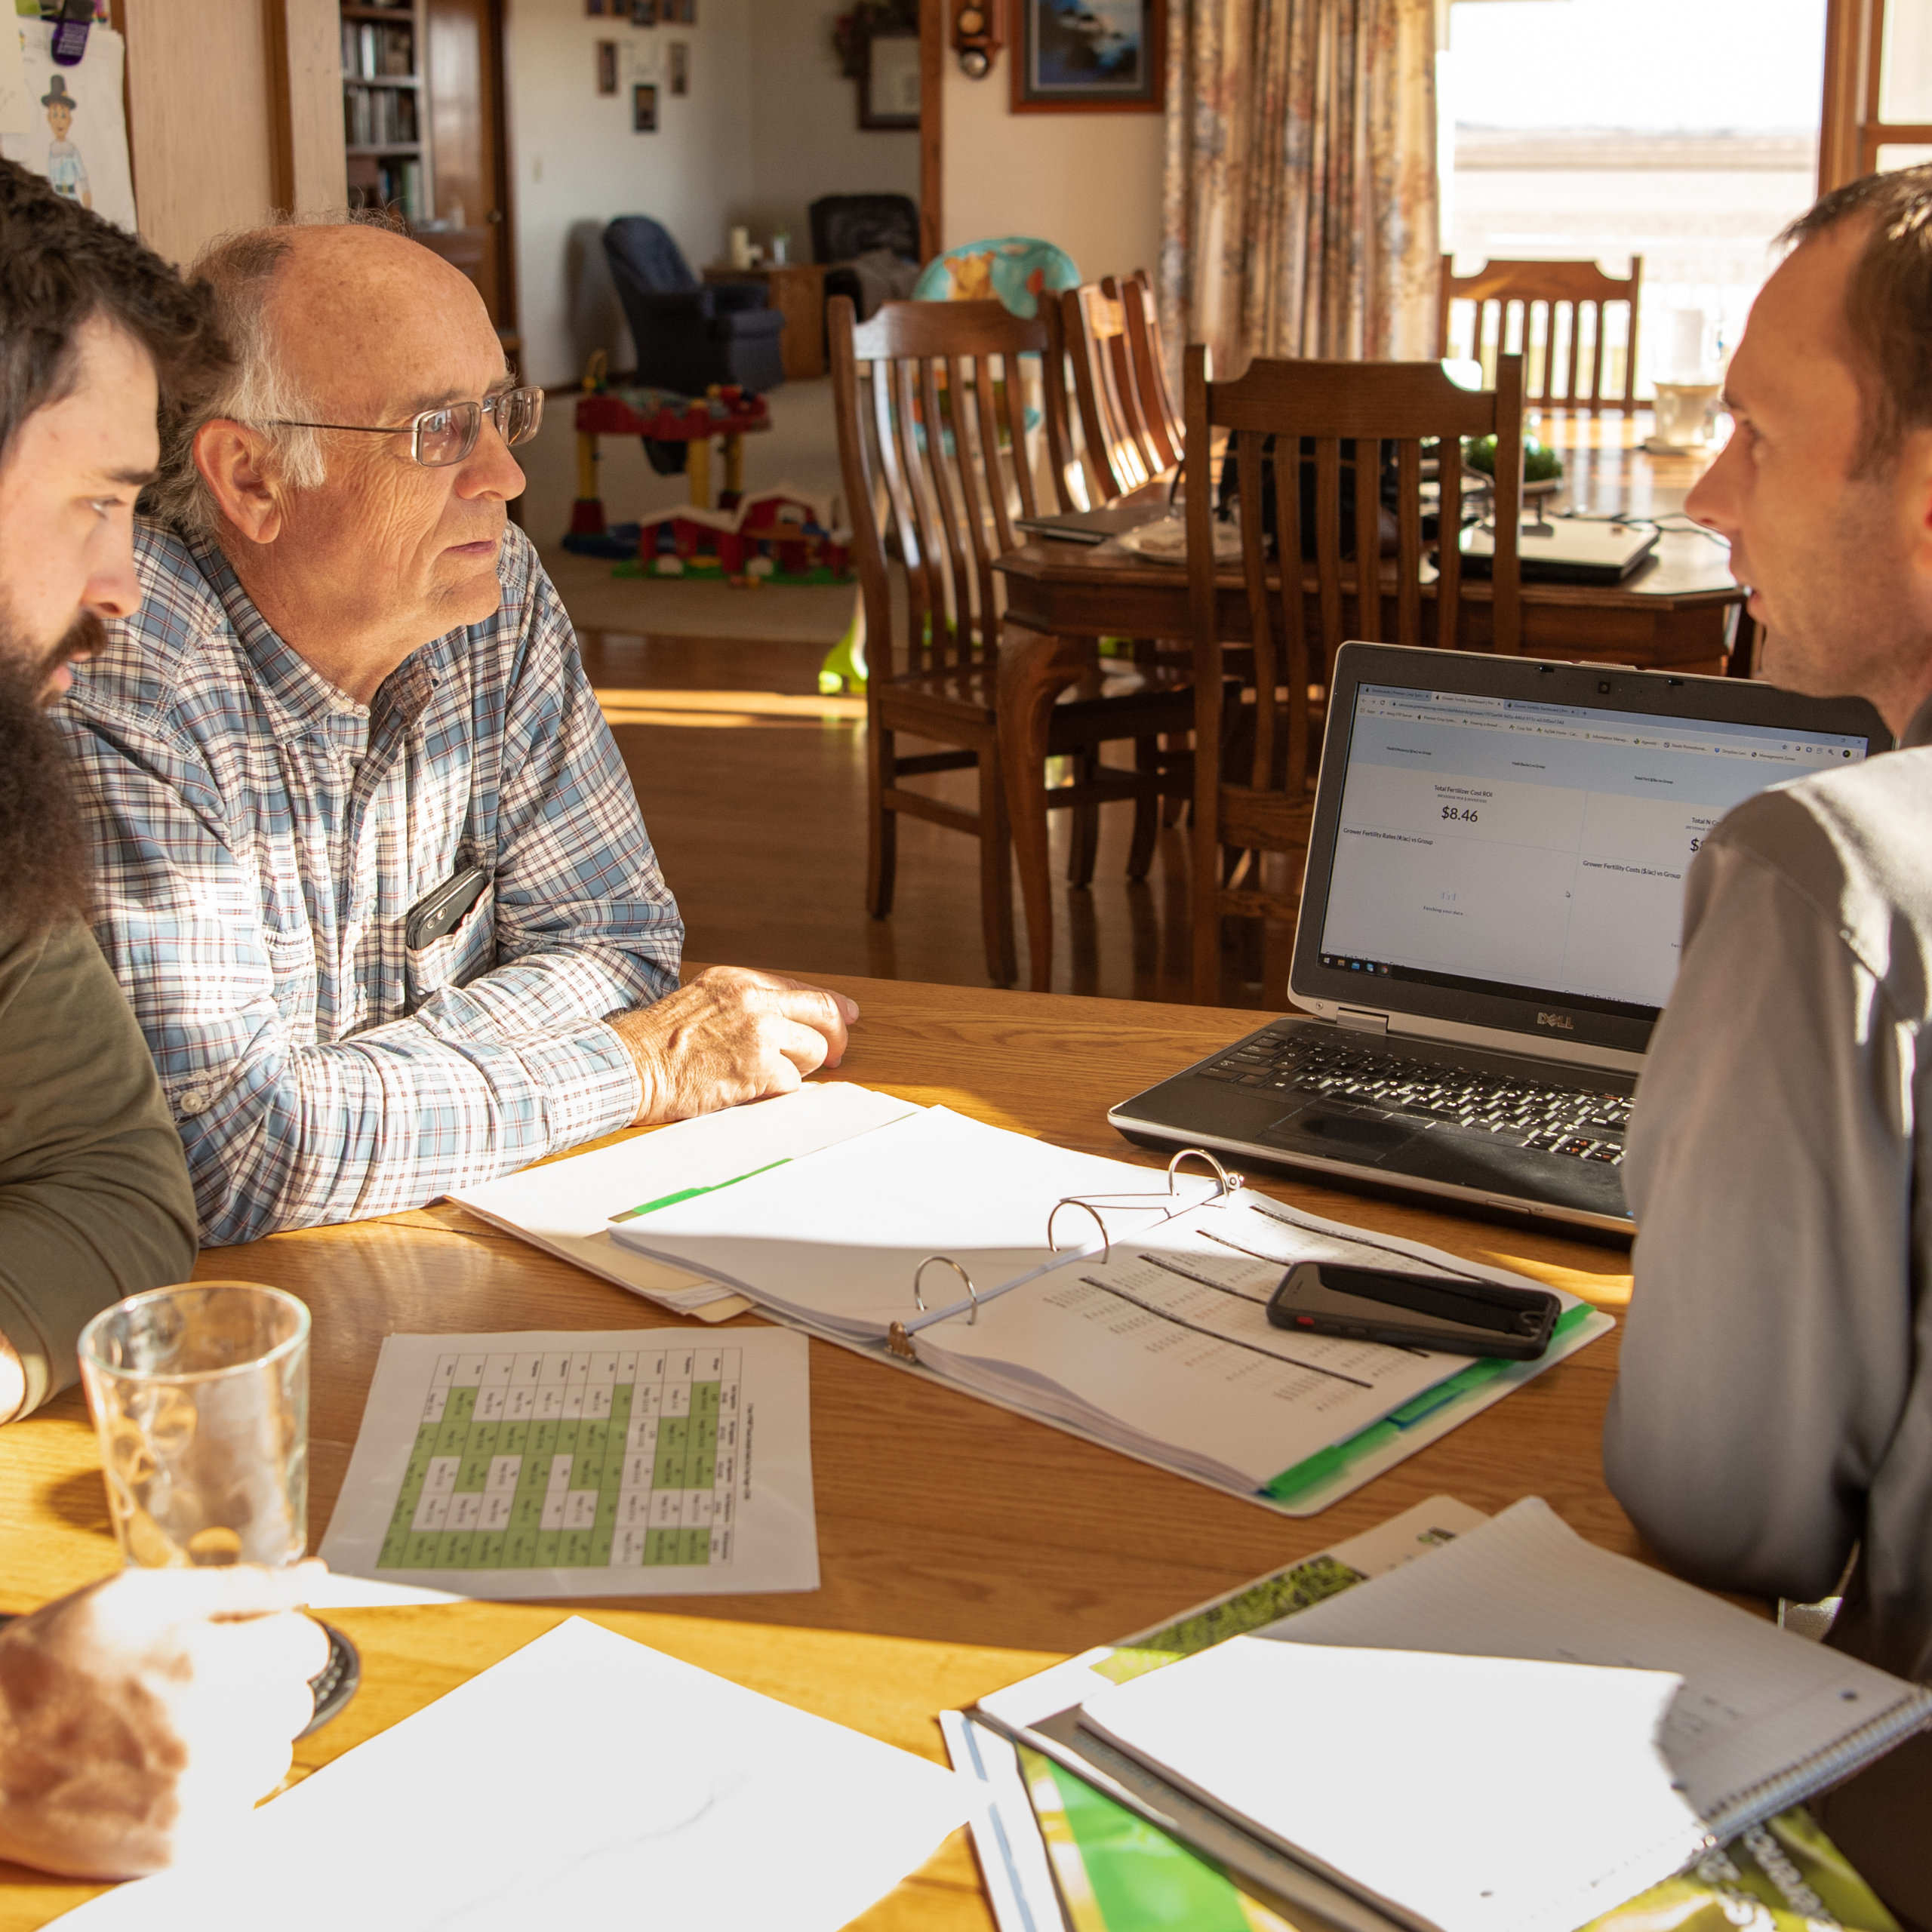
Today on the Premier Podcast, we’re listening in to a year end grower meeting with one our partners, SciMax Solutions.
PETER BIXEL: I’m Peter Bixel, SciMax Team Leader, and today we’re working with two of our clients, down here close to Des Moines, Iowa: Dale Meyer and Michael Myers. And I’ve been looking at their information, reviewing 2020 data this year and planning for 2021.
MICHAEL MYERS: I’ve been working with Peter and SciMax for, I think, around seven years, something like that. Time flies. I work with SciMax to help push us to the next level. It’s a really good precision ag database that they have, and adding VRT into our operation was a big part of that, using our yield data and going into our management zones and pushing the best acres as far as we can. We haven’t pushed them as far as we can yet, and that’s the goal for the future. It’s to push everything we can in order to get the best ROI and try to do the best job that we can.
DALE MEYERS: Before that, we were doing zone management for fertility by soil type. I mean, there was soil sampling, but it was, more or less, by the lay of the land and soil type. With the local co-op, we went to larger five-to-seven acre grids. They would spread it by areas, more or less, not necessarily by GPS but by a map.
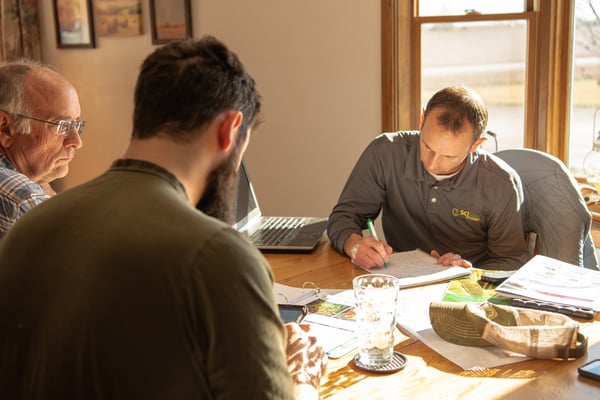
MICHAEL MYERS: Our precision ag and farm data was pretty rustic, overall. You just kind of guess where you were in the field. The biggest thing that helped us change was implementing yield data. As soon as we started picking that up, we needed something to do with it. Otherwise, what’s the point of getting it? Peter did a talk with Latham that made a lot of sense to us, that we could compile the yield data with our fertility, soil sampling, soil types, etc. And the biggest thing that he’s helped us with is to realize where we’re lacking, where we’re putting too much fertilizer on. I mean, it’s not a coincidence that our best yields have been over the past few years using SciMax’s precision ag tools.
Now, you have to have the weather to do that, but without SciMax’s help, we wouldn’t have averaged 240 as a farm average last year on corn. It probably would have been 210, 220, like your average farmer in the area would have been. But with us doing the extra things and managing better with their help, we were able to get more return. More or less, we’re not at the beginning of this, but we’re starting to take the steps that’ll start pushing us even higher, I think.
It’s not something in that we implemented everything right away, but we’re implementing some things more and more every year. We’re trying to build our soils on fertility-level more this year than we have in the past. And looking at the farm data he gave us today, I mean, if we continue the trend of what the farm data is saying, then that should pay off. Peter’s a really good guy to work with, too. There are other people that offer precision ag or something like it, but Peter’s the thing that kind of puts that all together, as far as SciMax marrying with Premier Crop and then bringing that to us. If he was a different person, I don’t know if we’d still be with them or not. I don’t know, but he’s keeping us for sure.
DALE MEYERS: I think it’s safe to say that the majority of the farmers of my generation operated on a status quo thing up to a point. Then, the yield monitors came in to where we could see: “Oh, wow. I never realized that the wet spot was affected so much by the excess water.” So, a lot of tiling has happened because of that, and then, also, the fertility side with different soil types. In parts of the field that are high yielding, we were pulling a lot more nutrients off than we thought. I guess, maybe, we just didn’t even think.
Precision ag kind of sharpened everything because you didn’t really know the advent of the yield monitor, as well as grid sampling and other things. Hybrids have improved, there’s no question about that, but, all in all, we’re doing a better job. We’re doing a better job of planting, as far as placement, depth and spacing, but particularly depth, or emergence at the same time. It’s easy for the seed companies to take a lot of credit, and they deserve a lot of credit, but the farm equipment’s and farm data management changed this picture a lot, too.
PETER BIXEL: Well, I think, studying the hybrids and placing them where they need to go makes a big difference, too. Before, maybe, if you were my partner, you just buy: “Yep, these three are good.” The dealer sold them to him. Where did you plant them? “It didn’t matter. You just plant them wherever you want.” No, there is a difference. You know that, Michael.
MICHAEL MYERS: Getting yield maps gives you a picture of what happened that year, and then making that into managing the zones, that shows us what has happened over many years. I mean we have a memory, but we don’t have a the farm data memory where we can go back and say: “Okay, this area of the field did this, and, on average, it’s kind of been a B area. Or it’s a C area or an A.” We can break that down, and then we can also look at the fact, and I mentioned it too, as far as fertilizer, where: “Okay, what did the field make? Did it do 200? Okay, we’ll put a flat rate of crop removal of 200 across the whole field.” Well, that’s not the truth.
The truth is that the poor areas did 160, the medium areas did 200 and the high areas did 240. I mean, it varies, right? But that’s kind of the idea. I, over the past several years, have really been putting a lot of thought to the fact that I would really like to see what our yields would be today if we would’ve started doing precision ag and variable-rate fertilizer five years ago because what we’ve been doing is taking off 240-bushel corn on a good area and putting 200 bushels of nutrients back on. So, we’re stealing away from our good areas and adding to our poor areas. In those poor areas, you’re never going to yield what the good areas are going to do.
So, we can better utilize our money as far as our investment into fertilizer, and then that should pay dividends in ROI and harvest time, too. That’s one of the biggest things, I would say.
PETER BIXEL: Their retailer in the past wasn’t able to really do the field history either, so now they’ve made a big change and adjusted things. Including adding strip-till.
CREATING NEW MANAGEMENT PRACTICES FROM FARM DATA
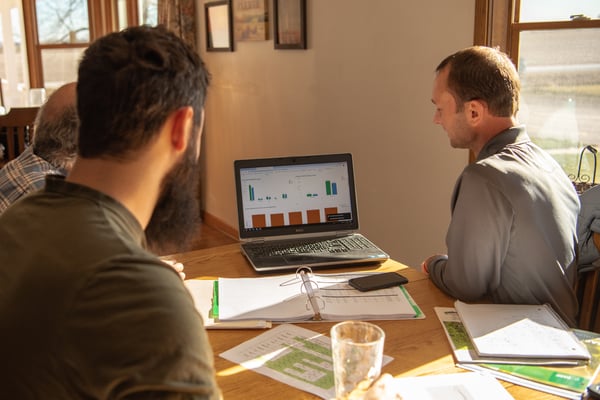
PETER BIXEL: We’ve come up with tissue sample ranges by stage for corn and soybeans on each nutrient. So, this is that line, and then, basically, it’s just the group average zone, all we did overall here. You’ll get yours with this graph, and then we’ll always plot their individual data on here. It’s kind of interesting. I mean, we’re pretty close to the limit. We tracked pretty close on nitrogen. Really, we weren’t that far off comparatively.
MICHAEL MYERS: I’d like to see the guys that did the KTS. Can we group that data and look at it?
PETER BIXEL: Yeah.
MICHAEL MYERS: Our application was right at V5, V6. So, we gained more stalk, but where is manganese?
PETER BIXEL: Right here. (pointing to the field map on the computer)
MICHAEL MYERS: My manganese went through the roof, like right in there. I put it in with the KTS. Then I put that Versa Max, and that’s got manganese in it, and I took my manganese levels from like 80 to 100 clear up into 140s, and they stuck around until probably V10. I graphed it all out myself. Let me grab it. I think I got a pamphlet right here.
TISSUE SAMPLING
PETER BIXEL: Well, we’re trying to define trends for just seeing what the plants are telling us. It’s no different than a blood test, which you could say: “Well, that’s overkill.” Yeah, but the plants, the weather and everything change so much every stage, depending on the growing season.
Like there in the middle of May, we didn’t hardly gain any GDUs for like two or three weeks because it was just cloudy and cool. Then, we took off, and we were growing like two stages from V4 to V6 in five days. The nutrients change by that stage. It’s kind of a way to gauge where the plants are at. Michael’s been pulling two different farms, and you pull in an A zone and just kind of track and see what they’re telling us. Not everybody, but the majority of us, will go, and apply what we feel the plant needs.
Then, like he’s looking now to see: “Okay, if we applied zinc and manganese right before this tissue sample, and we applied it and we came back a week later, did we see the uptake?” Did the plant tell us they got it? Like my zinc and manganese, I think it took like about two weeks, two sampling times, for it to really uptake. For my potassium, I’ve got to look back. I can’t remember this off the top of my head. I think it took about three weeks because potassium is mobile. It takes water to get it down the soil. We didn’t have a whole lot of moisture, obviously, but Michael and I Y-dropped to put it next to the row so it would hopefully get in faster.
MICHAEL MYERS: Yeah, I just remember on the home farm, on the treatment out here, that the manganese just went through the roof. So, I know I can raise those loads.
PETER BIXEL: Manganese has been one that we’ve kind of struggled with, especially later on, but this year. I think some of it was due to the dryness, too. We didn’t have as much water as the last two years. So, it wasn’t flushing it through this profile. We were able to keep reasonable. The black line is where we want to be at, and you can see that. You got the polynomial or you got just the average of the polynomial for our group, and so we were able to stay a little bit better on that.
The other thing, to me, that was pretty interesting was how boron’s been. If you look at the past years, we’ve been just horrible. We just tanked on boron. We would never come back up to where we’d like to be at but this year. Some of this, too, I believe, is we’re getting a lot more guys that are throwing boron in with their fungicide. Not everything, but some of that’s been helping bring those levels, I feel as a group, at least, up. We stayed pretty good, and the reason I think we stayed good on boron is that it’s mobile. We didn’t have rain, and we didn’t continuously keep flushing that deeper and deeper in the profile. I think we’ll talk and see what everybody thinks next week. We can quit at like V10, V12, just because nobody’s been significantly doing anything different after that point.
PETER BIXEL: I know it would have because look at what you did last year. So, Michael and Dale, they’ve been doing some different stuff last year. It definitely showed, I think, good stuff for all your treatment, boron and zinc already, and things like that. I guess it kind of tells me they weren’t, I wouldn’t say, normal conditions. They had more rain than you but not normal. I guess that just tells me that we’re still going to keep playing, but we also learned our normal standard practices. It’s probably still a benefit if you’ve got that one limiting factor, whatever that is. It’s potassium in their case. He said it was like 130 to 140 parts per million. Spend the money on it. Get the foundation built. Then, you can start to worry about wider operation or extra phosphorus.
MICHAEL MYERS: It just goes back to that. Every time we plant a seed, it’s got its maximum potential, and as the season goes on, that lowers, lowers and lowers. Well, with potassium, and I’ve thought about this a decent amount, it’s more important than about every of the other major ones earlier. Maybe phosphorus is there, too, but as far as potassium, most of its uptake is V6 to 12-ish. Phosphorus, sulfur and, obviously, nitrogen are all after that. So, which of the four biggest nutrients is going to pull our potential down the most in that first, until V8? Well, it’s probably potassium. So, if we don’t have potassium there, that potential is already capped.
PETER BIXEL: Correct. You can put on as much nitrogen as you want if you think it’s efficient, like you said. After that fact, it doesn’t matter because K has got to be there to move it up in the plant. When you grid sampled and then started doing the strip, I think it’s good, especially with what we’re doing and trying to build the 250 and stuff that we’re doing on the farms and using the management zones. I’m trying to continue to build that. On your beans this year, with new soil sample data, which is not the best year in yields and stuff like that, you were at 144 parts per million of potassium, and you went to 176. Pretty steady increase and a direct correlation. We saw that, yeah, you went from 27 bushels to 57, a 30-bushel acre advantage.
MICHAEL MYERS: On just a 30 parts per million difference.
PETER BIXEL: Correct. So, I think as we sample some other farms — I don’t think everything got sampled. I can’t remember the majority of stuff, but as we get the new stuff on the rest of the farms, it’ll be interesting to see. That was something I pointed out where, like you said, potassium, and we see this with a lot of clients, at 22 to 26. Not really a huge correlation.
CORN ON CORN FARM DATA
MICHAEL MYERS: I was really impressed with how I did this fall corn on corn over here, and we vertical tilled at first. Well, we did that, so we could put anhydrous on.
PETER BIXEL: How deep did you do the vertical till?
DALE MEYERS: Through May, three to four inches.
PETER BIXEL: How deep was the strip-till in?
MICHAEL MYERS: About four to five. It can go six, just depends.
PETER BIXEL: That’s why I don’t think our lows aren’t as low. Maybe that’s some of the genetics or fertility, things like that, too.
MICHAEL MYERS: We’ve mentioned we have more potential on all of our corn going into July, except our corn-on-corn. It’s awful. Yeah, there’s a pond right there.
PETER BIXEL: Our corn-on-corn, for the group, averaged 165. Our first-year corn was 190. So, that tells you that we haven’t seen that big of a spread between those two for a lot of years.
DALE MEYERS: We’ve not had this consistent-looking crop at harvest time on corn-on-corn ever, that I can remember.
MICHAEL MYERS: As far as spacing and the beans being there.
DALE MEYERS: We had a good growing season, but that all started when it came up.
PETER BIXEL: Well, we didn’t have a lot of wet feet in great conditions, like you said, to come out on soil. You only had nine inches. With the weather Premier grabs, nine inches of rain is all I had. This area is definitely the lowest.
MICHAEL MYERS: Probably over half of that came before July 1st.
PETER BIXEL: It came before June. He keeps track of some calendars. He’d have every rainfall.
DALE MEYERS: The people that run the auction over here at Guthrie Center, what did he tell him?
MICHAEL MYERS: He was worse yet. What was it?
DALE MEYERS: They only had a couple of inches all summer.
MICHAEL MYERS: We had about an inch, an inch and a quarter in July, and then about the same in June. They didn’t even get an inch in either of them.
___________________________________________________________________________________________
- For more helpful tips and insight on all things data and agriculture, visit our blog at http://info.premiercrop.com/blog
- Curious about precision ag? Download our 5 Steps to Getting Started Guide: http://info.premiercrop.com/5-steps-guide
- Ready to cut through the bull? Download our No Bull Guide to Precision Ag: http://info.premiercrop.com/field-profitability-guide
- Podcast provided by Premier Crop Systems. Learn more about us at https://www.premiercrop.com

